
Abstract
Objective:
There is no study on the relationship between triglyceride-glucose index (TyG index) and skeletal muscle mass in middle-aged and elderly C population. Therefore, the aim of the study is to investigate the relationship between the TyG index and weight-adjusted relative skeletal muscle index (RSMI) in middle-aged and elderly C population.
Methods:
We retrospectively studied 947 aged ⩾40 years subjects who got a routine medical examination in the Department of Geriatrics of R Hospital from May 2021 to March 2023. The RSMI was designed to evaluate skeletal muscle mass and calculated based on lean mass of the limbs(kg)/body weight(kg) × 100%. Skeletal muscle mass reduction was defined as a RSMI of 1-2 standard deviations (SD) below of healthy adults aged 30-49 years old. Considering the quartile groups of the TyG index, the subjects were assigned to 4 groups: Q1 (less than or equal to 8.171), Q2 (from 8.172 to 8.569), Q3 (from 8.570 to 8.992), and Q4 (greater than or equal to 8.993).
Results:
With TyG index increased, RSMI levels significantly reduced(P < .001). Spearman’s correlation analysis showed that the TyG index was negatively correlated with RSMI in males (r = −0.320) and females (r = −0.240). The TyG index was positively correlated with body mass index (BMI), systolic blood pressure (SBP), diastolic blood pressure (DBP), triglyceride (TG), total cholesterol (TC), low-density lipoprotein cholesterol (LDL-C), fasting plasma glucose (FPG), alanine aminotransferase (ALT), and aspartate aminotransferase (AST) (P < .05). Besides, binary logistic regression analysis showed that the risk of developing reduced skeletal muscle mass in the group Q4 was 2.131 (95%CI:1.118-4.064) in males; and was 2.472 (95%CI:1.581-3.867) in females compared to the Q1 group.
Conclusion:
TyG index was negatively correlated with relative skeletal muscle index, and a higher TyG index was associated with the development of reduced skeletal muscle mass independently of other influencing factors. Therefore, the TyG index promises to be a predictor of skeletal muscle mass loss.
Introduction
Sarcopenia is widely recognized as a disappearance in skeletal muscle content and a lessening of skeletal muscle quality and physiological function with getting old. 1 Decreased skeletal muscle mass is one of the manifestations of sarcopenia. Skeletal muscle mass was impacted by many factors, including aging, disuse, lifestyle habits, cancers, etc. For normal adults, skeletal muscle mass decreases by about 9 kg between 40 and 70 years old and the reduction rate of skeletal muscle mass will further accelerate after 70 years old. 2 Low muscle mass may increase the possibility of tumbles, movement disorder, frailty, hospitalization, and death in old people, and its insidious characteristics make it throw an enormous economic and life health burden on society. 3
Several ex vivo and in vivo studies have shown that insulin resistance may reduce skeletal muscle mass by weakening skeletal muscle protein anabolism and enhancing catabolism.4,5 Given the enormous impact of insulin resistance on skeletal muscle mass, it is of great clinical importance to identify targets that can screen for abnormal glucose metabolism in patients with lower skeletal muscle mass. Insulin resistance may cause reduced glucose intake in the muscular system and impaired glucose utilization in hepatocytes, resulting in high plasma glucose and triglyceride levels. 6 The triglyceride-glucose index (TyG index) is an index to evaluate lower insulin sensitivity by fasting glucose and triglyceride. 7 Antecedent surveys have implied that the TyG index is in good agreement with some insulin resistance assessment methods, including the hyperinsulinism-euglycemia clamp experiment and homeostatic model assessment for insulin resistance (HOMA-IR).8,9 Recently, several clinical statistics have also discovered TyG index preferably reflected the emergence of metabolic diseases that might along with insulin resistance, such as atherosclerosis, diabetes, and chronic liver disease compared with HOMA-IR.10-12 Numerous studies have described Korean populations and found the TyG index was negatively associated with skeletal muscle mass based on dual-energy X-ray absorptiometry.13,14 In addition, related studies have been reported in Chinese populations. 15 Some researchers found a positive association between TyG index and reduced skeletal muscle mass, 16 but there are also specific groups in which the association is reversed, such as people with diabetes. 17 The researches indicated that heterogeneous measurement methods and sample-selection yielded mixed results. Furthermore, sarcopenia occurs commonly as an age-related process in older people. However, studies on the association between TyG index and skeletal muscle mass in middle-aged and elderly C population are limited.
In the present case, we investigated the connection between the TyG index and reduced skeletal muscle mass in the eastern coastal region of C population aged ⩾40 years by a cross-sectional survey method.
Methods
Study population
This study included 947 subjects aged 40 and over who got a routine medical examination in the Geriatrics of R Hospital. The enrollees signed a written informed consent form and underwent anthropometric information and blood sample collection. Relevant biochemical indexes were executed by the Clinical Laboratory Department.
Inclusion criteria
(1) C population; (2) ⩾40 years old.
Exclusion criteria
(1) acute infection; (2) malignant tumor; (3) rheumatic immune disease; (4) hepatic impairment (alanine aminotransferase level greater than or equal to 2 times the upper bound of normal value); (5) renal dysfunction (creatinine clearance < 60 mL/min); (6) cardiac insufficiency; (7) severe obstructive pulmonary disease; (8) edema; and (9) incomplete baseline data.
Measurements
Physical examination
Physical examination is carried out by the staff of the Department of Geriatrics of R Hospital. Height, weight, and blood pressure were tested and lifestyle habits of subjects were asked. Height and weight were detected by a bioelectric impedance analysis instrument (Inbody 770, Korea), aiming to calculate the body mass index (BMI).

The receivers were demanded to have a break for about 5 minutes in a tranquil environment, and then the arterial blood pressure of the right upper arm was surveyed using a uniform type electronic sphygmomanometer. Finally, the nurse recorded systolic blood pressure(SBP) and diastolic blood pressure(DBP) readings.
Biochemical index test
The subjects were requested to jejunitas for 8 hours, then to draw fasting elbow venous blood 5 mL in the next early morning. Fasting plasma glucose (FPG), total cholesterol (TC), triglyceride (TG), high-density lipoprotein cholesterol (HDL-C), low density lipoprotein cholesterol (LDL-C), aspartate transaminase (AST), and alanine transferase (ALT) were detected by the biochemical analyzer (Cobas 8000, Switzerland) and calculated the TyG index to evaluate the degree of insulin resistance.

Skeletal muscle measurement
Body composition, including skeletal muscle mass and fat content of the limbs, was surveyed using a bioelectric impedance analysis instrument (Inbody 770, Korea). The lean mass of limbs (also known as appendicular lean mass, ALM (kg)) was considered the collection of upper and lower extremity lean soft tissue weight. 18 The skeletal muscle mass of subjects was computed by weight-adjusted relative skeletal muscle index. 19

Low skeletal muscle index (LSMI) was considered as a reduction of ⩾1 SD from the ordinary RSMI of healthy adults aged 20-39 years. Low skeletal muscle mass thresholds: males: RSMI < 30.0%; females: RSMI < 26.8%. 20 The calculation method of the body fat percentage (BFP) is as follows:

Grouping
Given the quartile groups of TyG index, Q1 (less than or equal to 8.171), Q2 (from 8.172 to 8.569), Q3 (from 8.570 to 8.992), and Q4 (greater than or equal to 8.993) were divided.
Statistical treatment
Continuous variates were represented by mean ± standard deviation or median (Q1, Q3); disaggregated variates were expressed by n (%). One-way ANOVA or Kruskal-Wallis H test was used to contrast group differences in TyG index for continuous variables; chi-square test was used to contrast inter-group differences for disaggregated variates. For continuous variates, Wilcoxon rank-sum test and Student’s t test were used to compare inter-group differences with control and case groups. Binary logistic regression was applied to evaluate the connection between TyG index and skeletal muscle mass after adjustment for longevity, smoking history, alcohol consumption, SBP, DBP, ALT, and AST. Samples statistical power was calculated by G*Power 3.1.9.7 (Windows; Germany). For statistical analysis, we used SPSS 26.0 statistical software (Windows; Chicago, IL, the USA). A P-value of less than .05 was deemed to be statistically significant.
Results
Distinction of essential information and clinical indexes between groups with different TyG index levels
One-way ANOVA, Welch’s one-way ANOVA, and Kruskal-Wallis H-test showed that BMI, BFP, SBP, DBP, ALT, TG, TC, and FPG were greater in Q2, Q3, and Q4 groups than in Q1 group (P < .05), and HDL-C was smaller than Q1 sample data (P < .05). The appearance of LSMI gradually increased accompanied with a growing TyG index. The incidence rate of LSMI in group Q1 was 22.13%, and the rate of LSMI in group Q4 was 43.33% (P < .001) (Table 1).
Baseline characteristics according to the quartiles of the TyG index.

Abbreviations: ALT, alanine aminotransferase; AST, aspartate transaminase; BMI, body mass index; DBP, diastolic blood pressure; FPG, fasting plasma glucose; HDL-C, high density lipoprotein cholesterol; LDL-C, low density lipoprotein cholesterol; RSMI, relative skeletal muscle index; SBP, systolic blood pressure; TC, total cholesterol; TG, triglycerides.
Data are expressed as median, mean ± SD, n (%).
Kruskal-Wallis rank sum test. **Chi-square test. ***Welch one-way ANOVA. ****One-way ANOVA.
Comparison of general information and biochemical indicators between NSMI and LSMI groups
The study subjects were classified into normal skeletal muscle index (NSMI) and LSMI groups that contained 173 males and 133 females with LSMI.
The basic clinical information and clinical laboratory indexes of the NSMI and LSMI groups are detailed in Table 2. Non-parametric alternative to the dependent t-test and Student’s t-test showed that the differences in longevity, smoking history, drinking history, TC, and LDL-C were not obvious discrepancy between intergroup (P < .05); whereas in the LSMI group, BMI, SBP, DBP, BFP, TG, FPG, and TyG index were distinctly greater than those indices of the NSMI members, the variations featured statistical significance (P < .001) (Table 2).
Basic characteristics of the NSMI and LSMI groups in different genders.

Abbreviations: ALT, alanine aminotransferase; AST, aspartate transaminase; BMI, body mass index; DBP, diastolic blood pressure; FPG, fasting plasma glucose; HDL-C, high density lipoprotein cholesterol; LDL-C, low density lipoprotein cholesterol; RSMI, relative skeletal muscle index; SBP, systolic blood pressure; TC, total cholesterol; TG, triglycerides.
Data are expressed as median, mean ± SD, n (%).
Wilcoxon rank sum test. **chi-square test. ***Student’s t test.
Correlation between TyG index and various indicators
The correlation between TyG index and age, RSMI, BMI, SBP, DBP, TG, TC, HDL-C, LDL-C, FPG, AST, and ALT were analyzed using Spearman’s correlation in all the study subjects. The research showed that in males, TyG index was closely associated with BMI, SBP, DBP, TG, TC, LDL-C, FPG, AST, and ALT (P < .05), and inversely correlated with age, RSMI (P < .001), and HDL-C (P < .05). For females, TyG index was also associated with age, BMI, SBP, DBP, TG, TC, LDL-C, FPG, AST, and ALT (P < .05), and negatively related with RSMI (P < .001) and HDL-C (P < .05) (Table 3).
Spearman partial correlation analysis of the TyG index with clinical, metabolic, and body composition parameters.

Abbreviations: ALT, alanine aminotransferase; AST, aspartate transaminase; BMI, body mass index; DBP, diastolic blood pressure; FPG, fasting plasma glucose; HDL-C, high density lipoprotein cholesterol; LDL-C, low density lipoprotein cholesterol; RSMI, relative skeletal muscle index; SBP, systolic blood pressure; TC, total cholesterol; TG, triglycerides.
Furthermore, in order to show the relationship between TyG index and RSMI visually, a scatterplot was created using https://www.xiantaozi.com/. As shown from Figure 1, the Spearman’s correlation coefficients between TyG index and RSMI in males and females were −0.320 (P < .001) and −0.240 (P < 0.001), respectively.
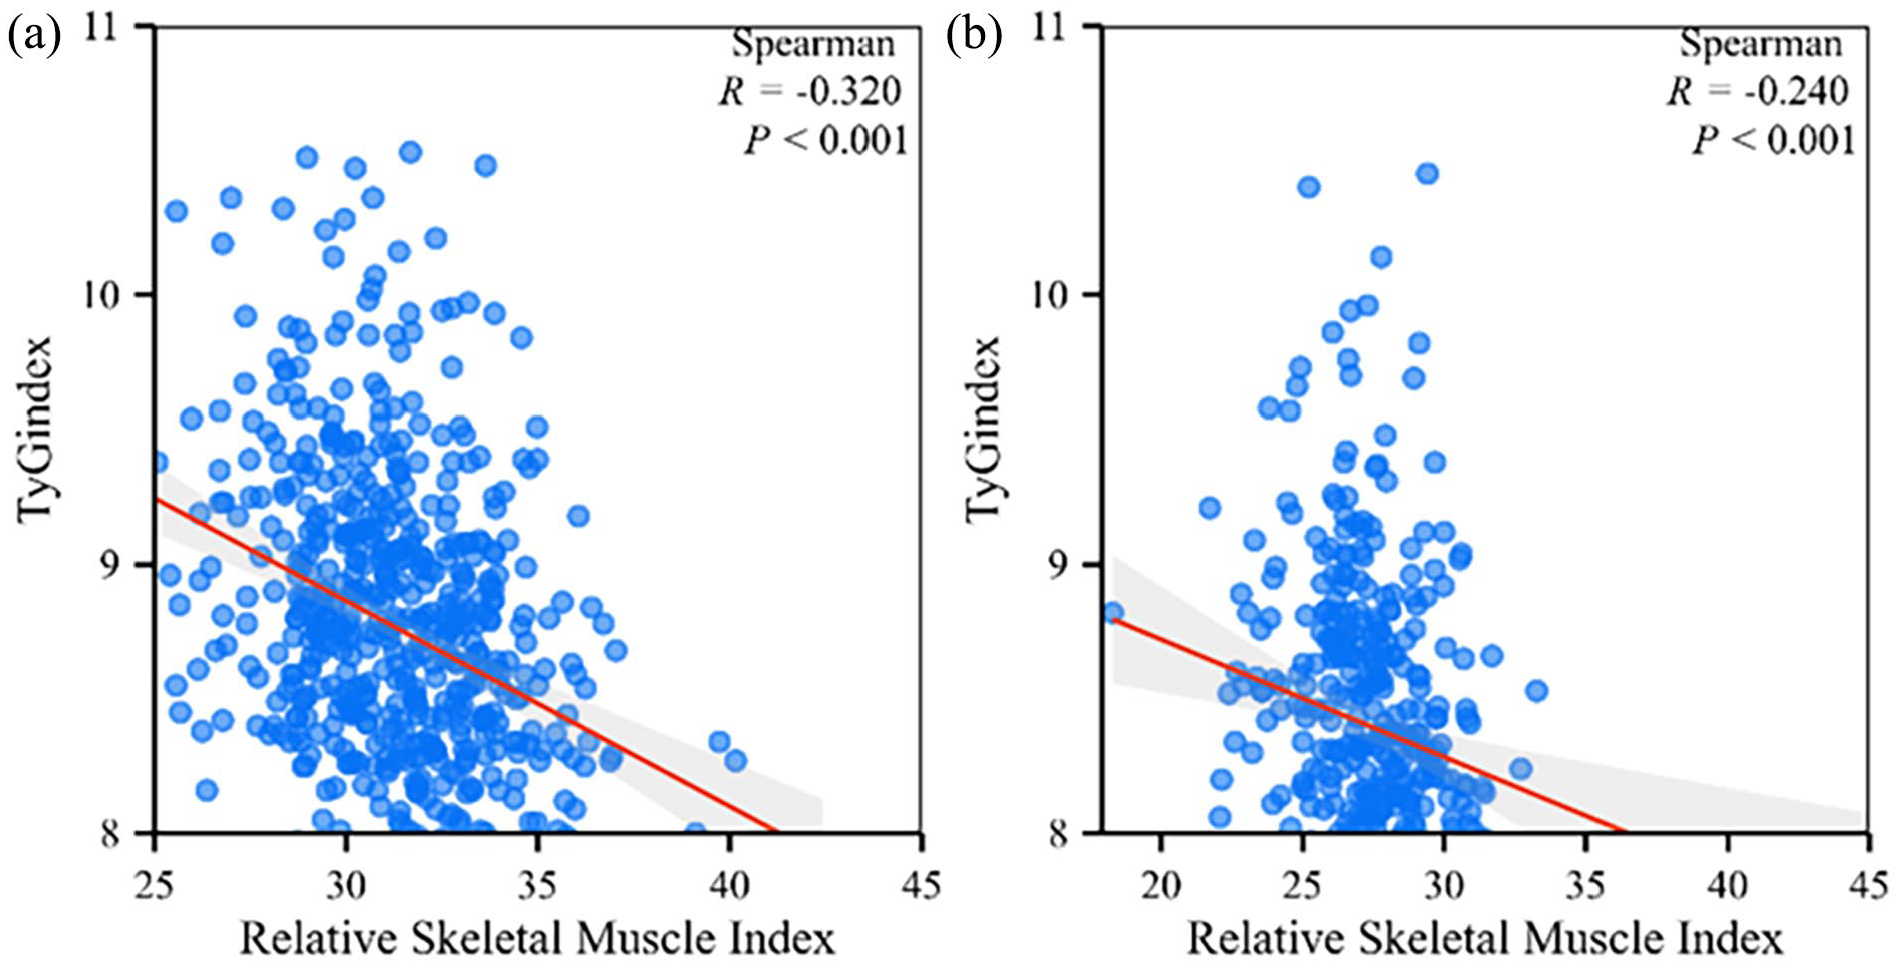
Linear relationship between TyG index and relative skeletal muscle index in different genders. Scatter plot of the TyG index with relative skeletal muscle index in (a) males and (b) females.
The relation between TyG index and reduced skeletal muscle mass by logistic regression
Logistic regression analysis was performed, and the Q1 group was defined by the reference, TyG quartiles as the unattached variable, and SMI as the induced variable. Model 1 unadjusted for all cofounding factors, Model 2 adjusted for age and lifestyle, Model 3 adjusted for age, lifestyle, and blood pressure, and Model 4 adjusted for age, lifestyle, blood pressure, AST, and ALT. The results showed that in males, Model 4 showed that the ORs of LSMI was 2.131 times in group Q4 than in Q1 (P = .022) (Table 4, Figure 2). For females, Model 4 showed that the occurrence risk of LSMI in Q4 was 2.472 times superior to that in Q1 (P < .001) (Table 4, Figure 2).
Logistic regression analysis of the risk of LSMI in the TyG index quartile group of males and females.
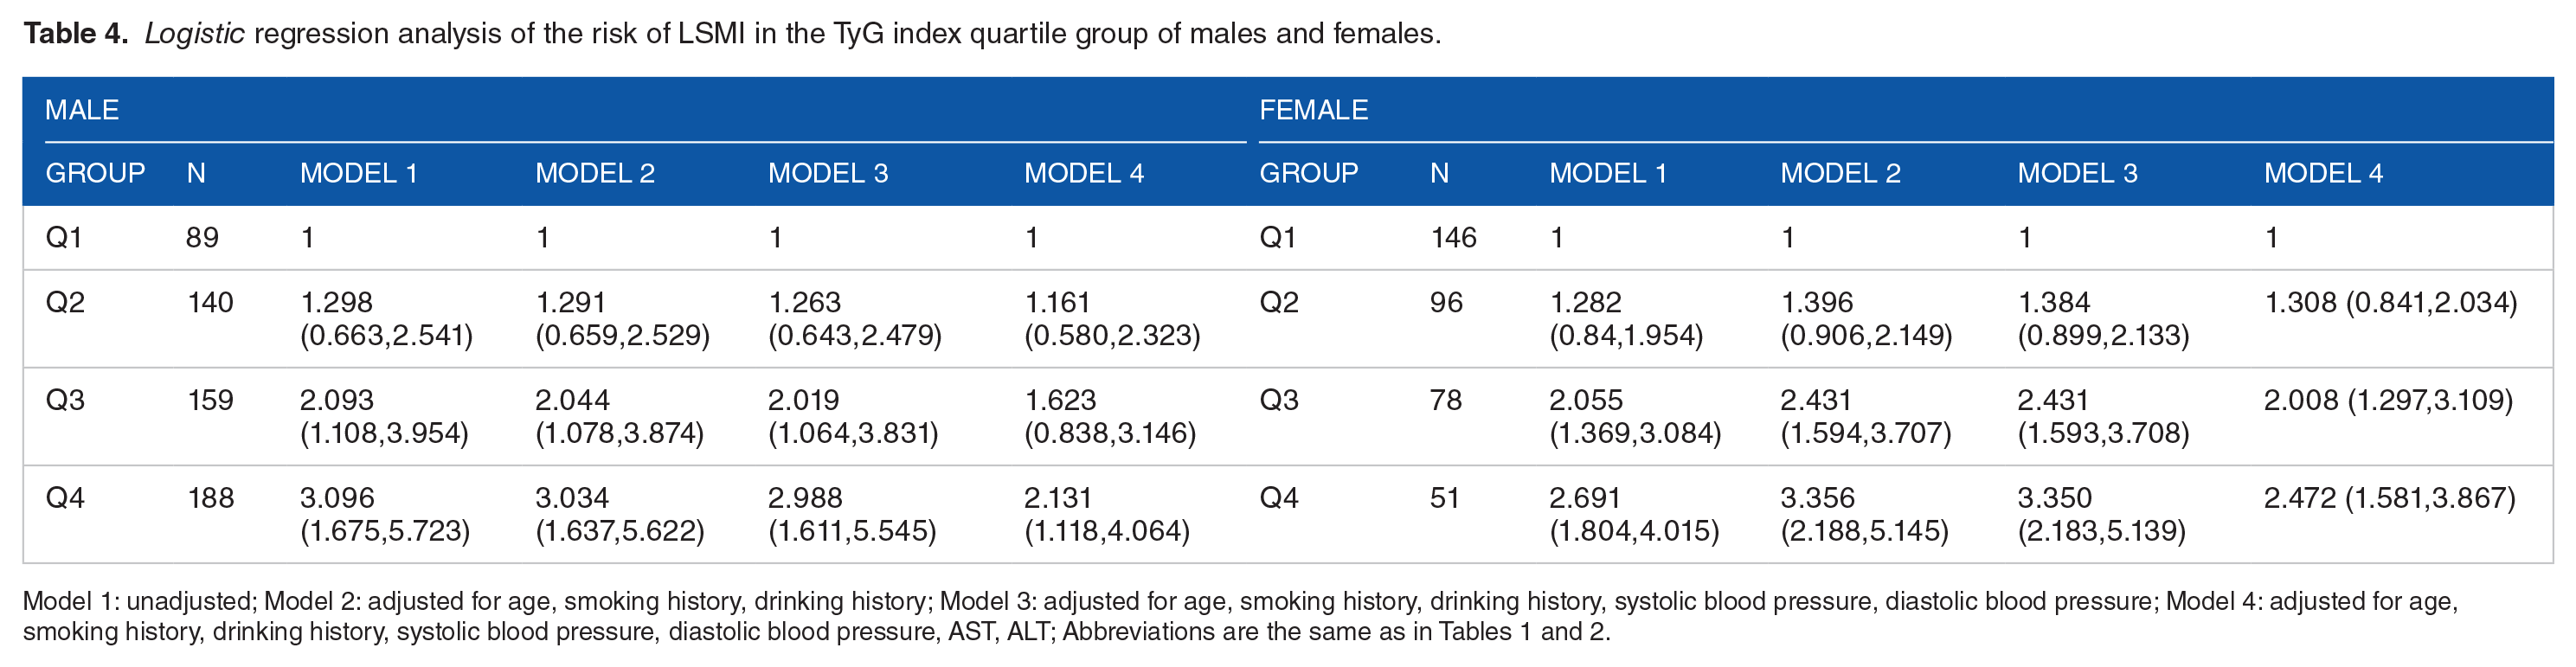
Model 1: unadjusted; Model 2: adjusted for age, smoking history, drinking history; Model 3: adjusted for age, smoking history, drinking history, systolic blood pressure, diastolic blood pressure; Model 4: adjusted for age, smoking history, drinking history, systolic blood pressure, diastolic blood pressure, AST, ALT; Abbreviations are the same as in Tables 1 and 2.

Logistic regression analysis of the risk of LSMI in the TyG index quartile group of males (a) and females (b). ORs for the relationship of the TyG index with sarcopenia for males. Dotted line: reference; solid line: 95% confidence interval (CI).
Discussion
The research revealed that increased TyG index was inversely related to weight-adjusted skeletal muscle index for the C population aged 40 or over. More remarkable levels of TyG index were related to an enhancive possibility of LSMI after modulating for age, smoking history, drinking history, blood pressure, and liver function indices.
TyG index was in good agreement with both the hyperinsulinism-euglycemia clamp experiment and homeostatic model assessment for insulin resistance, then can be employed as a monitoring insulin resistance.3,21,22 A recent Korean study showed that increasing TyG index had a higher occurrence risk of sarcopenic obesity. 16 Jung et al. found that TyG index was oppositely related to the weight-adjusted skeletal muscle index. 14 Similar to other studies, our study also reflected a progressive growth in the incidence of skeletal muscle mass reduction with high TyG index. In this study, we applied Spearman’s correlation coefficient to evaluate the linear relationship between TyG index and skeletal muscle mass and found that TyG index was reversely correlated with RSMI: in males R = −0.320 (P < .001); in females: R = −0.240 (P < .001). In the present case, the correlation between TyG index and reduced skeletal muscle index was discussed by binary logistic regression, adjusting for longevity, smoking history, drinking history, blood pressure, and liver function indexes, and the research revealed that compared with the Q1 group, the ORs of skeletal muscle mass reduction in the Q2, Q3, and Q4 groups was 1.161, 1.623, and 2.131 times in males and 1.308, 2.008, and 2.472 times in females, respectively, suggesting that higher levels of the TyG index is related with growing threaten of skeletal muscle mass reduction. Interestingly, we found lower skeletal muscle index was related to lower height in males and females. However, height is regulated by many genes and other factors, such as environment, diet, stress, etc. Therefore, the relationship between height and skeletal muscle mass need more clinical studies, bioinformatics technology, and scientific experiment to explore their depths.
The mechanistic sequential order between insulin resistance and sarcopenia is currently unclear. A recent study showed that the mice with skeletal muscle-specific double knockout of Akt1/2 revealed a progressive reduction in skeletal muscle mass and lifespan, impairment of motor function, systemic insulin sensitivity, and myosin heavy chain 4 (Myh4) mRNA expression. However, additional knockout of FOXO1/4 nearly reversed these adverse phenotypes. 23 Therefore, insulin signaling pathway involved in the alteration of skeletal muscle mass and function, and insulin resistance can influence skeletal muscle protein homeostasis and mitochondrial function. Skeletal muscle makes up 40% to 50% of lean mass in adults thus it plays a major role in postprandial insulin-stimulated glucose processing, when skeletal muscle mass is reduced, the organism experiences insulin resistance. 24 Numerous studies have found a good interlinkage between TyG index and metabolic diseases, diabetes, and chronic liver injury compared to HOMA-IR.10,11,25 Moreover, TyG index, predicting insulin resistance, is convenient to obtain in grass-roots hospitals and has high sensitivity and specificity in assessing insulin resistance, which is negatively correlated with skeletal muscle mass, and is expected to be used as a screening indicator to predict the occurrence of sarcopenia in the future.
This study first proposed the relationship between TyG index and skeletal muscle mass mainly including residents of S city, C country, and displayed that higher TyG index was related to a decrease in skeletal muscle mass after excluding some confounding factors. Besides, we found lower weight-adjusted skeletal muscle index was linked to shorter height. This demonstrates that TyG index may be applied as a mirror for early screening of sarcopenia. Of course, this study also has some disadvantages. First of all, this is cross-sectional research, and a causal link between low insulin sensibility and reduced skeletal muscle mass could not be drawn. Second, the possibility of uncontrolled factors influencing the results of this study cannot be ruled out. Third, this is a research with a small sample size, and the single-center and small sample size may cause bias. Future larger sample sizes are needed for validation and prospective clinical research is crucial to ascertain the causal link between TyG index and sarcopenia.
Conclusion
TyG index was negatively correlated with relative skeletal muscle index, and a higher TyG index was associated with the development of reduced skeletal muscle mass independently of other influencing factors. Therefore, the TyG index promises to be a predictor of skeletal muscle mass loss.
Supplemental Material
sj-docx-1-end-10.1177_11795514241257122 – Supplemental material for A Study of the Relationship Between the Triglyceride-Glucose Index and Skeletal Muscle Mass in a General Chinese Population
Supplemental material, sj-docx-1-end-10.1177_11795514241257122 for A Study of the Relationship Between the Triglyceride-Glucose Index and Skeletal Muscle Mass in a General Chinese Population by Yue Liu, Hongwei Chen, Ziyi Wei, Tingting Han, Ningxin Chen, Yurong Weng and Yaomin Hu in Clinical Medicine Insights: Endocrinology and Diabetes
Footnotes
References
Supplementary Material
Please find the following supplemental material available below.
For Open Access articles published under a Creative Commons License, all supplemental material carries the same license as the article it is associated with.
For non-Open Access articles published, all supplemental material carries a non-exclusive license, and permission requests for re-use of supplemental material or any part of supplemental material shall be sent directly to the copyright owner as specified in the copyright notice associated with the article.