
Abstract
Metabolic dysfunction–associated steatotic liver disease (MASLD) is a multisystem disorder characterized by hepatic lipid accumulation, low-grade inflammation, and metabolic dysregulation. Although the kynurenine pathway has been implicated in the pathogenesis of metabolic and inflammatory diseases, its contribution to MASLD remains unclear. This study aimed to evaluate tryptophan (TRP) metabolism and its relationship with inflammatory biomarkers and lipid parameters across different grades of steatosis. A total of 88 adults (62 MASLD, 26 healthy controls; aged 20-69 years) were enrolled in this study. Serum concentrations of inflammatory markers (CRP, IL-6, and TNF-α) were determined using immunoassay-based methods, and TRP metabolites (TRP, KYN, KYNA, 3-HK, 3-HAA, QA, PIC) were quantified using validated LC–MS/MS. Steatosis grades (0-3) were assessed via ultrasonography. Statistical analyses included the Mann–Whitney U test, the Kruskal–Wallis test, and the Spearman correlation test. MASLD subjects showed significantly higher BMI, triglycerides, AST, ALT, GGT, CRP, TNF-α, and KYNA levels compared with controls (all P < .05), while HDL-C levels were lower (P = .014). Across steatosis grades, BMI, TG, and CRP increased progressively (P < .001), and IL-6 showed a positive correlation with steatosis severity (r = .280, P < .05). KYNA levels were elevated in early steatosis (Grade 1, P = .008) and inversely correlated with TC and LDL-C (r = −.393 and r = −.384, respectively). The elevation of KYNA may reflect an early compensatory mechanism imitigating hepatic and metabolic stress. Integrating inflammatory and kynurenine pathway biomarkers could improve disease stratification and therapeutic targeting in MASLD.
Introduction
Metabolic dysfunction-associated steatotic liver disease (MASLD), previously termed non-alcoholic fatty liver disease (NAFLD), is defined as steatotic liver disease (SLD) in the presence of one or more cardiometabolic risk factor(s) and the absence of harmful alcohol intake. 1 Cardiometabolic risk factors included overweight or obesity, dysglycaemia (prediabetes or type 2 diabetes mellitus), hypertension, hypertriglyceridaemia, and low high-density lipoprotein cholesterol (HDL-C). As the global prevalence of obesity and type 2 diabetes mellitus (T2D) continues to rise, metabolic dysfunction–associated steatotic liver disease (MASLD) has emerged as a major public health burden. According to global epidemiological data published in 2024, MASLD affects approximately 38% of adults worldwide, while its prevalence among children and adolescents ranges between 7% and 14%.2-4
The pathogenesis of MASLD is now primarily explained by the “multiple-hit” hypothesis, 5 which involves factors such as insulin resistance, hormones secreted by adipose tissue, nutritional factors, gut microbiota, and genetic factors. These initial hits subsequently trigger downstream effects, including oxidative stress, chronic inflammation, and the release of pro-inflammatory cytokines, as well as alterations in the gut microbiota and immune cell activation. 6 These compounding factors lead to the progression of simple hepatic steatosis to Metabolic Dysfunction-Associated Steatohepatitis (MASH), which is characterized by hepatocyte ballooning, inflammation, and/or fibrosis, and may even result in liver cirrhosis. 7
In this inflammatory environment, cytokines such as IL-6, TNF-α, and IFN-γ increase the activity of indoleamine-2,3-dioxygenase (IDO), accelerating the flow of tryptophan (TRP) into the kynurenine (KYN) pathway, particularly in immune and mucosal tissues. This effect is reinforced by Tryptophan 2,3-dioxygenase (TDO) in the liver. 8 Through the IDO and TDO enzymes, TRP is converted to N-formylkynurenine (NFK), which is then hydrolysed to kynurenine (KYN). KYN is a critical branching point in the pathway, progressing down 3 branches: to 3-hydroxykynurenine (3-HK), kynurenic acid (KYNA), and anthranilic acid (AA). 3-HK is transaminated to xanthurenic acid (XA) or hydrolysed to 3-hydroxyanthranilic acid (3-HAA). 3-HAA is then oxidised to quinolinic acid (QA) or cyclised to picolinic acid (PIC), Figure 1. 9

Overview of the tryptophan–kynurenine pathway and targeted metabolites The kynurenine pathway involves the sequential action of indoleamine 2,3-dioxygenase (IDO) and tryptophan 2,3-dioxygenase (TDO), which convert tryptophan to N-formylkynurenine, followed by hydrolysis to kynurenine by arylformamidase (AFMID). Kynurenine represents a central branching point and is further metabolized by kynurenine aminotransferases (KATs) to kynurenic acid, or by kynurenine 3-monooxygenase (KMO) and kynureninase (KYNU) to downstream metabolites including 3-hydroxyanthranilic acid and quinolinic acid via 3-hydroxyanthranilate 3,4-dioxygenase (3-HAO).
Under normal conditions, the TDO enzyme has a much stronger capacity to catalyse TRP compared to the IDO enzyme. In contrast, it is significantly induced by cytokines during pathophysiological immune activation, such as in bacterial and viral infections, as well as in clinical scenarios like autoimmune liver diseases, liver tumours, and liver transplantation. 10
TRP metabolites are composed of different and sometimes opposing compounds. These metabolites can have cytotoxic/cytoprotective, oxidant/antioxidant, or pro-/anti-inflammatory effects. For example, KYNA has a protective effect, while QUIN and 3-HK have toxic effects. Therefore, a clear understanding of the biological effects of the kynurenine pathway requires examining the concentrations of its metabolites, the activities of the enzymes along the pathway, and the complex feedback loops. 11
The liver plays an integral role in the metabolism of TRP. The changes in TRP metabolism may contribute to the pathogenesis of MASLD. It is also recognised that inflammatory signalling mechanisms differ in MASLD. Therefore, TRP metabolism may have clinically relevant implications across steatosis grades. The association between inflammatory cytokines and TRP metabolism across steatosis grades in MASLD remains insufficiently studied. Accordingly, we aimed to study the associations between TRP metabolites (TRP, KYN, KYNA, 3-HK, 3-HAA, QUIN, PIC) and inflammatory biomarkers (CRP, IL-6, TNF-α) in individuals with MASLD and healthy controls. We also compared these markers across steatosis grades (0-3) to assess their potential association with steatosis severity, and evaluated the intercorrelations among these markers within MASLD.
Materials and Methods
Participants and Study Design
Current study conducted between November 2023 and May 2025 at the Gazi University Faculty of Medicine Hospital (Ankara, Turkey). The study protocol adhered to the ethical principles outlined in the Declaration of Helsinki. Ethical approval was obtained from the Gazi University Clinical Research Ethics Board (Decision No. 796, dated October 30, 2025). Written informed consent was obtained from all participants prior to enrolment in the study.
Volunteers aged 20 to 69 years who presented consecutively to the Endocrinology and Metabolic Diseases outpatient clinic of Gazi University Hospital were enrolled in this cross-sectional observational study. Participants underwent detailed clinical evaluation, laboratory testing, and hepatic ultrasonography. Individuals with ultrasonographic evidence of hepatic steatosis grade ⩾1 and at least one cardiometabolic risk factor were classified as having MASLD. Cardio-metabolic risk factors included overweight or obesity, dysglycaemia (prediabetes or type 2 diabetes mellitus), hypertension, hypertriglyceridaemia, and low high-density lipoprotein cholesterol (HDL-C). Participants with significant alcohol consumption were excluded. Subjects with no evidence of hepatic steatosis (grade 0) served as the control group.
Participants were further classified according to ultrasonographic hepatic steatosis grade into 4 predefined groups: Grade 0 (controls without hepatic steatosis), Grade 1 (mild steatosis), Grade 2 (moderate steatosis), and Grade 3 (severe steatosis). Dysglycaemic status (prediabetes or newly diagnosed T2DM) was assessed as a metabolic characteristic within each steatosis grade rather than as a primary grouping variable.
To minimize confounding effects on inflammatory markers and tryptophan–kynurenine pathway metabolism, only newly diagnosed, treatment-naïve individuals were included. Accordingly, exclusion criteria comprised: (i) age younger than 18 years or older than 80 years; (ii) severe intellectual disability or psychiatric disorders that could impair informed consent or study compliance; (iii) presence of an active malignancy; (iv) alcohol consumption exceeding thresholds incompatible with the definition of MASLD (⩾30 g/day for men and ⩾20 g/day for women); (v) acute infection or chronic active infectious diseases, including hepatitis B virus (HBV), hepatitis C virus (HCV), or human immunodeficiency virus (HIV); (vi) elevated C-reactive protein (CRP) levels exceeding the upper reference limit, suggestive of overt inflammatory conditions; and (vii) current or prior use of antidiabetic, anti-inflammatory, or immunomodulatory pharmacological treatments, to avoid potential interference with metabolic, inflammatory, and kynurenine pathway–related biomarkers.
Participants in this study were consecutively recruited from the same clinical setting, with identical inclusion and exclusion criteria to minimize selection bias. Given that there was no prior study examining metabolomics profiles of participants with MASLD using the assay employed in the proposed study, we estimated the sample size required for a case–control study based on an earlier study by Arto et al 12 that examined serum tryptophan pathway metabolites in participants with MASLD. Using G Power (version 3.1.9.4, Universität Düsseldorf, Germany) 13 with an alpha level of .05, a power of .80, and a large effect size according to Cohen’s convention of .6, 14 the minimum sample size required to test the null hypothesis was 80 participants. Adding 10% to allow for non-response and missing data gave a target sample size of 88 participants. Eighty-eight adults comprising 62 participants with MASLD and 26 healthy controls were thus included in this study.
Ultrasonography Examination
Hepatic steatosis grades, as determined by abdominal ultrasonography performed in the Department of Radiology, were entered into the study database. All participants underwent hepatic ultrasonography using an RS85 Prestige ultrasound system (Samsung Medison Co., Ltd., Seoul, South Korea) with a 1 to 7 MHz convex probe. Examinations were conducted in the supine position following at least 6 hours of fasting, and hepatic fat content was measured qualitatively via a right intercostal approach. On B-mode ultrasonography, hepatic steatosis was visually graded on a 0 to 3 scale (0 = none, 1 = mild, 2 = moderate, 3 = severe). Grade 0 was assigned when hepatic echotexture was normal. Grade 1 required a subtle, diffuse increase in hepatic echogenicity without loss of conspicuity of intrahepatic vessels or the diaphragm. Grade 2 indicated increased echogenicity with partial blurring/attenuation of vascular structures and/or the diaphragm. Grade 3 was defined by marked echogenicity with poor or absent visualisation of intrahepatic vessels and the diaphragm. All measurements and grades were recorded in the study database.
Laboratory Measurements and Inflammatory Markers
Venous blood samples were collected from MASLD patients and the control group in the morning, following an overnight fasting period of at least 8 hours. The samples were then centrifuged for 10 minutes at 3400 rpm to obtain serum for biochemical analysis. Haemolytic or icteric samples were excluded to maintain data integrity. All biochemical parameters, inflammatory markers, and tryptophan–kynurenine pathway metabolites were measured in serum samples.
Serum levels of TG (mg/dL), TC (mg/dL), LDL-C (mg/dL), HDL-C (mg/dL), AST (U/L), ALT (U/L), and GGT (U/L) were measured in stored serum using standard methods by the Gazi University Faculty of Medicine Hospital Central Medical Biochemistry Laboratory. All biochemical parameters were analyzed photometrically using commercial kits (Siemens Healthineers®, Germany) on the Siemens Advia Chemistry XPT automated analyzer.
Serum interleukin-6 (IL-6, pg/mL) concentrations were measured by electrochemiluminescence immunoassay (ECLIA) on a Cobas 6000 system (Elecsys, Roche Diagnostics, Rotkreuz, Switzerland). C-reactive protein (CRP, mg/L) levels were quantified nephelometrically using an IMMAGE 800 analyzer (Beckman Coulter Inc., Brea, CA, USA). Tumour necrosis factor-α (TNF-α, pg/mL) concentrations were determined using a commercial ELISA kit (Diasource ImmunoAssays, Cat. No.: KAP1751, Louvain-la-Neuve, Belgium) according to the manufacturer’s instructions. The limits of quantification for serum TNF-α, IL-6, and CRP were determined as 0.7, 1.5, and 0.8 mg/dL, respectively. The reference ranges for serum TNF-α, IL-6, and CRP were 7 to 518 pg/mL, <7 pg/mL, and 0 to 5 mg/dL, respectively, as provided by the assay manufacturers.
TRP Metabolites
The serum levels of TRP (µM), KYN (µM), KYNA (µM), 3-HK (µM), 3-HAA (µM), QA (µM), and PIC (µM) were quantified using the validated Jasem Serum Tryptophan and its Kynurenine Pathway Metabolites LC–MS/MS Analysis Kit, according to the manufacturer’s instructions (Sem Laboratuar Cihazları Pazarlama San. ve Tic. Inc., Istanbul, Turkey). The LC–MS/MS platform used for chromatographic and mass spectral analysis of these TRP metabolites consisted of an Agilent 6465 B triple quadrupole mass spectrometer (Agilent Technologies, Santa Clara, CA, USA).
Calibrator working solutions were prepared according to the manufacturer’s instructions. For each level, 100 µL of calibrator was placed in an HPLC vial, mixed with 50 µL of internal standard and 400 µL of Reagent-1, and then injected into the LC–MS/MS. Sample preparation involved transferring 100 µL of serum or control sample into an Eppendorf tube, followed by the addition of 50 µL stable isotope-labelled internal standard (IS) and 400 µL Reagent-1 for protein precipitation. Centrifuge at 4500 rpm for 5 minutes After mixing and centrifugation, the supernatant was transferred to an HPLC vial and injected into the LC–MS/MS system. Calibrators were prepared in the same manner. Mass spectrometry detection was conducted in positive electrospray ionization (ESI) mode, using multiple reaction monitoring (MRM) for all target metabolites and their respective IS. Specific precursor → product ion transitions were applied, with optimized collision energies for each metabolite. Metabolite concentrations were calculated based on the peak area ratio relative to the IS. Data acquisition and analysis were performed using Agilent MassHunter Data Acquisition, Quantitative Analysis, and Qualitative Analysis software (Agilent Technologies, Santa Clara, CA, USA). The limit of quantitation concentrations of TRP, KYN, KYNA, 3-HK, 3-HAA, QA, and PIC were .019, .013, .010, .007, .003, .013, and 0.014 µM, respectively.
Statistical Analysis
All statistical analyses were performed using SPSS Statistics version 25.0 (IBM Corp., Chicago, IL, USA). Descriptive statistics were presented as frequencies (n, %) for categorical variables and as medians with interquartile ranges (IQR) for continuous variables, depending on the data distribution. Normality of numerical variables was assessed using the Kolmogorov–Smirnov and Shapiro–Wilk tests. For comparisons between 2 independent groups, nonparametric numerical variables were compared using the Mann–Whitney U test. Nonparametric data across more than 2 groups were evaluated using the Kruskal–Wallis test, and significant results were further analyzed with Mann–Whitney U tests applying the Bonferroni correction for multiple comparisons. Correlations between continuous variables were evaluated using Spearman correlation coefficients. A P-value < .05 was considered statistically significant for all analyses, and all results were reported with a 95% confidence interval. Graphical representations of the data were generated using GraphPad Prism (GraphPad Software, San Diego, CA, USA).
Results
Demographic and laboratory characteristics of the control (n = 26) and MASLD (n = 62) groups are presented in Table 1. The median (IQR) age was 40 (32-46) years, and 73.1% were females in the controls, 50 (41-55) years, and 56.5% were females in the MASLD group. Both groups were similar in terms of age and sex (P > .05). The percentile of BMI (kg/m2) was 24.15 (21.55-27.22) in controls and 29.20 (26.77-32.32) in MASLD, and was significantly higher in MASLD compared to healthy controls (P < .001). The levels of TG (mg/dL), ALT (U/L), GGT (U/L), CRP (mg/L), TNF-α (pg/mL), and KYNA (μM) were statistically significantly higher in the MASLD group compared to healthy controls (P < .001, P = .003, .001, .006, .012, .008, respectively). In contrast, HDL-C levels (mg/dL) were significantly higher in the control group than in the MASLD group (P = .014). No statistically significant differences were found between the MASLD and control groups in terms of TC (mg/dL), LDL-C (mg/dL), AST (U/L), IL-6 (pg/mL), TRP (μM), KYN (μM), 3-HK (μM), 3-HAA (μM), QUIN (μM), and PIC (μM) levels (P > .05). Comparison of CRP, TNF-α and KYNA levels between the control and MASLD groups is also shown in Figure 2.
Demographic and Laboratory Characteristics of the Control and MASLD Groups.

Median (IQR). The Mann–Whitney U test was employed for post hoc analysis.
P < .05. **P < .01. ***P < .001.

Comparison of CRP (mg/L), TNF-α (ng/L), and KYNA (µM) levels between MASLD and control groups.
Four grades were made according to hepatic steatosis, and laboratory findings were compared across 4 groups (Grade 0, Grade 1, Grade 2, and Grade 3). Table 2 presents biochemical parameters, inflammatory markers, and TRP metabolites according to the grades of hepatic steatosis. In the intergroup comparison, BMI (kg/m2) and TG (mg/dL) levels were significantly elevated in the Grade 1, 2, and 3 groups compared to the Grade 0 group (P < .001). TC (mg/dL) and LDL-C (mg/dL) levels were found to be statistically significantly higher in the Grade 3 group compared to Grade 0 (P = .003, P = .025, respectively). HDL-C (mg/dL) and IL-6 (pg/mL) levels were found to be significantly higher only in the Grade 2 group compared to the Grade 0 group (P = .002, P = .027, respectively). CRP (mg/L) levels were significantly higher in the Grade 1, 2, and 3 steatosis grades compared to the Grade 0 group (P = .02, P = .04, P = .02, respectively). The levels of TNF-α (pg/mL) and the KYNA (µM) were significantly elevated only in the Grade 1 group when compared to Grade 0 (P = .014, P = .008, respectively). Comparison of BMI, TG, CRP, IL-6, TNF-α, and KYNA levels among grades of hepatic steatosis is visually summarized in Figure 3.
Comparison of BMI (kg/m2), Biochemical Parameters, and Kynurenine Pathway Metabolites According to the Degree of Hepatosteatosis.
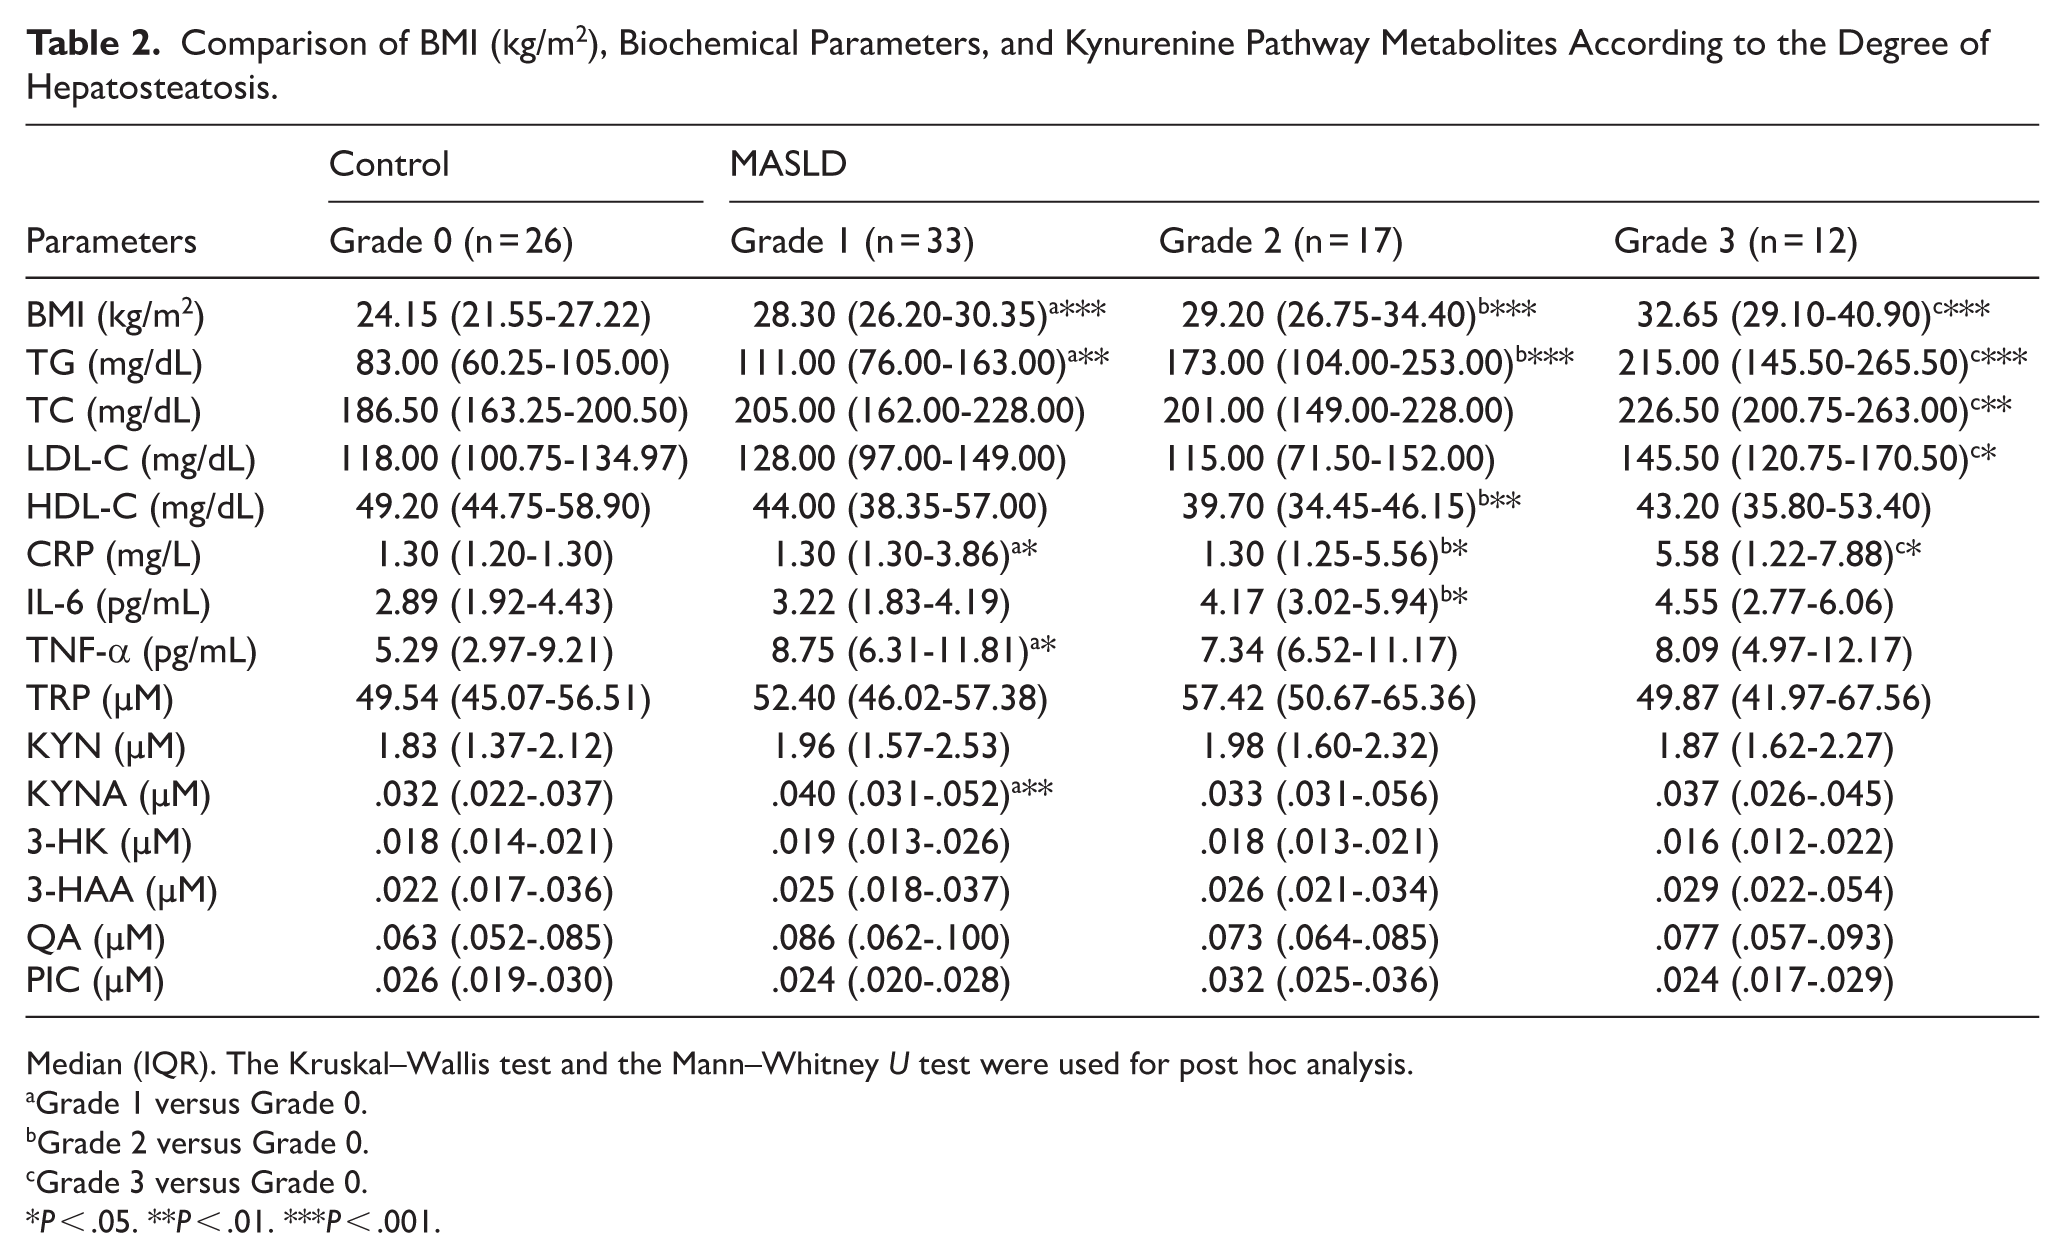
Median (IQR). The Kruskal–Wallis test and the Mann–Whitney U test were used for post hoc analysis.
Grade 1 versus Grade 0.
Grade 2 versus Grade 0.
Grade 3 versus Grade 0.
P < .05. **P < .01. ***P < .001.
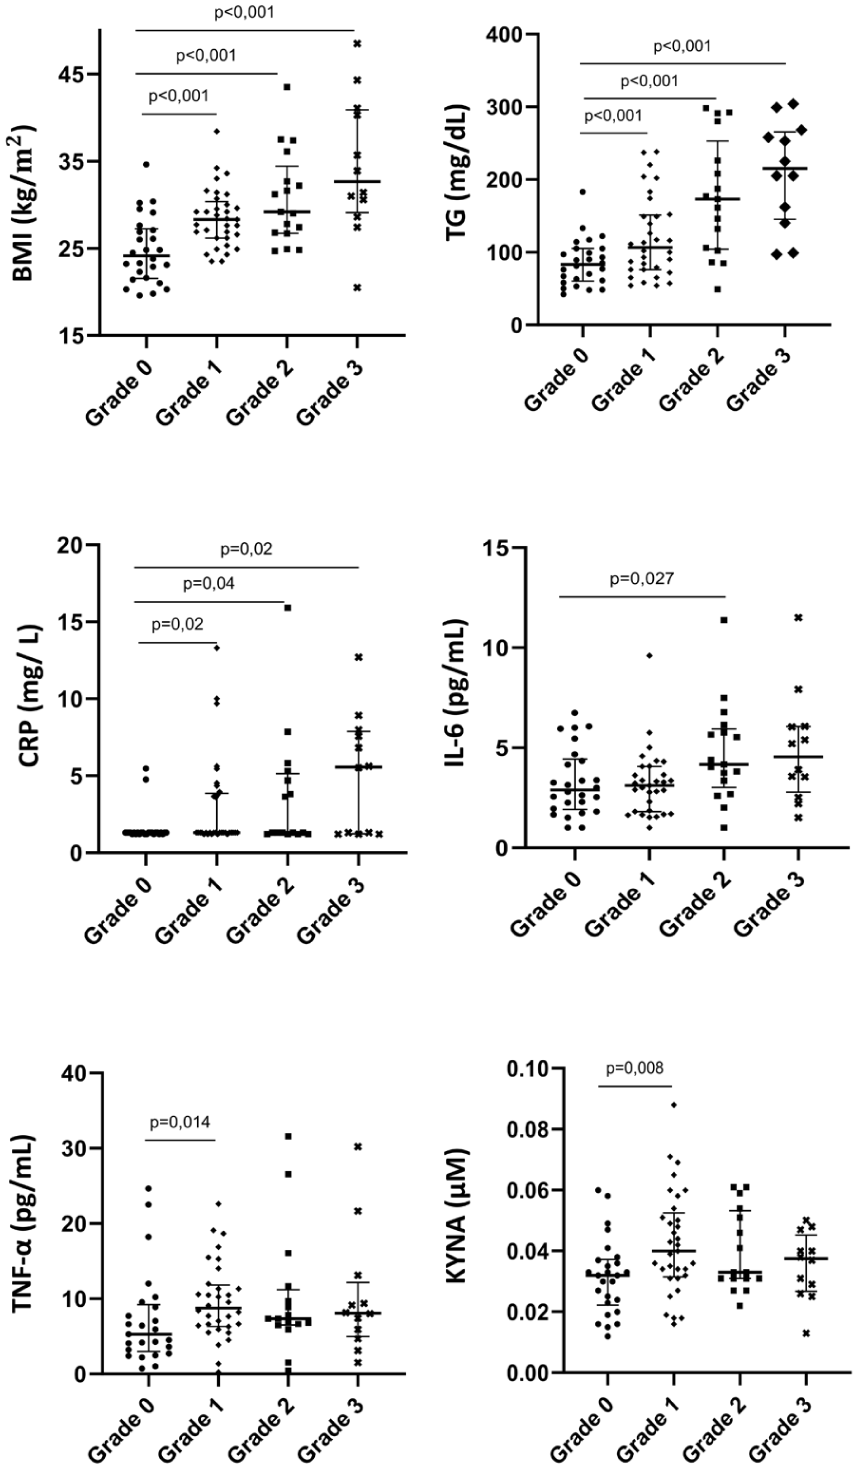
Comparison of BMI, triglycerides, CRP, IL-6, TNF-α, and KYNA levels among grades of hepatic steatosis.
The correlation analysis of BMI, biochemical parameters and inflammatory markers with steatosis grade and TRP metabolites in the MASLD group is presented in Table 3. The analysis revealed a moderately positive correlation between the steatosis grade with BMI (kg/m2), TG (mg/dL), and IL-6 (pg/mL; r = .346, P = .006; r = .442, P < .001; r = .280, P = .027, respectively). A moderate positive correlation was observed between KYN (μM) levels with BMI (kg/m2; r = .273; P = .032). In contrast, KYN (μM) and KYNA (μM) showed a moderate negative correlation with both TC (mg/dL; r = −.289, P = .023; r = −.393, P = .002, respectively) and LDL-C (mg/dL; r = −.343, P = .006; r = −.384, P = .002, respectively). Finally, a moderate positive correlation was found between 3-HK (μM) levels and CRP (mg/L; r = .274; P = .031).
Correlation Analysis Between Kynurenine Pathway Metabolites and BMI and Biochemical Parameters in the MASLD Group.
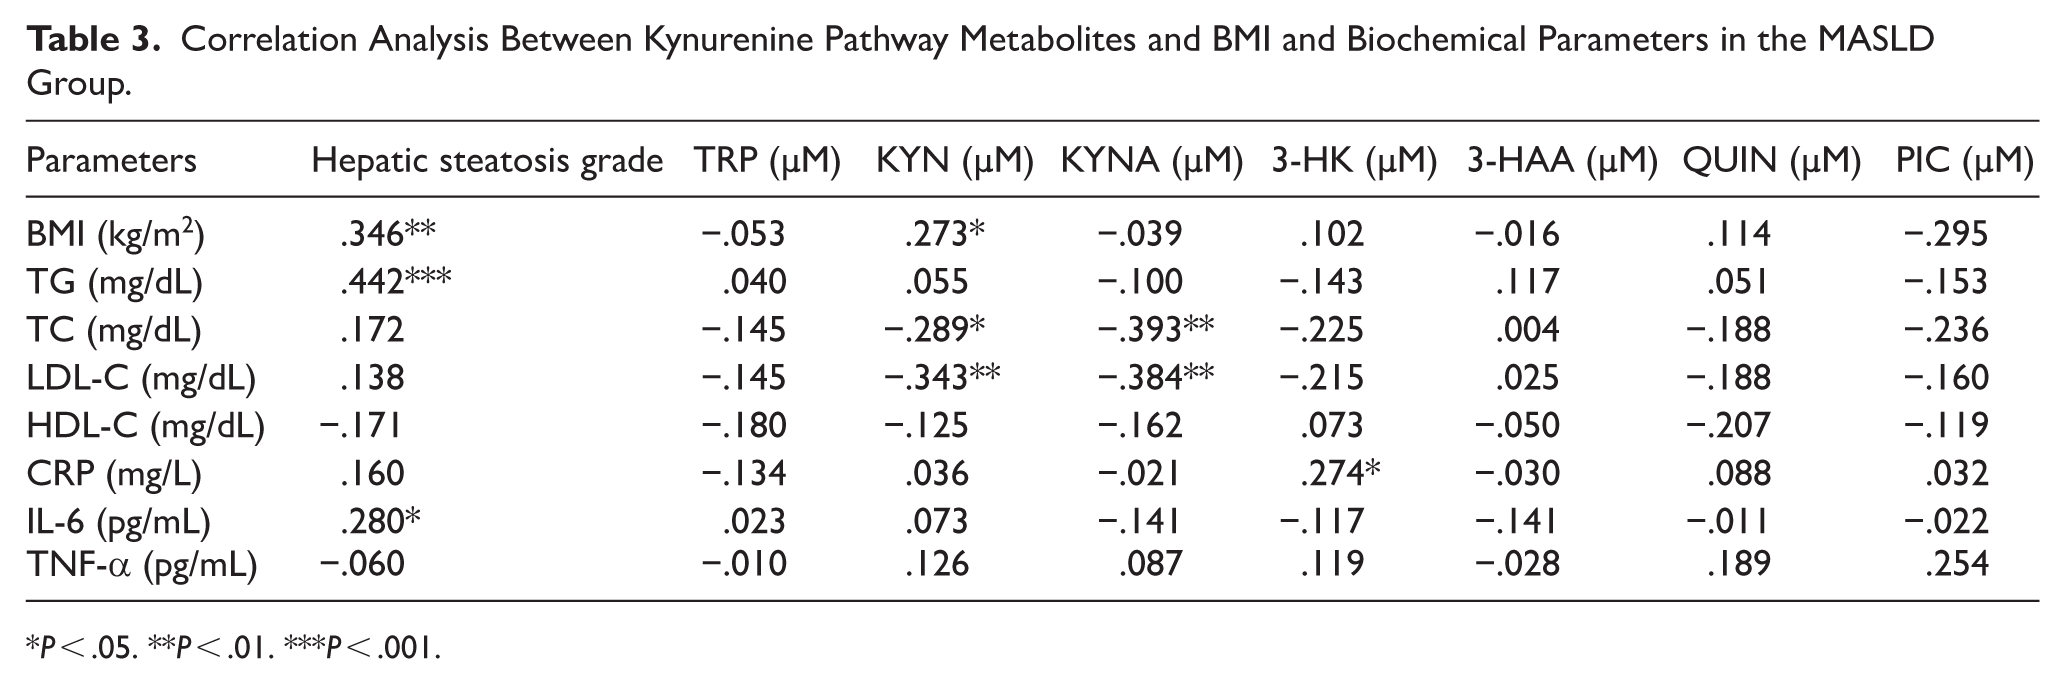
P < .05. **P < .01. ***P < .001.
Discussion
This study systematically evaluated the interplay between inflammatory biomarkers (CRP, IL-6, TNF−α) and tryptophan metabolites (TRP, KYN, KYNA, 3-HK, 3-HAA, QA, PIC) in individuals with MASLD and matched healthy controls. These markers were also compared across steatosis grades (0-3) to assess their potential association with the severity of steatosis. Our findings provide crucial insight into the biochemical alterations associated with MASLD, highlighting the complex relationship between these metabolic and immune pathways. To our knowledge, this study presents the first data on TRP metabolism in relation to inflammatory markers in patients with MASLD and varying grades of steatosis. The findings collectively demonstrate that MASLD has a holistic pathophysiology driven by cardio-metabolic load, low-grade systemic inflammation, and modulated TRP metabolites. Moreover, the gradual changes observed in BMI, TG and inflammatory markers as the degree of steatosis grades increases confirm a clear dose-response pattern between MASLD severity and the associated metabolic and inflammatory responses.
Experimental models of liver injury and advanced fibrotic disease commonly demonstrate a shift in tryptophan metabolism toward increased generation of downstream cytotoxic metabolites, including quinolinic acid, often accompanied by a relative reduction in kynurenic acid. In contrast, our cohort consisted predominantly of individuals with early-stage MASLD diagnosed by ultrasonography, with no clinical evidence of advanced fibrosis.15,16 Therefore, the selective elevation of KYNA observed in this study may reflect an early-stage metabolic response rather than the pronounced diversion toward neurotoxic and pro-fibrogenic metabolites described in advanced or experimental disease models. This stage-dependent divergence in tryptophan metabolism may partly account for the discrepancies between our findings and previous experimental reports.
The pathogenesis of Metabolically Dysfunctional-Associated Steatotic Liver Disease (MASLD) is strongly linked to metabolic health, with multiple studies consistently reporting that obesity is an independent risk factor, increasing the risk of MASLD by approximately 3.5-fold. 17 11 In a cohort of 4100 non-obese participants in Japan who identified 894 new cases of MASLD during a 6.44-year follow-up, the annual rate of increase in BMI was reported to be the variable most strongly associated with new-onset MASLD. 18 Furthermore, studies by Choi et al 19 and Abangah et al 20 have shown that BMI and TG have statistically significant associations with USG grade. In our study, BMI and TG levels were significantly higher in the MASLD group than in the control group. This finding may be due to the fact that BMI and TG levels are among the cardiometabolic risk factors for MASLD. However, the fact that both BMI and TG levels increase with increasing degree of hepatosteatosis, and our finding of a positive, moderate to strong correlation between the degree of hepatosteatosis, BMI, and TG levels, suggests that these parameters may be related to disease severity.
A population-based study involving 20 141 Korean adults found that individuals with MASLD (n = 10 346) and other subtypes of steatotic liver disease had significantly higher hs-CRP levels compared to the controls. 21 Similarly, a comprehensive meta-analysis that reevaluated data from 51 studies involving more than 36 000 patients demonstrated significant associations between CRP, IL-1β, IL-6, TNF-α, and ICAM-1 levels and NAFLD. 22 This large-scale meta-analytic evidence finding aligns with our results. In terms of inflammatory markers, the significantly higher CRP and TNF-α levels observed in the MASLD group compared to the controls support the presence of low-grade systemic inflammation, a characteristic of MASLD.
As the steatosis grade increased, serum CRP levels exhibited a stepwise elevation and remained significantly higher across all grades compared with Grade 0. TNF-α and IL-6 exhibited similar upward trends; TNF-α levels were significantly higher in the Grade 1 group compared to the Grade 0 group, while IL-6 levels were significantly higher in the Grade 2 group compared to the Grade 0 group. Consistently, a weak positive correlation was found between the severity of hepatosteatosis and IL-6 (r = .280). These findings provide compelling evidence that low-grade, chronic inflammation intensifies in parallel with the grade of steatosis. In line with our results, Foroughi et al 23 reported that, although unadjusted CRP levels did not differ significantly across steatosis grades (P > .05), after adjustment for age, sex, and BMI, CRP was independently associated with ultrasonographic steatosis severity. In addition, Lebensztejn et al 24 reported that serum TNF-α concentrations were positively correlated with ultrasonographic steatosis grades in obese children; however, the difference between steatosis grades was not significant. In that study, TNF-α effectively discriminated between subjects with steatosis and those without, but not between the severity of steatosis.
While the relationship between inflammatory markers and MASLD is becoming increasingly important, 25 tryptophan metabolism has also been implicated in the pathogenesis of liver diseases. 15 The most striking finding of our study is that serum KYNA levels were found to be significantly higher in the MASLD group compared to the control group (P = .008). It should be emphasized that circulating tryptophan metabolites do not exclusively reflect hepatic metabolism, but rather represent the integrated contribution of multiple tissues, including the liver, immune cells, gastrointestinal tract, adipose tissue, and vascular endothelium, all of which may influence serum concentrations under metabolic and inflammatory conditions. 26
Consistent with our findings, recent metabolomics studies in patients with obesity, NAFLD, and MASLD have demonstrated marked alterations in tryptophan metabolism. Arto et al 12 demonstrated in a 76-participant cohort that KYNA levels were higher in morbidly obese (MO) individuals compared to normal-weight (NW) controls (P = .004). However, within the MO group’s histological subcategories, there was no difference in KYNA between normal liver (NL) and MASLD (P = .85). These findings suggest that while KYNA increases in the presence of obesity, it does not further discriminate steatosis/steatohepatitis severity among morbidly obese individuals. These findings strengthen the hypothesis that tryptophan metabolism is dynamically reprogrammed in MASLD, linking metabolic overload and inflammation through the kynurenine axis, in alignment with the compensatory elevation of KYNA observed in our cohort. 12
Zhan et al
27
aimed to evaluate TRP metabolites in their study in a pediatric cohort with obesity-related MASLD. MASLD showed no significant differences in KYN and KYNA, whereas QA levels were significantly higher
Pyun et al 28 measured serum KYNA levels in healthy and obese individuals. Obese individuals had lower serum KYNA levels compared to healthy individuals. In correlation analysis, serum KYNA levels were found to be negatively correlated with BMI. These clinical findings suggest that circulating KYNA may be involved in energy metabolism. To further explore its role in NAFLD, in vitro experiments were conducted using human primary hepatocytes. It was observed that KYNA treatment resulted in a reduction of palmitate-induced lipid accumulation and a downregulation of lipogenic gene expression in hepatocytes. The hepatoprotective mechanism is thought to involve KYNA acting as an agonist for the G-protein-coupled receptor 35 (Gpr35), thereby exerting anti-inflammatory and metabolic regulatory effects. These results suggest that high KYNA levels are beneficial in the pathogenesis of MASLD, as they reduce lipogenic gene expression and lipid accumulation.
Consistent with this potential protective role, moderate negative correlations were observed between KYN and KYNA and serum lipid parameters in our study. Specifically, KYN and KYNA were inversely correlated with TC (r = −.289, r = −.393, respectively) and LDL-C (r = −.343, r = −.384, respectively). In our study, serum KYNA levels were significantly elevated in the MASLD group, consistent with literature reports indicating the anti-inflammatory and hepatoprotective effects of KYNA, including the suppression of lipogenic gene expression and lipid accumulation. The inverse association with total cholesterol and LDL-C further supports the hypothesis that the elevation of circulating KYNA represents a beneficial, compensatory metabolic response aimed at mitigating dyslipidemia and lipotoxicity. As previously mentioned, this hepatoprotective effect is likely mediated through GPR35 activation, leading to attenuation of inflammatory signaling, activation of AMPK-dependent pathways, and suppression of hepatic lipogenesis. In addition, KYNA exerts antioxidant effects and functions as an endogenous antagonist of NMDA receptors, thereby contributing to protection against metabolic and inflammatory stress at both hepatic and systemic levels.
More recently, breakthroughs in the study of the gut microbiota have further supported these findings from the perspective of the gut–liver axis high-resolution metagenomic approaches, particularly shotgun sequencing, enable functional profiling of microbial pathways involved in tryptophan metabolism, including indole, kynurenine, and serotonin routes. 29 Several microbiota-derived tryptophan metabolites, especially indole derivatives, act as ligands for the aryl hydrocarbon receptor (AHR) and, by reinforcing intestinal barrier integrity and modulating mucosal immune responses, may influence hepatic inflammation. 26
Integrative multi-omics strategies combining gut metagenomics, serum metabolomics, and inflammatory profiling represent a powerful, non-invasive approach for early phenotyping of metabolic liver diseases. 15 In this context, the compensatory up-regulation of kynurenic acid observed in early-stage MASLD may reflect an adaptive host response aimed at suppressing excessive immune activation and excitotoxic stress, preceding the accumulation of more cytotoxic metabolites in advanced disease stages. 16
The limitations of this study are its single-center, cross-sectional nature, which makes it impossible to establish causation. The sample size is in itself relatively small. The MASLD diagnosis in the present study relied solely on the ultrasonographic evaluation of hepatic steatosis; no sophisticated imaging tools like magnetic resonance imaging-proton density fat fraction or histologic confirmation using liver biopsy are needed in the MASLD patients. Hence, mild alterations in the extent of hepatocellular fat or the severity of fibrosis may have remained undetected. Furthermore, there was no evaluation of tryptophan intake, and this might affect the levels of tryptophan and kynurenine pathway metabolites in the serum. However, all samples were obtained after overnight fasting, and no participants were on special diets or supplementation. Serum levels of tryptophan metabolites are known to represent the net contribution of various tissues such as the liver, immune cells, gastrointestinal tissues, and other tissues. Nevertheless, ultrasonography remains a widely accepted first-line diagnostic tool for population-based MASLD studies and reflects real-world clinical practice, particularly in early disease stages. Large, multi-center, prospective trials that utilize detailed dietary analysis, state-of-the-art imaging, and, where possible, histological validation are needed to confirm and expand upon these results. Future intervention trials, such as weight loss trials, triglyceride-lowering therapy, anti-inflammatory diets, or kynurenine metabolic pathway manipulation (eg, GPR35 agonist therapies or tryptophan-based therapies), will need to explore whether beneficial metabolic changes in the kynurenine metabolic pathways are coupled with changes in hepatic steatosis and inflammation.
Conclusions
In conclusion, this study provides comprehensive evidence that a multidimensional interaction between adiposity, dyslipidaemia, low-grade systemic inflammation, and kynurenine pathway modulation characterises MASLD. The progressive increases in BMI, triglycerides, and inflammatory markers with advancing steatosis grades confirm a dose–response relationship between disease severity and metabolic-inflammatory burden. The elevation of KYNA and its inverse association with lipid parameters suggest an early compensatory adaptation within the kynurenine pathway, potentially reflecting protective metabolic reprogramming. These findings highlight the importance of integrated metabolic and inflammatory monitoring in MASLD management and underscore the kynurenine pathway as a promising mechanistic and therapeutic target in metabolic liver disease.
Footnotes
Acknowledgements
We sincerely thank the patients for their invaluable participation and contributions to this study. We also acknowledge the assistance of the artificial intelligence–based language tool Grammarly (Grammarly Inc., San Francisco, USA) for improving the clarity and grammar of this article.
ORCID iDs
Ethical Considerations
The study protocol adhered to the ethical principles outlined in the Declaration of Helsinki. Ethical approval was obtained from the Gazi University Clinical Research Ethics Board (Decision No. 796, dated October 30, 2025). All procedures performed in studies involving human participants were in accordance with the ethical standards of the institutional research committee and the 1964 Declaration of Helsinki and its subsequent amendments.
Consent to Participate
Written informed consent was obtained from all participants prior to enrolment in the study, after the purpose and design of the research were explained in detail.
Funding
The authors disclosed receipt of the following financial support for the research, authorship, and/or publication of this article: This project was supported by the Gazi University Scientific Research Projects Unit (BAP) under the project code TTU-2025-9024.
Declaration of Conflicting Interests
The authors declared no potential conflicts of interest with respect to the research, authorship, and/or publication of this article.
Data Availability Statement
The datasets generated and/or analyzed during the current study are available from the corresponding author upon reasonable request.*