
Abstract
Monocyte chemotactic protein-1 (MCP-1), a small inducible cytokine, is involved in obesity-related chronic disorders. Adipocytes produce MCP-1 that is elevated in obese humans and in rodent models of obesity. This study examined the hepatic metabolomic alterations caused by adipose-specific MCP-1 deficiency in a rodent model of obesity. Wide-type (WT) and adipose-specific Mcp-1 knockdown mice (Mcp-1-/-) were each assigned randomly to 2 groups and fed the standard AIN93G diet or a high-fat diet (HFD) for 12 weeks. Compared to the AIN93G diet, the HFD increased body weight, body fat mass, and plasma concentrations of insulin and leptin, regardless of genotype. There were no differences in these variables between WT and Mcp-1-/- mice when they were fed the same diet. Eighty-seven of 172 identified metabolites met the criteria for metabolomic comparisons among the 4 groups. Thirty-nine metabolites differed significantly between the 2 dietary treatments and 15 differed when Mcp-1-/- mice were compared to WT mice. The metabolites that significantly differed in both comparisons included those involved in amino acid, energy, lipid, nucleotide, and vitamin metabolism. Network analysis found that both HFD and adipose Mcp-1 knockdown may considerably impact amino acid metabolism as evidenced by alteration in the aminoacyl-tRNA biosynthesis pathways, in addition to alteration in the phenylalanine, tyrosine, and tryptophan biosynthesis pathway in Mcp-1-/- mice. However, decreased signals of amino acid metabolites in mice fed the HFD and increased signals of amino acid metabolites in Mcp-1-/- mice indicate that HFD may have down-regulated and adipose Mcp-1 knockdown may have up-regulated amino acid metabolism.
Introduction
Over 40% of the adult population is obese and 30% is overweight in the U.S. 1 The prevalence of obesity and overweight drastically increases the risk of type-2 diabetes, stroke, heart diseases, and certain types of cancer (e.g. breast cancer and prostate cancer).2-5 The economic impact of obesity on the U.S. health care system is significant. Direct medical costs related to obesity diagnosis, prevention, and treatments were estimated to be $173 billion in 2019. 6 Indirect costs, including absence from work for obesity-related sickness and death and loss of productivity, were estimated to range from 3 to 6 billion in 2008.7,8
Obesity is a metabolic disorder. The imbalance between energy intake and energy expenditure culminates in excess accumulation of adipose tissue as body fat mass. Adipose tissue is not inert but is a metabolically active organ that produces proinflammatory cytokines. A mechanism that links obesity to the risk of chronic diseases patho-physiologically is chronic inflammation, that is largely mediated by proinflammatory cytokines derived from adipose tissue.
Monocyte chemotactic protein-1 (MCP-1), a small inducible molecule in the CC chemokine family, is an adipose-derived cytokine.9,10 MCP-1 was initially identified for its potent role in recruiting monocytes and other immune-defense cells to the sites of inflammation in tissue injury or infection.11,12 However, it is a cytokine that plays multiple roles in pathogenesis of metabolic disorders and chronic diseases. 13
It has been shown that concentrations of MCP-1 are elevated in white adipose tissue of subjects with obesity14,15 and that expression of MCP-1 in adipose tissue is correlated positively with body mass index in humans. 16 Elevated MCP-1 in obesity is related to metabolic disturbance (e.g. increased insulin resistance and hyperglycemia) in both humans9,17,18 and rodent models of obesity.19-21 Furthermore, laboratory studies have found that engineered expression of MCP-1 transgene in adipose tissue results in insulin resistance 22 and that decreased plasma concentrations of insulin, resistin, and leptin occur in adipose MCP-1 deficient mice in studies of high-fat diet-enhanced mammary tumorigenesis 23 and spontaneous metastasis. 24 Findings from these studies indicate that adipose-derived MCP-1 may directly affect several metabolic pathways.
It is generally accepted that healthy dietary practice and increased physical activity can prevent obesity.25,26 However, clinical interventions to remove or prevent in adults, especially the long-term, are often unsuccessful,27,28 because behavior changes to a healthier lifestyle is a great challenge for this population. Thus, identifying pathways that drive pathologic processes of obesity might identify new agents or approaches for obesity prevention and treatment. The purpose of this study was to determine whether an effect of adipose-derived MCP-1 on metabolism would provide insight in identifying these pathways. To do this, in this study with wild-type and adipose Mcp-1 knockdown mice fed the standard AIN93G diet or a high-fat diet, we performed untargeted metabolomic analysis of primary metabolism on liver samples collected.
Materials and Methods
Animals and diets
The in-house breeding colony, established with breeders procured from the Jackson Laboratory (Bar Harbor, ME, USA), supplied mice for this study. Female Mcp-1fl/fl mice bearing 2 floxed Mcp-1 alleles (flanked loxP sites on both alleles of exons 2-3 of Mcp-1 gene on chromosome 11) were mated with male Mcp-1fl/fl/Adipoq-Cre+ mice bearing Mcp-1fl/fl and positive for Cre expression (Adipoq-Cre+; adiponectin promoter driven Cre recominase). Both females and males were of the C57BL/6 background. Offspring expressing (Mcp-1fl/fl/Adipoq-Cre+) were designated as adipose specific Mcp-1 knockdown (Mcp-1-/-) mice. Littermates negative for Cre expression (Mcp-1fl/fl/Adipoq-Cre-) were designated as wild-type (WT) controls. Mice were housed in a temperature-controlled room (22 ± 1°C) with a 12:12-hour light/dark cycle and weighed weekly. Two diets were compared in this study, the standard AIN93G diet 29 and a high-fat diet (HFD, the AIN93G diet modified to increase energy to 45% by increasing dietary fat content; Table 1). Both diets were powder diets and were stored at −20°C. Mice received fresh diet and deionized drinking water every other day and were fed ad libitum.
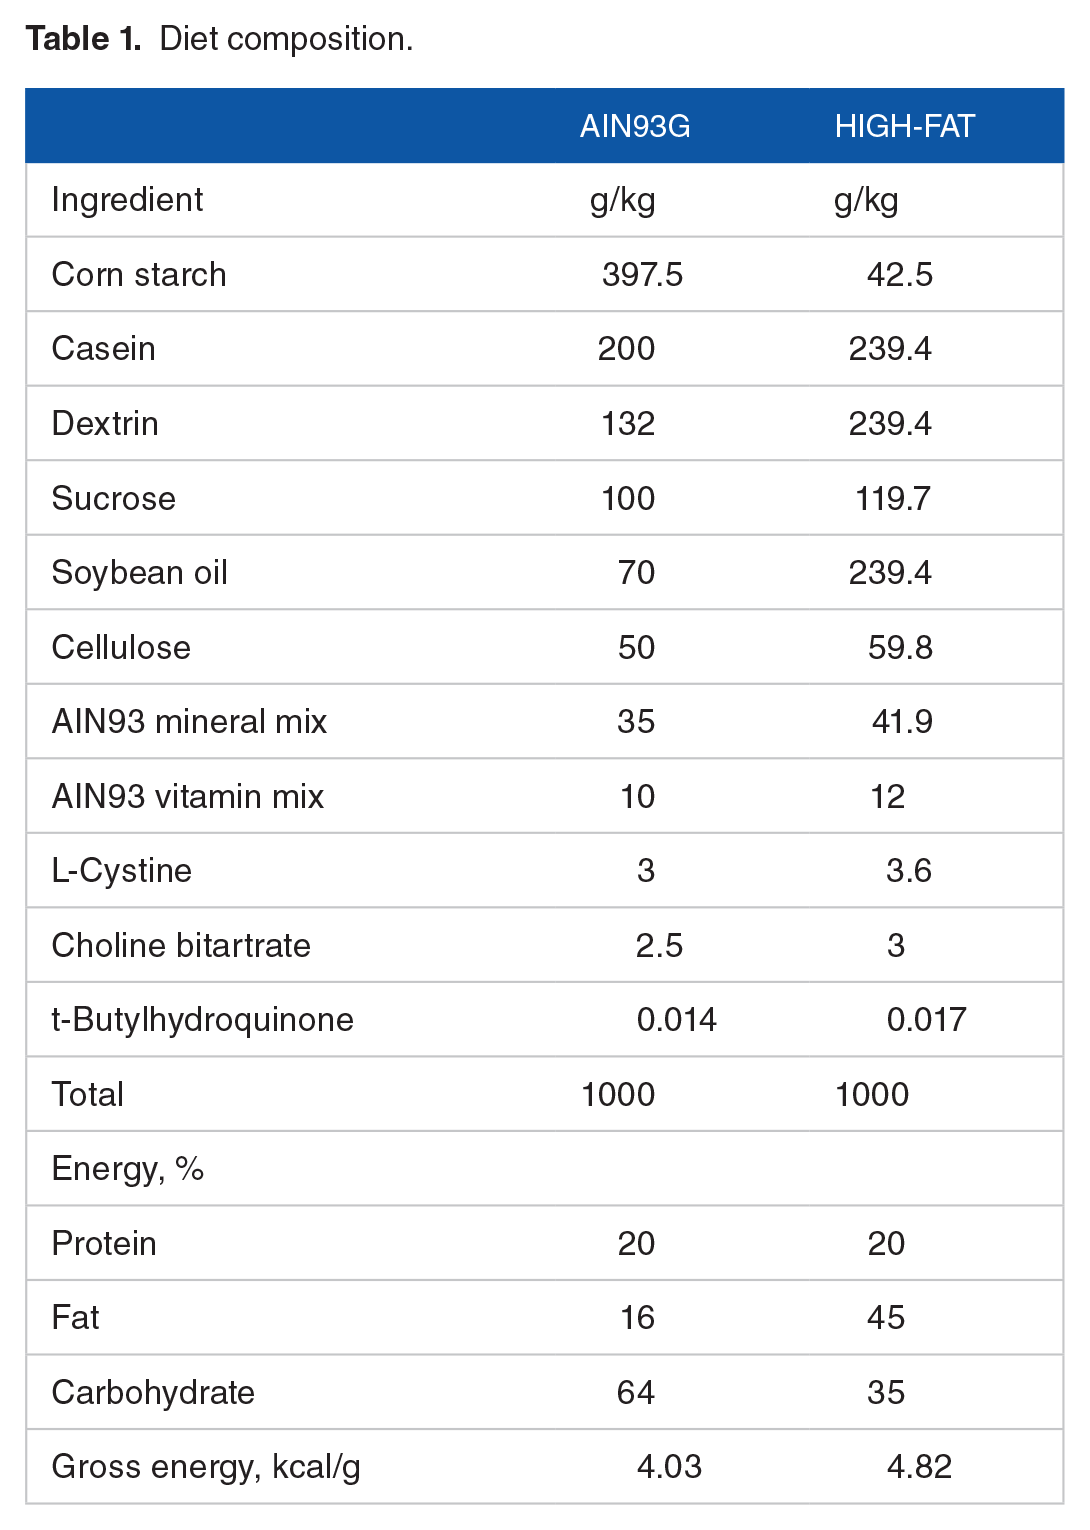
Diet composition.
Experimental design
Three to four-week-old male WT (n = 43) and adipose Mcp-1-/- mice (n = 38), after acclimated to the AIN93G diet for 1 week, were randomly assigned to 2 groups and fed the AIN93G diet or HFD for 12 weeks. One week after the body weights between HFD-fed and AIN93G-fed mice differed significantly, food intake was measured daily for 3 weeks. After 7 weeks on the HFD, body fat mass and lean mass were analyzed for all mice using a whole-body composition analyzer (Model 100, Echo Medical Systems, Houston, TX, USA). After 12 weeks of experimental feeding, mice were euthanized followed by exsanguination. Epididymal fat tissue, liver, and plasma were collected and stored at −80°C until they were analyzed.
Real-time qPCR for Mcp-1 in adipose tissue
Total RNA from epididymal fat was extracted using the RNeasy Mini Kit (Qiagen, Germantown, MD, USA). The purity of the extraction was examined using Nanodrop 8000 Spectrophotometer (Thermo Scientific, Wilmington, DE, USA). The synthesis of cDNA was done using the High-Capacity cDNA Reverse Transcription Kit (Applied Biosystems, Waltham, MA, USA). Real-time qPCR of Mcp-1 (Mm00441242_m1) was assessed and standardized to the 18s rRNA using the TaqMan Assay of Demand primers on the ABI QuantStudio 12K-Flex Real-time qPCR system (Applied Biosystems). Chagnes in Mcp-1 transcription were computed using the 2−ΔΔCT method. 30
MCP-1 in adipose tissue and plasma and insulin and leptin in plasma
Concentrations of MCP-1 (R&D Systems, Minneapolis, MN, USA) in adipose tissue and plasma and insulin (Mercodia Inc., Winston Salem, NC, USA) and leptin (R&D Systems) in plasma were analyzed using sandwich enzyme-linked immunosorbent assay kits. Protein content of fat tissue was quantified using the BCA method (ThermoFisher, Waltham, MA, USA). MCP-1 in fat tissue was reported as pg per mg protein.
Hepatic metabolomic analysis
Liver samples (n = 12 per group) were homogenized in an acetonitrile/isopropanol/deionized water (3:3:2) buffer, centrifuged, and resuspended in an acetonitrile/deionized water (1:1) buffer for untargeted metabolomics by gas chromatography time-of-flight mass spectrometry (GC-TOF-MS)31,32 at the West Coast Metabolomics Center (University of California-Davis, Davis, CA, USA). The GC-TOF-MS data were processed by the BinBase database. 33 The identified analyte ion peak heights were standardized to the sum intensities of all known analytes. To be qualified for metabolomic analysis, an analyte must have its ion peak height ⩾0.02% of the total signal intensity and must be a metabolite or an intermediate of mammalian metabolism according to the Kyoto Encyclopedia of Genes and Genomes (KEGG) Database or the Human Metabolome Database.34-36
Statistical analyses
Two-way analysis of variance and Tukey post hoc test were performed to analyze the effects of diet (AIN93G versus HFD), genotype (WT versus Mcp-1-/-), and their interactions on obtained results among the 4 groups. Bonferroni-corrected P values are reported for body weights. False discovery rate (FDR) -controlled P values are for results from the metabolite analysis. Values of the metabolites were standardized to fold changes before statistical comparison of treatment groups with the control group of WT mice fed the AIN93G diet. The SAS 9.4 (SAS Institute, Cary, NC, USA) was used for statistical analyses. Hierarchical clustering heatmap analysis and sparse partial least square-discriminant analysis (sPLS-DA)37,38 were performed for the metabolomic analysis (MetaboAnalyst 5.0, McGill University, Quebec, Canada). Network analyses were utilized for functional relationships of the metabolites (MetaboAnalyst 5.0). Values are means ± standard error of the mean (SEM), a P ⩽ .05 is considered significant.
Results
Body weight and energy and food intake
Mice fed the HFD became heavier than mice fed the AIN93G diet 1 week after the experimental feeding (P < .05), regardless of genotype (Figure 1A). Body weights between Mcp-1-/- and WT mice were similar when they were fed the same diet (Figure 1A). Energy intake did not differ among the 4 groups (Figure 1B). However, mice fed the HFD ate 0.7 g diet less than mice fed the AIN93G diet, regardless of genotype (Figure 1B).
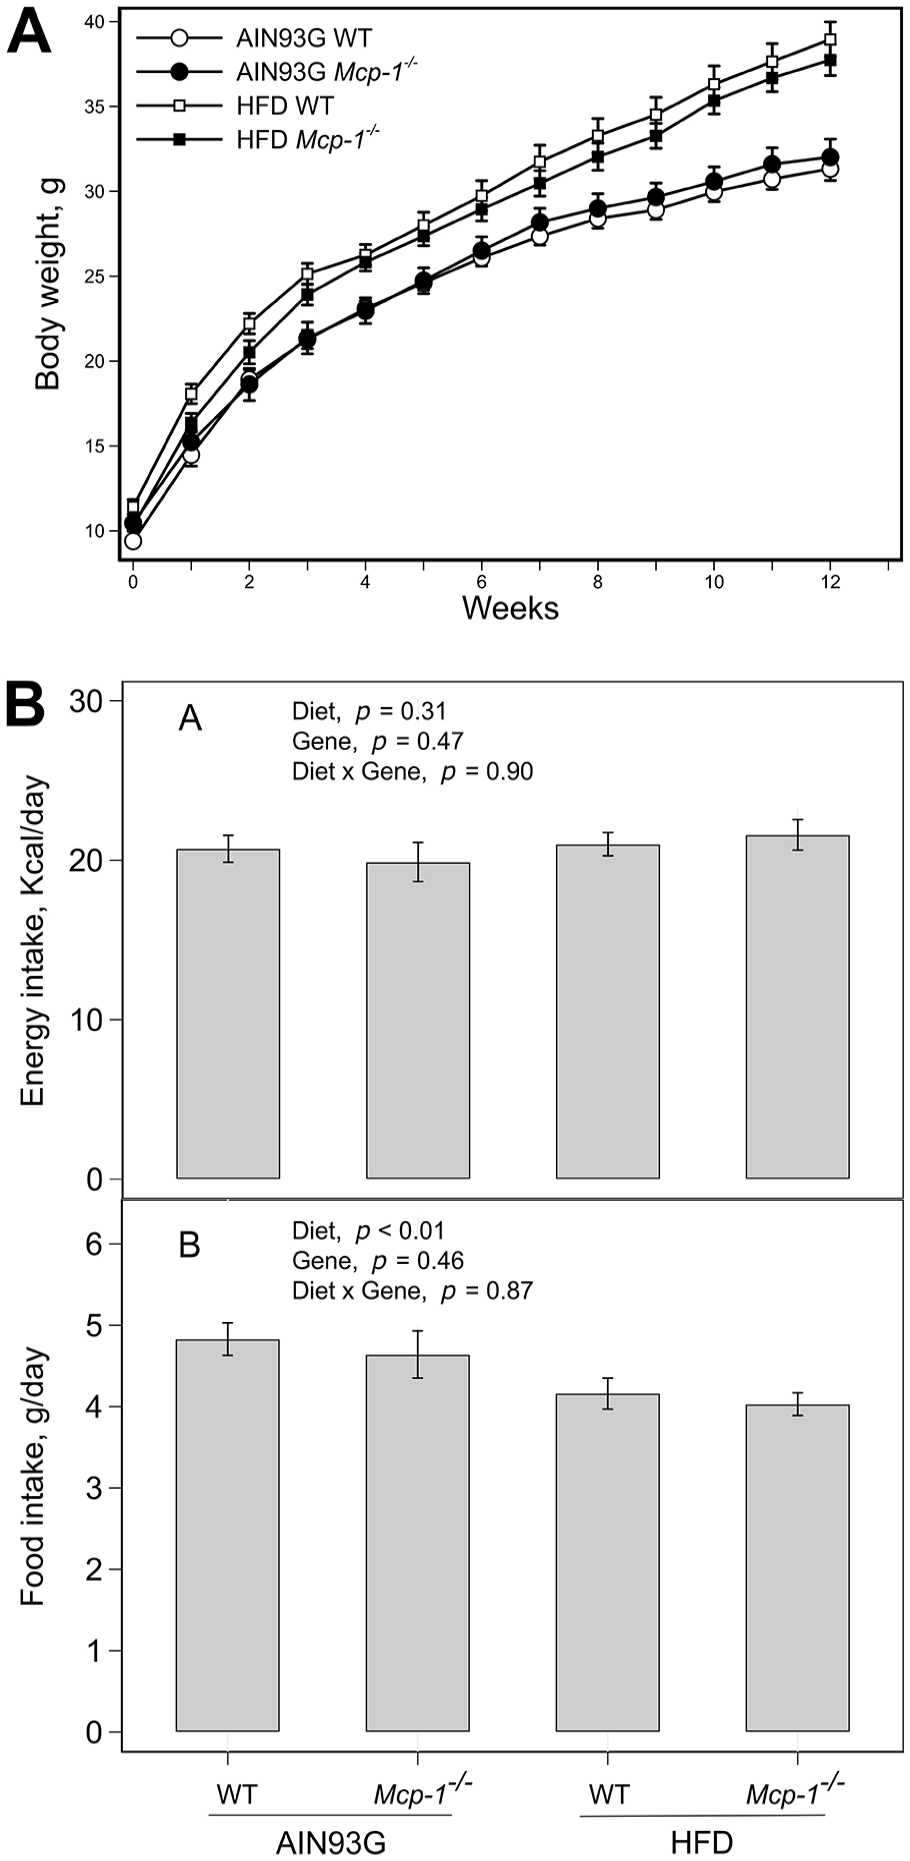
Body weight (A) and energy and food intake (B) of wild-type (WT) and adipose Mcp-1-/- mice fed the AIN93G or high-fat diet (HFD). The HFD increased body weight, compared to the AIN93G diet, 1 week after the HFD feeding (Bonferroni-corrected P < .05). The body weight between Mcp-1-/- and WT mice remained similar when they were fed the same diet. Values are means ± SEM (n = 25 for AIN93G WT, n = 17 for AIN93G Mcp-1-/-, n = 18 for HFD WT, n = 21 for HFD Mcp-1-/- group, respectively, for body weight; n = 6 per group for energy and food intake).
Body composition
The body fat mass was 50% greater (21.78 ± 1.04% versus 14.52 ± 1.02%) and the body lean mass was 9% lower (68.65 ± 0.99% versus 75.22 ± 0.97%) in mice fed the HFD than in mice fed the AIN93G diet, regardless of genotype (Figure 1B). A slightly but significant increase in absolute lean mass occurred in HFD-fed mice compared to AIN93G-fed mice (22.62 ± 0.23 versus 21.43 ± 0.23 g; Figure 2). When fed the same diet, the body fat mass, lean mass, and absolute lean mass were similar between Mcp-1-/- and WT mice (Figure 2).

The body fat mass (A), lean mass (B), and absolute lean mass (C) of wild-type (WT) and adipose Mcp-1-/- mice fed the AIN93G or high-fat diet (HFD). Values are means ± SEM (n = 25 for AIN93G WT, n = 17 for AIN93G Mcp-1-/-, n = 18 for HFD WT, n = 21 for HFD Mcp-1-/- group, respectively).
Adipose Mcp-1 transcription and MCP-1 concentrations in adipose tissue and plasma
Adipose Mcp-1 transcription was at least 250% greater in HFD-fed WT mice than in any of the other 3 groups; the transcription in Mcp-1-/- mice fed either the HFD or AIN93G diet was like that in WT mice fed the AIN93G diet (Figure 3A). Similar changes occurred in MCP-1 concentrations in fat tissue (Figure 3B). Without regard to genotype, plasma MCP-1 was 21% greater in HFD-fed mice than in AIN93G-fed mice (16.91 ± 1.00 versus 13.98 ± 1.00 pg/mL) (Figure 3C). Plasma MCP-1 was 21% lower in Mcp-1-/- mice than in WT mice (13.63 ± 1.00 versus 17.24 ± 1.00 pg/mL), regardless of diet (Figure 3C).

Adipose Mcp-1 transcription (A) and concentrations of MCP-1 in adipose tissue (B) and plasma (C) of wild-type (WT) and adipose Mcp-1-/- mice fed the AIN93G or high-fat diet (HFD). Values (means ± SEM) in each panel with different letters are significant at P ⩽ .05 (n = 10 per group).
Insulin and leptin concentrations in plasma
Without regard to genotype, plasma insulin and leptin were 47% and 95% higher in HFD-fed mice than in AIN93G-fed mice, respectively (Figure 4). Concentrations of insulin or leptin were similar between Mcp-1-/- and WT mice when they were fed the same diet (Figure 4).

Insulin (A) and leptin concentrations (B) in plasma of wild-type (WT) and adipose Mcp-1-/- mice fed the AIN93G or high-fat diet (HFD) (n = 17-20 per group).
Hepatic metabolome
A total of 172 metabolites (Supplemental Table 1) were identified from 446 discrete signals by the GC-TOF-MS analysis. Eighty-seven had analyte ion peak heights ⩾0.02% of the total signal intensity and were considered to be metabolites or intermediates of mammalian metabolism (Supplemental Table 2). These metabolites were grouped into 4 categories based upon their metabolic functions in relation to amino acid (Table 2), energy (Table 3), lipid (Table 4), and nucleotide and vitamin metabolism (Table 5).
Identified metabolites related to amino acid metabolism in liver from wild-type (WT) and adipose Mcp-1-/- mice fed the AIN93G or high-fat diet (HFD).

Values (means ± SEM) of treatment groups are normalized to that of the AIN93G WT group (n = 12 per group). Values in the same row with different letters are significantly different at P ⩽ .05 (FDR-controlled P values).
Identified metabolites related energy metabolism in liver from wild-type (WT) and adipose Mcp-1-/- mice fed the AIN93G or high-fat diet (HFD).

Values (means ± SEM) of treatment groups are normalized to that of the AIN93G WT group (n = 12 per group, FDR-controlled P values).
Identified metabolites related to lipid metabolism in liver from wild-type (WT) and adipose Mcp-1-/- mice fed the AIN93G or high-fat diet (HFD).

Values (means ± SEM) of treatment groups are normalized to that of the AIN93G WT group (n = 12 per group, FDR-controlled P values).
Identified metabolites related to nucleotide or vitamin metabolism in liver from wild-type (WT) and adipose Mcp-1-/- mice fed the AIN93G or high-fat diet (HFD).

Values (means ± SEM) of treatment groups are normalized to that of the AIN93G WT group (n = 12 per group, FDR-controlled P values).
The 25 most differential metabolites identified by the heatmap analysis among the 4 groups fell into 2 clusters (Figure 5). In cluster one, signals of 7 metabolites were elevated in HFD-fed mice compared to AIN93G-fed mice (Figure 5). These were amino acid metabolites (glutamine, taurine, and oxoproline), energy metabolism-related metabolites (sedoheptulose 7-phosphate and glucose), nucleotide metabolite inosine 5-monophasphate, and the vitamin ascorbic acid. The signals of 18 metabolites compromising cluster 2 were elevated in the AIN93G-fed Mcp-1-/- group compared to other 3 groups, particularly the HFD-fed groups (Figure 5). These signals were for amino acid metabolites (methionine, ornithine, tyrosine, β-alanine, creatinine, tryptophan, and serine), nucleotide metabolites (ribose, hypoxanthine, uracil, and xanthine), lipid metabolites (glycerol, ethanolamine, oleic acid, palmitoleic acid, myristic acid, and arachidonic acid), and the biomarker of glycemic control 1,5-anhydroglucitol.

The 25 most differential metabolites identified by the heatmap analysis in liver between wild-type (WT) and adipose Mcp-1-/- mice fed the AIN93G or high-fat diet (HFD; n = 12 per group). The dark-red color shows greater signal strength and dark-blue color shows weaker signal strength determined by GC-TOF-MS.
The 3-dimensional sPLS-DA scores plot showed the group separation by diet (Figure 6A). The AIN93G-fed groups were closely clustered and tended to move leftward, whereas the HFD-fed groups were clustered together and tended to move upward (Figure 6A). Component 1 of the plot contributed the most to the separation, accounting for 23.5%, whereas components 2 and 3 contributed 4.3% and 11.3% to the separation, respectively (Figure 6A).
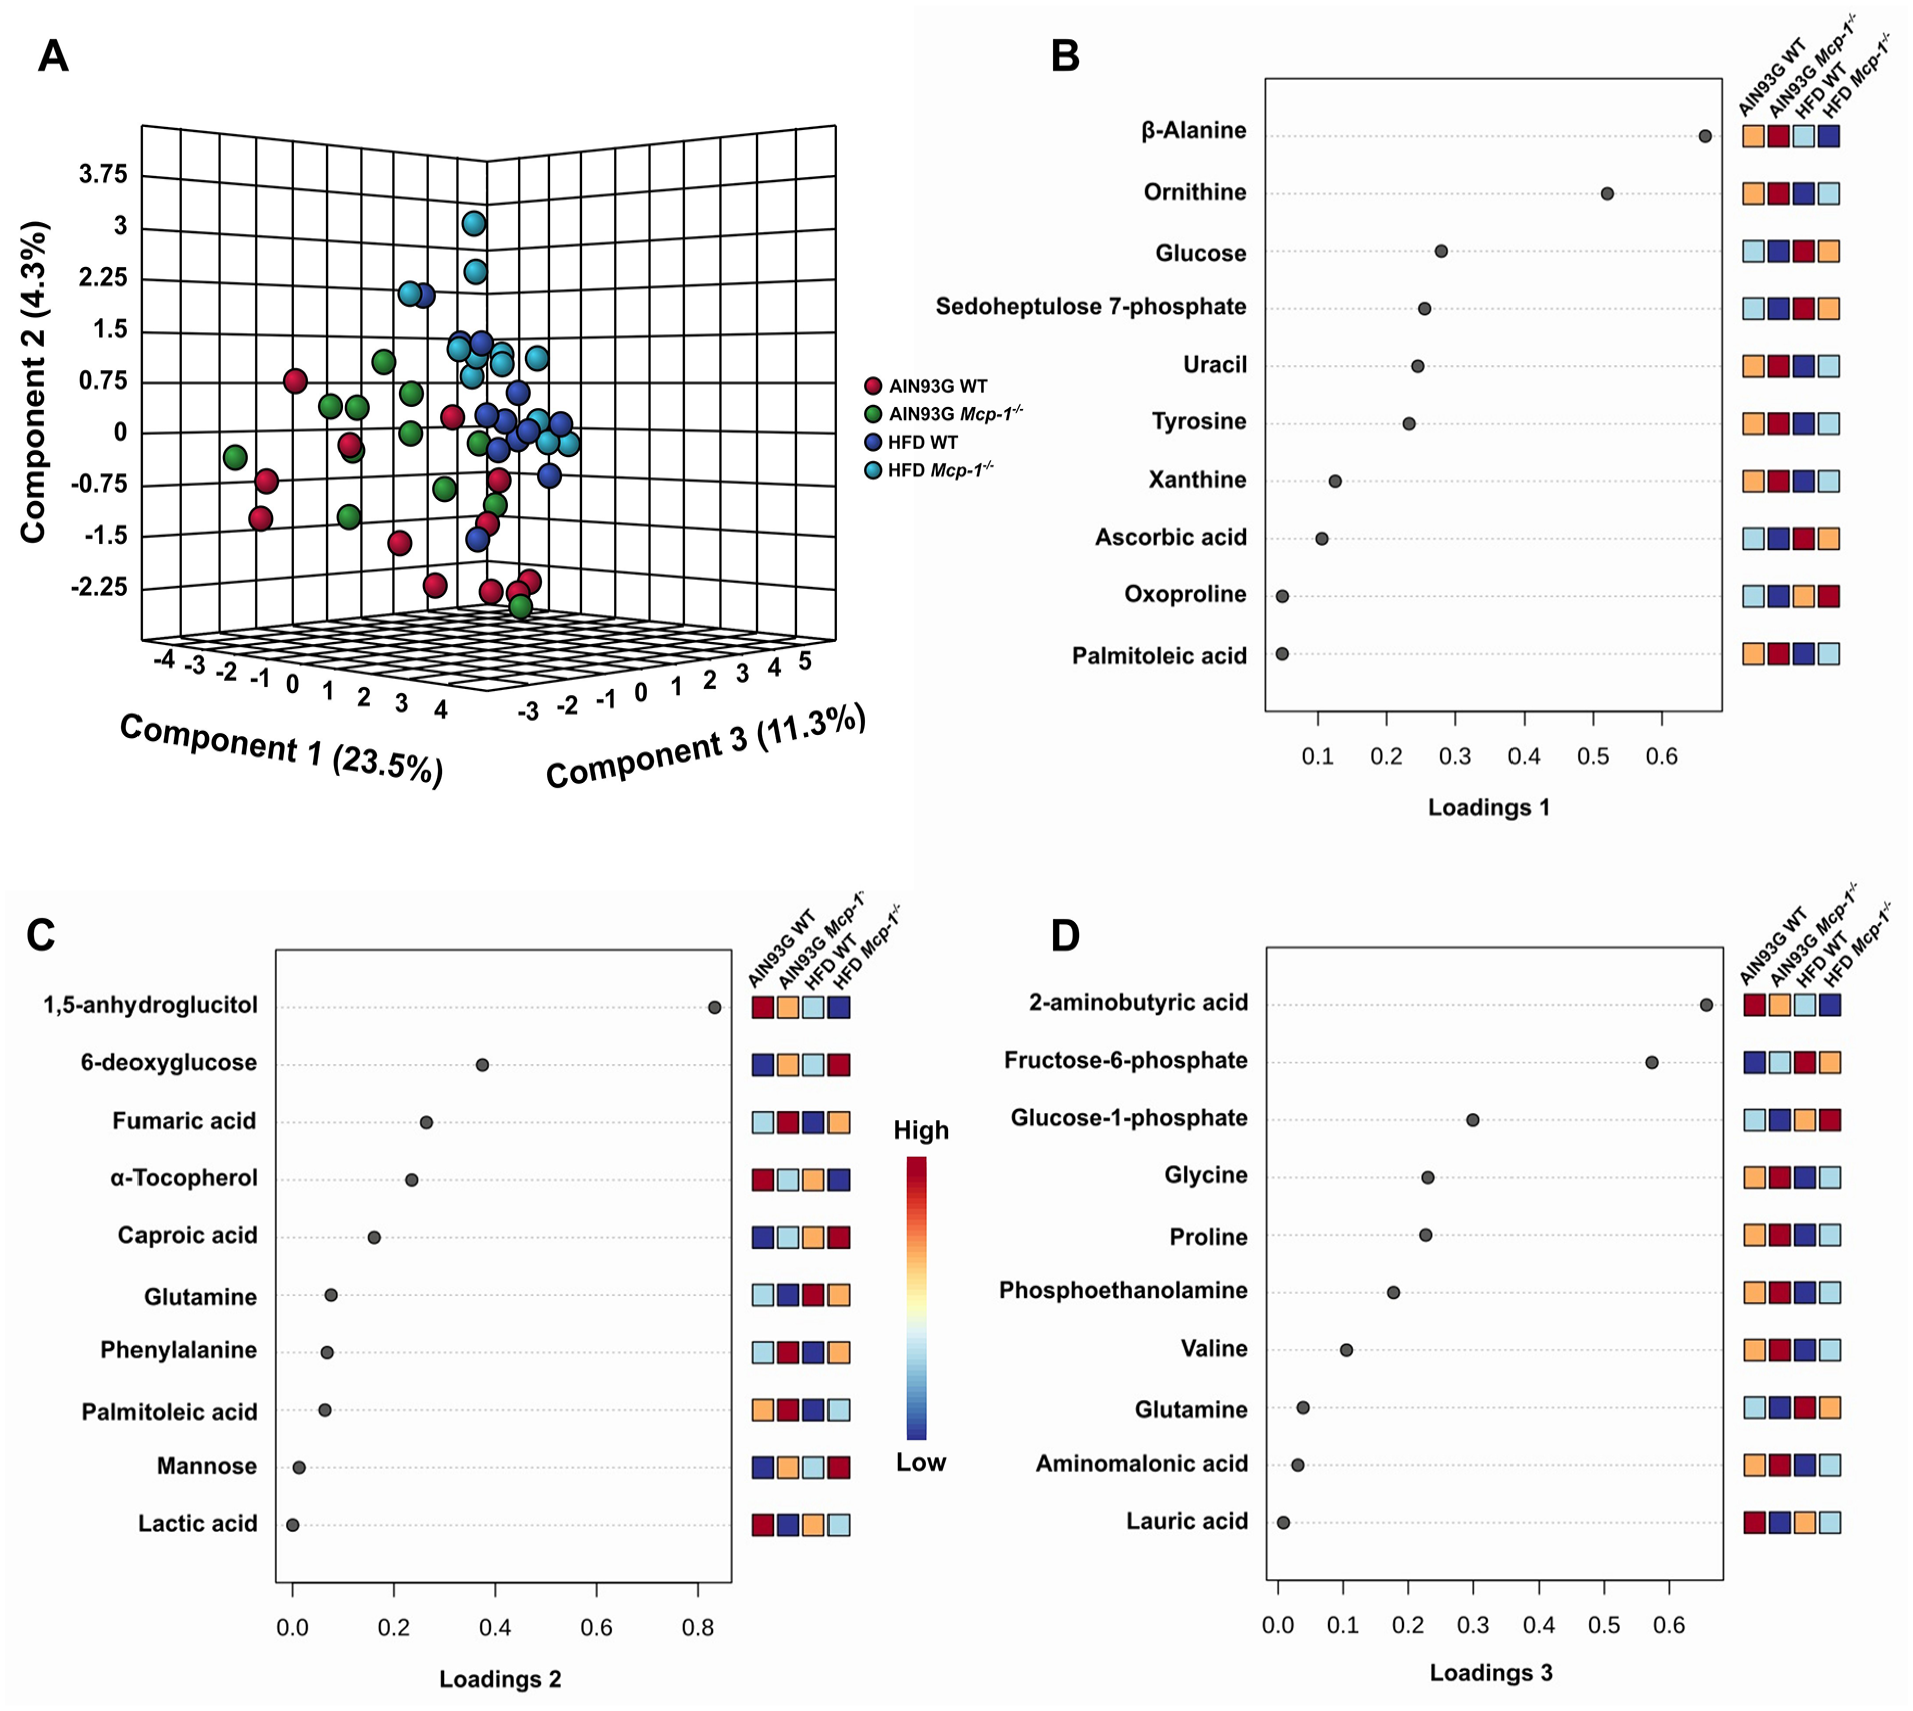
The scores plot by identified hepatic metabolites from wild-type (WT) and adipose Mcp-1-/- mice fed the AIN93G or high-fat diet (HFD) (A). Loadings plots 1 to 3 represent the 10 most influential metabolites responsible for treatment separation for components 1 to 3 (B-D), respectively (n = 12 per group). The x-axis of loadings plots shows that variables are ranked by the absolute values of their loadings. The dark-red color shows greater signal strength and the dark-blue color shows weaker signal strength determined by GC-TOF-MS.
The loadings plot for component 1 revealed that amino acids (β-alanine, ornithine, tyrosine, and oxoproline), energy metabolites (glucose and sedoheptulose 7-phosphate), nucleotide metabolites (uracil and xanthine), ascorbic acid, and palmitoleic acid were the 10 leading determinants of separation (Figure 6B). Ten leading determinants of separation in the loadings plot for component 2 were energy metabolites (1,5-anhydroglucitol, 6-deoxyglucose, fumaric acid, mannose, and lactic acid), amino acids (glutamine and phenylalanine), fatty acids (caproic acid and palmitoleic acid) and α-tocopherol (Figure 6C). The loadings plot for component 3 showed that amino acids (glycine, proline, valine, and glutamine), amino acid metabolites (2-aminobutyric acid and aminomalonic acid), energy metabolites (fructose-6-phosphate and glucose-1-phosphate), and lipid metabolites (phosphoethanolamine and lauric acid) were the major determinants of separation (Figure 6D).
Network analysis
Forty-four metabolic signaling pathways were identified by the KEGG global network analysis when mice fed the HFD were compared to those fed the AIN93G diet, regardless of genotype (Supplemental Table 3). A significant alteration in the aminoacyl-tRNA biosynthesis pathways was found between the 2 diets (Table 6). Twenty metabolic pathways were identified when Mcp-1-/- mice were compared to WT mice, regardless of diet (Supplemental Table 4). Significant alterations occurred in the aminoacyl-tRNA biosynthesis and the phenylalanine, tyrosine and tryptophan biosynthesis pathways between the 2 types of mice (Table 6). Functional relationships of the identified metabolites between the HFD and AIN93G groups and between Mcp-1-/- and WT mice are presented in Figure 7.
Metabolic pathways identified by the KEGG global network analysis that are significantly altered in wild-type (WT) and adipose Mcp-1-/- mice fed the AIN93G or high-fat diet.

Number of identified metabolites that match to pathway metabolites (calculation based upon the number of identified metabolites that differ significantly between the comparison).
FDR-controlled P values.

Metabolic network generated by the identified metabolites in comparison between the AIN93G and high-fat diet (A) and between wild-type and adipose Mcp-1-/- mice (B) (n = 24 per group). Colors from white-yellow to red indicate the level of impact a metabolite has on the network in an ascending order. Network statistics for analyses A and B are in Table 6 and Supplemental Tables 3 and 4, respectively.
Discussion
Diminished Mcp-1 transcription and MCP-1 concentration in fat tissue validated the adipose MCP-1 deficient model used in this study.
Consistent with previous reports,24,39 energy intake was similar between AIN93G-fed and HFD-fed groups. The energy-dense HFD allowed mice to eat less food but with similar energy intake compared to mice fed the AIN93G diet. The HFD induced excess body adiposity in spite of the similar energy intake between the groups fed different diets. Adipose-specific Mcp-1 deficiency did not affect energy intake nor growth. In fact, Mcp-1-/- mice responded to the HFD with a similar increase in body weight as WT mice.
The alteration of the aminoacyl-tRNA biosynthesis pathways shown by the network analysis when mice fed the HFD were compared to those fed the AIN93G diet indicates that the HFD may have altered amino acid metabolism. This finding is consistent with another study that found altered amino-acyl-tRNA biosynthesis pathways in mice fed a HFD. 39 Aminoacyl-tRNA synthetases are a group of enzymes that play a fundamental role in protein synthesis by enzymatic binding of amino acids to their cognate tRNAs. 40 Decreased signal strength of amino acids and their metabolites detected by the GC-TOF-MS in HFD-fed mice support the alteration in aminoacyl-tRNA biosynthesis pathways. These decreased signals included proteogenic amino acids (cysteine, leucine, serine, threonine, tryptophan, and tyrosine), non-proteogenic amino acids and derivatives (β-alanine, ornithine, 2-aminobutyric acid, and 2-hydroxybutanoic acid), and metabolic intermediates of amino acid metabolism α-aminoadipic acid and creatinine. These decreases indicate that the HFD may have increased amino acid catabolism or down-regulated amino acid biosynthesis pathways in mice.
In comparison of Mcp-1-/- mice to WT mice, the significant alterations in the aminoacyl-tRNA biosynthesis and the phenylalanine, tyrosine, and tryptophan biosynthesis pathways indicate that adipose MCP-1 deficiency may have altered amino acid metabolism. Furthermore, we found that adipose MCP-1 deficiency increased signal strengths of hepatic amino acids, including proteogenic amino acids (asparagine, methionine, phenylalanine, and tyrosine) and non-proteogenic amino acid β-alanine and ornithine. These increases suggest increased amino acid anabolism or an up-regulation of amino acid biosynthesis pathways in the absence of MCP-1 from fat tissue.
The contrasting effect of down-regulation by the HFD with up-regulation by adipose MCP-1 deficiency on aminoacyl-tRNA biosynthesis pathways is further supported by similar changes in nucleotide metabolites. The HFD decreased nucleotide metabolite signals of ribose, uracil, uridine (uracil attached to a ribose ring), xanthine (a purine degrative product), hypoxanthine, and inosine (hypoxanthine attached to a ribose ring). Adipose MCP-1 deficiency increased signals of ribose, uracil, xanthine, and hypoxanthine.
The finding that α-aminoadipic acid (an intermediate in lysine metabolism) was drastically diminished in mice fed the HFD seems to contrast with clinical observations that elevated blood α-aminoadipic acid is associated with body fat mass and insulin resistance in humans with obesity 41 and in those with diabetes. 42 However, our finding of diminished α-aminoadipic acid in mice fed the HFD is consistent with animal studies in which mice with increased α-aminoadipic acid are resistant to diet-induced obesity and insulin resistance 43 and with the findings that supplementing HFD-fed mice with α-aminoadipic acid decreases fasting glucose,42,43 body weight, and fat accumulation. 43 The α-aminoadipic acid findings from animal studies are further supported by the finding in the present study that plasma insulin is elevated by the HFD. Further investigations are warranted to determine the reasons for the discrepancies in the α-aminoadipic acid findings from human observational trials and animal experiments, and thus, the role of α-aminoadipic acid in obesogenesis.
As expected, the HFD affected glucose homeostasis. The hepatic metabolomic analysis found that the HFD significantly elevated glucose, glucose-1-phosphate, glucose-6-phosphate and sedoheptulose 7-phosphate and decreased 1,5-anhydroglucitol. These findings suggest that the pentose phosphate pathway has been impaired. The pentose phosphate pathway in cytosol diverts carbon from glycolysis and provides NADPH and ribose-5-phosphate for nucleotide synthesis.44,45 Glucose 6-phosphate and sedoheptulose 7-phosphate are intermediates in the pentose phosphate pathway. The blood concentration of 1,5-anhydroglucitol is inversely correlated with blood glucose content in humans46-48 and thus serves as a biomarker of glycemic control. Metabolomic analyses in other studies have found decreases in 1,5-anhydroglucitol in mice fed a HFD.49,50 The alteration in glucose metabolism that was found when Mcp-1-/- mice were compared to WT mice differed from that caused by the HFD. The glucose signal decreased in Mcp-1-/- mice. MCP-1 is an insulin responsive gene. 21 Treatment of endothelial cells with glucose 51 and treatment of insulin resistant 3T3 adipocytes and ob/ob mice with insulin increases MCP-1 secretion. 21 On the other hand, treatment of differentiated 3T3 adipocytes with MCP-1 diminishes insulin-stimulated glucose update. 51 Thus, adipose deficiency of MCP-1 may explain, at least partly, the present finding of decreased hepatic glucose in Mcp-1-/- mice.
An elevation in ethanolamine in Mcp-1-/- mice was the only significantly different lipid-related metabolite found when Mcp-1-/- were compared to WT mice. Ethanolamine is a naturally occurring compound that is an abundant head group for phospholipids found in biological membranes. 52 The relative abundance of gut bacteria responsible for metabolizing ethanolamine has been found to be diminished in obesity while gut permeability is increased.53,54 Our finding suggesting that ethanolamine metabolism is attenuated in the absence of adipose-derived MCP-1 indicates that further investigation is warranted into determining whether MCP-1 plays a role in gut bacteria homeostatic regulation.
The finding of decreased hepatic α-tocopherol in Mcp-1-/- mice is aligned with a previous report showing decreased α-tocopherol in plasma of Mcp-1-/- mice. 49 α-Tocopherol (an antioxidant) protects cell membranes and lipoproteins against oxidation. The finding of lower α-tocopherol in Mcp-1-/- mice is not likely to be the result of a dietary inadequacy of α-tocopherol, because soybean oil is rich in α-tocopherol. 55 The finding of similar hepatic α-tocopherol in WT mice fed the AIN93G and HFD indicates α-tocopherol was adequate in the diets. Dietary supplementation with α-tocopherol decreases aortic 56 and muscular concentrations of MCP-1 57 in mice. Treatment of aortic endothelial cells with α-tocopherol reduces cellular production of MCP-1. 58 Our findings suggest that adipose-produced MCP-1 may play a role in α-tocopherol metabolism. Whether MCP-1 affects α-tocopherol absorption, tissue storage, or catabolism is a subject for further investigation.
Of the 25 most differential metabolites identified by the heatmap analysis among the 4 groups, 18 were elevated and 7 were lower in Mcp-1-/- mice fed the AIN93G diet. However, such alterations did not occur in Mcp-1-/- mice fed the HFD. In fact, the signal strengths of these 25 metabolites were very similar between WT and Mcp-1-/- mice fed the HFD. The explanation for this inconsistency may be that the present study was conducted with adipose-specific MCP-1 deficient mice, which does not preclude the production of MCP-1 by MCP-1 making cells in other organs in these mice. These cells might respond to the HFD by producing more MCP-1 in the absence of MCP-1 from adipose tissue to compensate for the need of MCP-1 for metabolism in Mcp-1-/- mice.
In summary, the present study showed hepatic metabolomic differences between WT and adipose MCP-1 deficient mice, indicating that adipose-derived MCP-1 affects several metabolic pathways. The effects are independent upon the body adiposity, because body fat mass was similar between WT and Mcp-1-/- mice. The greatest impact of adipose-derived MCP-1 apparently was on amino acid metabolism because of the highly significant alterations in the aminoacyl-tRNA-biosynthesis and the phenylalanine, tyrosine and tryptophan biosynthesis pathways in Mcp-1-/- mice. Findings of metabolomic alterations caused by the absence of MCP-1 in adipose tissue presented in this study may be a building block for the identification and development of new agents or approaches targeting MCP-1 in obesity prevention and treatment.
Supplemental Material
sj-xlsx-1-nmi-10.1177_11786388241280859 – Supplemental material for Metabolomic Alteration in Adipose Monocyte Chemotactic Protein-1 Deficient Mice Fed a High-Fat Diet
Supplemental material, sj-xlsx-1-nmi-10.1177_11786388241280859 for Metabolomic Alteration in Adipose Monocyte Chemotactic Protein-1 Deficient Mice Fed a High-Fat Diet by Lin Yan, Bret M Rust, Sneha Sundaram and Forrest H Nielsen in Nutrition and Metabolic Insights
Supplemental Material
sj-xlsx-2-nmi-10.1177_11786388241280859 – Supplemental material for Metabolomic Alteration in Adipose Monocyte Chemotactic Protein-1 Deficient Mice Fed a High-Fat Diet
Supplemental material, sj-xlsx-2-nmi-10.1177_11786388241280859 for Metabolomic Alteration in Adipose Monocyte Chemotactic Protein-1 Deficient Mice Fed a High-Fat Diet by Lin Yan, Bret M Rust, Sneha Sundaram and Forrest H Nielsen in Nutrition and Metabolic Insights
Supplemental Material
sj-xlsx-3-nmi-10.1177_11786388241280859 – Supplemental material for Metabolomic Alteration in Adipose Monocyte Chemotactic Protein-1 Deficient Mice Fed a High-Fat Diet
Supplemental material, sj-xlsx-3-nmi-10.1177_11786388241280859 for Metabolomic Alteration in Adipose Monocyte Chemotactic Protein-1 Deficient Mice Fed a High-Fat Diet by Lin Yan, Bret M Rust, Sneha Sundaram and Forrest H Nielsen in Nutrition and Metabolic Insights
Supplemental Material
sj-xlsx-4-nmi-10.1177_11786388241280859 – Supplemental material for Metabolomic Alteration in Adipose Monocyte Chemotactic Protein-1 Deficient Mice Fed a High-Fat Diet
Supplemental material, sj-xlsx-4-nmi-10.1177_11786388241280859 for Metabolomic Alteration in Adipose Monocyte Chemotactic Protein-1 Deficient Mice Fed a High-Fat Diet by Lin Yan, Bret M Rust, Sneha Sundaram and Forrest H Nielsen in Nutrition and Metabolic Insights
Footnotes
Acknowledgements
The authors acknowledge Dr. Kathleen Yeater and Daniel Palmer for assistant in statistical analyses, Lana DeMars and Jack He for technical support, and vivarium staff for diet preparation and high-quality animal care. USDA is an equal opportunity provider. Mention of trade names or commercial products in this publication is solely for the purpose of providing specific information and does not imply recommendation or endorsement by the USDA.
Author Contributions
LY and SS conceptualized the study and performed experiments. LY, BMR, SS and FHN participated in analyzing the data, interpreting the results, and writing the manuscript.
Declaration of conflicting interests:
The author(s) declared no potential conflicts of interest with respect to the research, authorship, and/or publication of this article.
Funding:
The author(s) disclosed receipt of the following financial support for the research, authorship, and/or publication of this article: This work was funded by the USDA Agricultural Research Service Project #3062-51000-056-00D.
Ethics Statement
The Grand Forks Human Nutrition Research Center Institutional Animal Care and Use Committee approved this study.
Supplemental Material
Supplemental material for this article is available online.
References
Supplementary Material
Please find the following supplemental material available below.
For Open Access articles published under a Creative Commons License, all supplemental material carries the same license as the article it is associated with.
For non-Open Access articles published, all supplemental material carries a non-exclusive license, and permission requests for re-use of supplemental material or any part of supplemental material shall be sent directly to the copyright owner as specified in the copyright notice associated with the article.