
Abstract
Increasing dietary intake of fish oil is frequently recommended for decreasing the risk for cardiovascular diseases and improving metabolic health. We hypothesised that dietary intake of chromista oil (a marine food product and a rich source of long-chain n-3 polyunsaturated fatty acids) ameliorates metabolic impairments in mice with established excess adiposity. Three-to 4-week-old mice (male) were fed a control (n = 12) or a high-fat diet (HFD, n = 24) for 12 weeks to establish body fat mass. Then, mice on the HFD were assigned to 2 groups (n = 12 each) with 1 continuing being fed the HFD and the other fed the HFD with chromista oil for an additional 12 weeks. Intake of chromista oil did not affect body weight and body adiposity of the mice fed the HFD; mice fed the HFD had significantly more body weight and fat mass than control mice. The flattened daily oscillations of respiratory exchange ratio induced by the HFD were not changed by chromista oil intake. Intake of chromista oil significantly increased plasma concentration of insulin, the calculated value of HOMA-IR, and plasma concentration of adiponectin in the mice fed the HFD. However, blood glucose was unaffected by chromista oil. Transcription of genes encoding circadian rhythm and fatty acid metabolism of the 2 HFD-fed groups were similar. Untargeted metabolomic analysis showed that intake of chromista oil altered the hepatic metabolomic profile with substantial alterations in amino acid metabolism. Findings from this study indicate that dietary intake of chromista oil does not improve glucose homeostasis or alter the diminished metabolic flexibility in mice with excess adiposity induced by the HFD. Targeted metabolomic analysis is warranted to investigate the effects of dietary chromista oil, as a source of n-3 poly unsaturated fatty acids, on metabolism in models of obesity.
Introduction
Long-chain n-3 polyunsaturated fatty acids (n-3 PUFA, eg, docosahexaenoic acid and eicosapentaenoic acid) are conditionally essential fatty acids derived mostly from marine foods. They have been widely studied for their putative health benefits, including for infant brain development, cognitive function, weight management and reduced cardiovascular disease risk. 1 Extensive clinical investigations have examined the health benefits of fish oil and n-3 PUFA in individuals with existing cardiovascular diseases.2 -4 Both the American Heart Association and the Dietary Guidelines for Americans advocate consumption of 2 servings of fatty fish per week for the prevention of cardiovascular diseases.5,6
The diverse mechanisms through which n-3 PUFA found in fish oil act to have health benefits include transcriptional regulation, allosteric alteration of signalling, physiochemical properties and autocrine signalling modulation. 7 These n-3 fatty acids might also directly affect physiologic functions (eg, lipoprotein particle size) or act through mediators such as inflammatory cytokines. However, whether n-3 PUFA may have health benefits through improving the metabolomic profile has not been examined.
Evidence for fish oil reducing body weight and adiposity is inconsistent. Studies with rodents have indicated that an increased intake of fish oil reduces adipose mass.8 -10 However, none of these investigations found that fish oil reduced body weight following diet-induced obesity but did reduce the rate of weight gain in rats consuming obesogenic diets after excess adiposity had been induced.8,11 Human studies indicate that increased dietary intake of n-3 PUFA, from marine origins, enhances satiety and body weight management during weight loss regiments for overweight and obese subjects.12,13
Consumption of fish oil alters the expression of genes associated with metabolic homeostasis. For example, rhythmic expression of clock genes is altered in mice fed a diet containing fish oil.14,15 Addition of fish oil to a hyperlipidemic diet suppresses expression of genes encoding fatty acid synthesis 16 and ameliorates metabolic disturbance caused by apolipoprotein E deficiency by regulating genes involved in liver fatty acid transport and lipid metabolism in mice. 17 Previously, we found that replacing corn oil with fish oil in an obesogenic diet decreased pro-inflammatory leptin, increased anti-inflammatory adiponectin and reduced insulin in plasma in mice. 18 Changes found in these studies might have occurred through n-3 PUFA altering the expression of genes and proteins and their corresponding signalling pathways for metabolism.
Animal studies investigating the roles of n-3 PUFA in metabolic homeostasis have been primarily initiated in rodents prior to their development of obesity or hyperlipidemia.11,18,19 However, investigating the effects in rodent models with established excess adiposity has been limited. To our knowledge, the determination of hepatic metabolomics that might indicate the potential mechanistic bases for n-3 PUFA affecting metabolic health has not been performed. Thus, evaluation of the roles that n-3 PUFA play in metabolic homeostasis in models with existing obesity may give important insights into the basis for their health benefits.
We hypothesised that dietary intake of chromista oil (a marine food product particularly rich in n-3 PUFA) ameliorates metabolic impairments in mice with excess adiposity. To test this hypothesis, the effect of chromista oil consumption on the metabolomic profile was determined in adult mice with diet-induced excess adiposity.
Materials and Methods
Animals and diets
Three- to four-week-old mice (C57BL/6NHsd, male, Envigo, Madison, WI) were housed in polycarbonate cages on contact bedding in a rodent-housing room (temperature: 22 ± 1°C, light cycle: 12:12-hour light-dark cycle). Three powder diets were compared in this study, a control diet, a high-fat diet (HFD) and a HFD with chromista oil. Diets conformed to the AIN93G formulation 20 (Table 1). Dietary oil provided 16% of energy in the control diet and 48% of energy in both the HFD and chromista oil containing HFD (Table 1). Fatty acid composition of chromista oil is presented in Table 2. Chromista oil (Source Oil, Chapel Hill, NC, USA) provided 8.76 g docosahexaenoic acid (DHA) and 0.13 g eicosapentaenoic acid (EPA) per kg diet. The quantity of chromista oil added to the HFD was based upon the National Institutes of Health suggested adequate intakes of 1.1 to 1.6 g of n-3 fatty acids per day for American adults. 21 Diets were stored in sealed containers at −20°C. Mice were fed ad libitum, receiving fresh diet and deionised water every other day.
Diet composition.

Modification of the AIN93G formulation.20 Palm oil (no. 18928), cocoa butter (no. 80612) and safflower oil-Linoleic (no. 5004) were obtained from Natural Oils International, Inc. (Simi Valley, CA, USA). Flaxseed oil (no. 20123) was from Dyets, Inc. (Bethlehem, PA, USA). Chromista oil (no. 1800610, containing 30% docosahexaenoic acid and 0.3% eicosapentaenoic acid) was from Source Oil, LLC. (Chapel Hill, NC, USA).
Abbreviations: HFD: high-fat diet; HFD-CO: chromista oil-containing high-fat diet.
Fatty acid composition of chromista oil.

Values are means ± standard deviation (n = 3).
Abbreviations: E: trans isomers, Z: cis isomers.
Fatty acid composition of chromista oil
Fatty acid composition of chromista oil was determined using the fatty acid methyl ester (FAME) method, 22 with separation, identification and quantification performed by gas chromatography with flame ionisation detection (Thermo Trace-1310 equipped with a TriPlus RHS auto-sampler, Thermo Fisher Scientific, Waltham, MA, USA). Data were analysed using the Dionex Chromeleon 7.2 chromatography data system. 23
Experimental design
To meet the reduction, refinement and replacement principles of humane use of laboratory rodents, 24 this study was designed to use fewer mice by performing it concurrently with a study investigating the effect of food timing on metabolic flexibility in mice with excess fat mass. 25 These 2 studies shared the same control and HFD groups. Body weight was the outcome of interest for power analysis for these studies. Given a residual standard deviation of 3.4 and a significant level of α = .05, 11 mice per group were needed to detect a 5 g decrease in body weight through food timing for 90% power. To avoid attrition, an extra mouse was added to each group to bring the total to 12 mice per group.
This was a 24-week study during which excess fat mass in HFD-fed mice was established in the first 12 weeks. Mice were fed the chromista oil containing HFD diet for the second 12 weeks for determination of the effect chromista oil intake on metabolomic disturbances in mice with established adiposity. After 1-week acclimation, mice were fed the control diet (n = 12) or the HFD (n = 24) for 12 weeks. Then, the HFD-fed mice were split to 2 groups of 12 each and fed the HFD and the chromista oil containing HFD, respectively, for the remainder of the study. After 4 weeks on the chromista HFD, all mice were recorded for their food intake for 3 consecutive weeks (7 days per week). Body fat and lean mass of each mouse were assessed after the completion of food intake measurement using the Echo whole-body composition analyzer (Echo Medical System, Houston, TX, USA). The feed efficiency was calculated using the total weight gain and total food intake over the three-week period by the formula (weight gain/food intake) × 100. At the end of the study, mice were euthanised at Zeitgeber time 5 to 7. Plasma and livers were collected and stored at −80°C.
Whole body metabolic study
During the 8th week of feeding the chromista HFD, whole body metabolism was evaluated in all mice by indirect calorimetry (Comprehensive Laboratory Animal Monitoring System, Columbus Instruments, Columbus, OH, USA). After acclimation to the metabolic chamber for 1 day, the consumption of O2 (VO2) and production of CO2 (VCO2) of each mouse were recorded for 1 minute every 12 minutes for 2 days. The respiratory exchange ratio (RER) was calculated using the formula RER = VCO2/VO2. The modified Weir equation (3.815 + 1.232 × RER) × VO2 26 was used for energy expenditure calculations. Total physical activity was assessed by the number of ambulatory × beam breaks measured by infrared photocells.
Quantification of biomarkers in plasma
Blood glucose was quantified using an Accu-Chek Aviva blood glucose metre (Roche Diagnostics, Indianapolis, IN, USA). Plasma concentrations of insulin, leptin and adiponectin were quantified using sandwich enzyme-linked immunosorbent assay kits from Mercodia, Inc., Winston Salem, NC, USA (for insulin) and R&D Systems, Minneapolis, MN, USA (for leptin and adiponectin). Homeostatic model assessment of insulin resistance (HOMA-IR) score was calculated using the formula (mg glucose/dL × mUnit insulin/L)/405.
Quantification of triacylglycerol in liver
Hepatic triacylglycerol was analysed as previously described. 27 Briefly, liver samples were homogenised in a hexane:isopropanol (3:2 v/v) buffer with 50 μmoL butylated hydroxytoluene. The supernatant was collected and evaporated. The remaining fat residue was solubilised in 100% ethanol for quantifying triacylglycerol (analyzer no. 20767107) using the COBAS INTEGRA 400 Plus analyzer (Roche Diagnostics, Ramsey, MN, USA).
RNA isolation and real-time qPCR
Total RNA from liver samples was extracted using the RNeasy Mini Kit (Qiagen, Germantown, MD, USA). RNA purity was determined using a NanoDrop 8000 Spectrophotometer (Thermo Scientific, Wilmington, DE, USA). The cDNA synthesis was performed using a High-Capacity cDNA Reverse Transcription Kit (Applied Biosystems, Waltham, MA, USA). Circadian locomotor output cycles kaput (Clock), aryl hydrocarbon receptor nuclear translocator-like protein 1 (Bmal1/Arntl), period-1 (Per1) and Per2, cryptochrome 1 (Cry1), nuclear receptor subfamily 1 group D member 1 (Nr1d1/1Rev-erbα), acetyl-CoA carboxylase (Acaca), fatty acid desaturase (Fads) 1 and 2, fatty acid synthase (Fasn), stearoyl-CoA desaturase 1 (Scd1) and sterol regulatory element-binding protein 1 (Srebf1) were determined and normalised to 18s rRNA on ABI QuantStudio 12K-Flex Real-time quantitative PCR system (Applied Biosystems). The relative changes in transcription were calculated using the 2-ΔΔCT method. 28 Probes for 18s rRNA and genes analysed were obtained from Applied Biosystems (Clock (Mm00455950_ml), Bmal1/Arntl (Mm00500223_ml), Per1 (Mm00501813_ml), Per2 (Mm00478099_ml), Cry1 (Mm00514392_ml), Nr1d1/Rev-erb (Mm00520708_ml), Acaca (Mm01304257_m1), Fads1 (Mm00507605_m1), Fads2 (Mm00517221_m1), Fasn (Mm00662319_m1), Scd1 (Mm00772290_m1) and Srebf1 (Mm00550338_m1)).
Hepatic metabolomic analysis
Liver samples suspended in an acetonitrile/isopropanol/deionised water (3:3:2) buffer were homogenised, centrifuged, resuspended in an acetonitrile/deionised water (1:1) buffer, and analysed by gas chromatography time-of-flight mass spectrometry (GC-TOF-MS) for untargeted metabolomic analysis29,30 at the West Coast Metabolomics Center (University of California-Davis, Davis, CA, USA). The BinBase database 31 was used to process the GC-TOF-MS data. The identified analyte ion peak heights were standardised to the sum intensities of all known analytes. To be qualified for metabolomic and statistical analyses, analytes must have their ion peak heights ⩾0.02% of the total signal intensity and must be a metabolite or an intermediate common to mammalian metabolism according to the Kyoto Encyclopedia of Genes and Genomes (KEGG) Database or the Human Metabolome database.32,33
Statistical analyses
A mixed model with Tukey’s honestly significant difference test was performed for all pairwise comparisons of weekly body weights. One-way analysis of variance (ANOVA) followed by Tukey contrasts were performed for differences in hepatic metabolites with the false discovery rate (FDR) -corrected P values reported (SAS 9.4, SAS Institute, Cary, NC, USA). Sparse partial least square-discriminant analysis (sPLS-DA)34,35 was utilised in the analysis of the GC-TOF-MS data (MetaboAnalyst 5.0, McGill University, Quebec, Canada). Functional relationships of identified metabolites were analysed using the KEGG global metabolic network analysis and the metabolite-metabolite interaction network analysis (MetaboAnalyst 5.0). Values are means ± standard error of the mean (SEM); P ⩽ .05 are considered significant.
Results
Measurements in live animals
Compared to the control diet, the HFD increased body weight; the difference became significant after 9 weeks of the HFD feeding and remained for the remainder of the study (Figure 1A). At the end of the study, liver weight of the HFD-fed groups was more than 30% higher than that of the control group (Table 3). Both body weights and liver weights were similar between the 2 HFD-fed groups (Figure 1A and Table 3).

Changes in body weight (A) and respiratory exchange ratio (B) in mice fed the control diet, high-fat diet (HFD), or chromista oil-containing HFD (HFD-CO). Results are means ± SEM (n = 12 per group for body weight; n = 9 per group for respiratory exchange ratio).
Body composition, food and caloric intakes, feed efficiency, liver weight, respiratory exchange ratio (RER), energy expenditure and physical activity of mice fed the control diet, high-fat diet (HFD), or chromista oil-containing HFD.

Values (means ± SEM) in the same row with different superscripts are significant at P ⩽ .05 (n = 12 per group for body composition, food and caloric intakes, feed efficiency and liver weight; n = 9 per group for RER, energy expenditure and physical activity). Values in the same column with a * are different at P ⩽ .05 when dark phase is compared to light phase (Bonferroni-adjusted P values).
Regardless of the source of dietary oil, the HFD increased body fat mass by 29% and decreased lean mass by 12% compared to the control diet (Table 3). Body fat mass and lean mass were similar in the 2 HFD-fed groups (Table 3). The absolute lean mass was similar among the 3 groups (Table 3). Mice of both HFD groups ate 20% less food than mice fed the control diet; however, caloric intake of the 3 groups remained similar (Table 3). Feed efficiencies of the HFD-fed groups were 150% greater than that of the control group but remained similar between the 2 HFD-fed groups (Table 3).
Daily oscillation of RER occurred in mice fed the control diet with the peak in the dark phase (Figure 1B). The difference in mean RER for the control mice between light and dark phases was significant (Table 3). Regardless of dietary oil composition, the HFD diminished rhythmic oscillation of RER; these mice had no significant difference in RER between the light and dark phases (Figure 1B and Table 3). Energy expenditure was similar among the 3 groups (Table 3). However, all 3 groups exhibited a significantly higher energy expenditure in the dark phase than in the light phase. Mice of all groups were more physically active in the dark phase; however, mice of both HFD groups were less physically active than control mice (Table 3).
Biomarkers in blood and lipids in liver
Both HFDs elevated blood glucose concentrations, but only the chromista HFD group was significantly greater than the control group (Table 4). The HFD, compared to the control diet, did not significantly affect plasma insulin. However, the chromista HFD elevated plasma insulin by 104% compared to the HFD (Table 4). These results concurred with the calculated HOMA-IR score. Plasma leptin concentrations were higher in both HFD-fed groups than in the control group (Table 4). Plasma adiponectin of the HFD-fed mice was 19% lower than that of the control mice but adding chromista oil to the HFD resulted in a 41% increase in adiponectin than the HFD-fed mice (Table 4). Compared to the control diet, both HFDs elevated concentrations of total cholesterol by more than 30% and high-density lipoprotein (HDL) cholesterol by 26% in plasma and elevated triacylglycerol by more than 200% in liver (Table 4).
Metabolic biomarkers in plasma and triacylglycerols in liver from mice fed the control diet, high-fat diet (HFD), or chromista oil-containing HFD (HFD-CO).
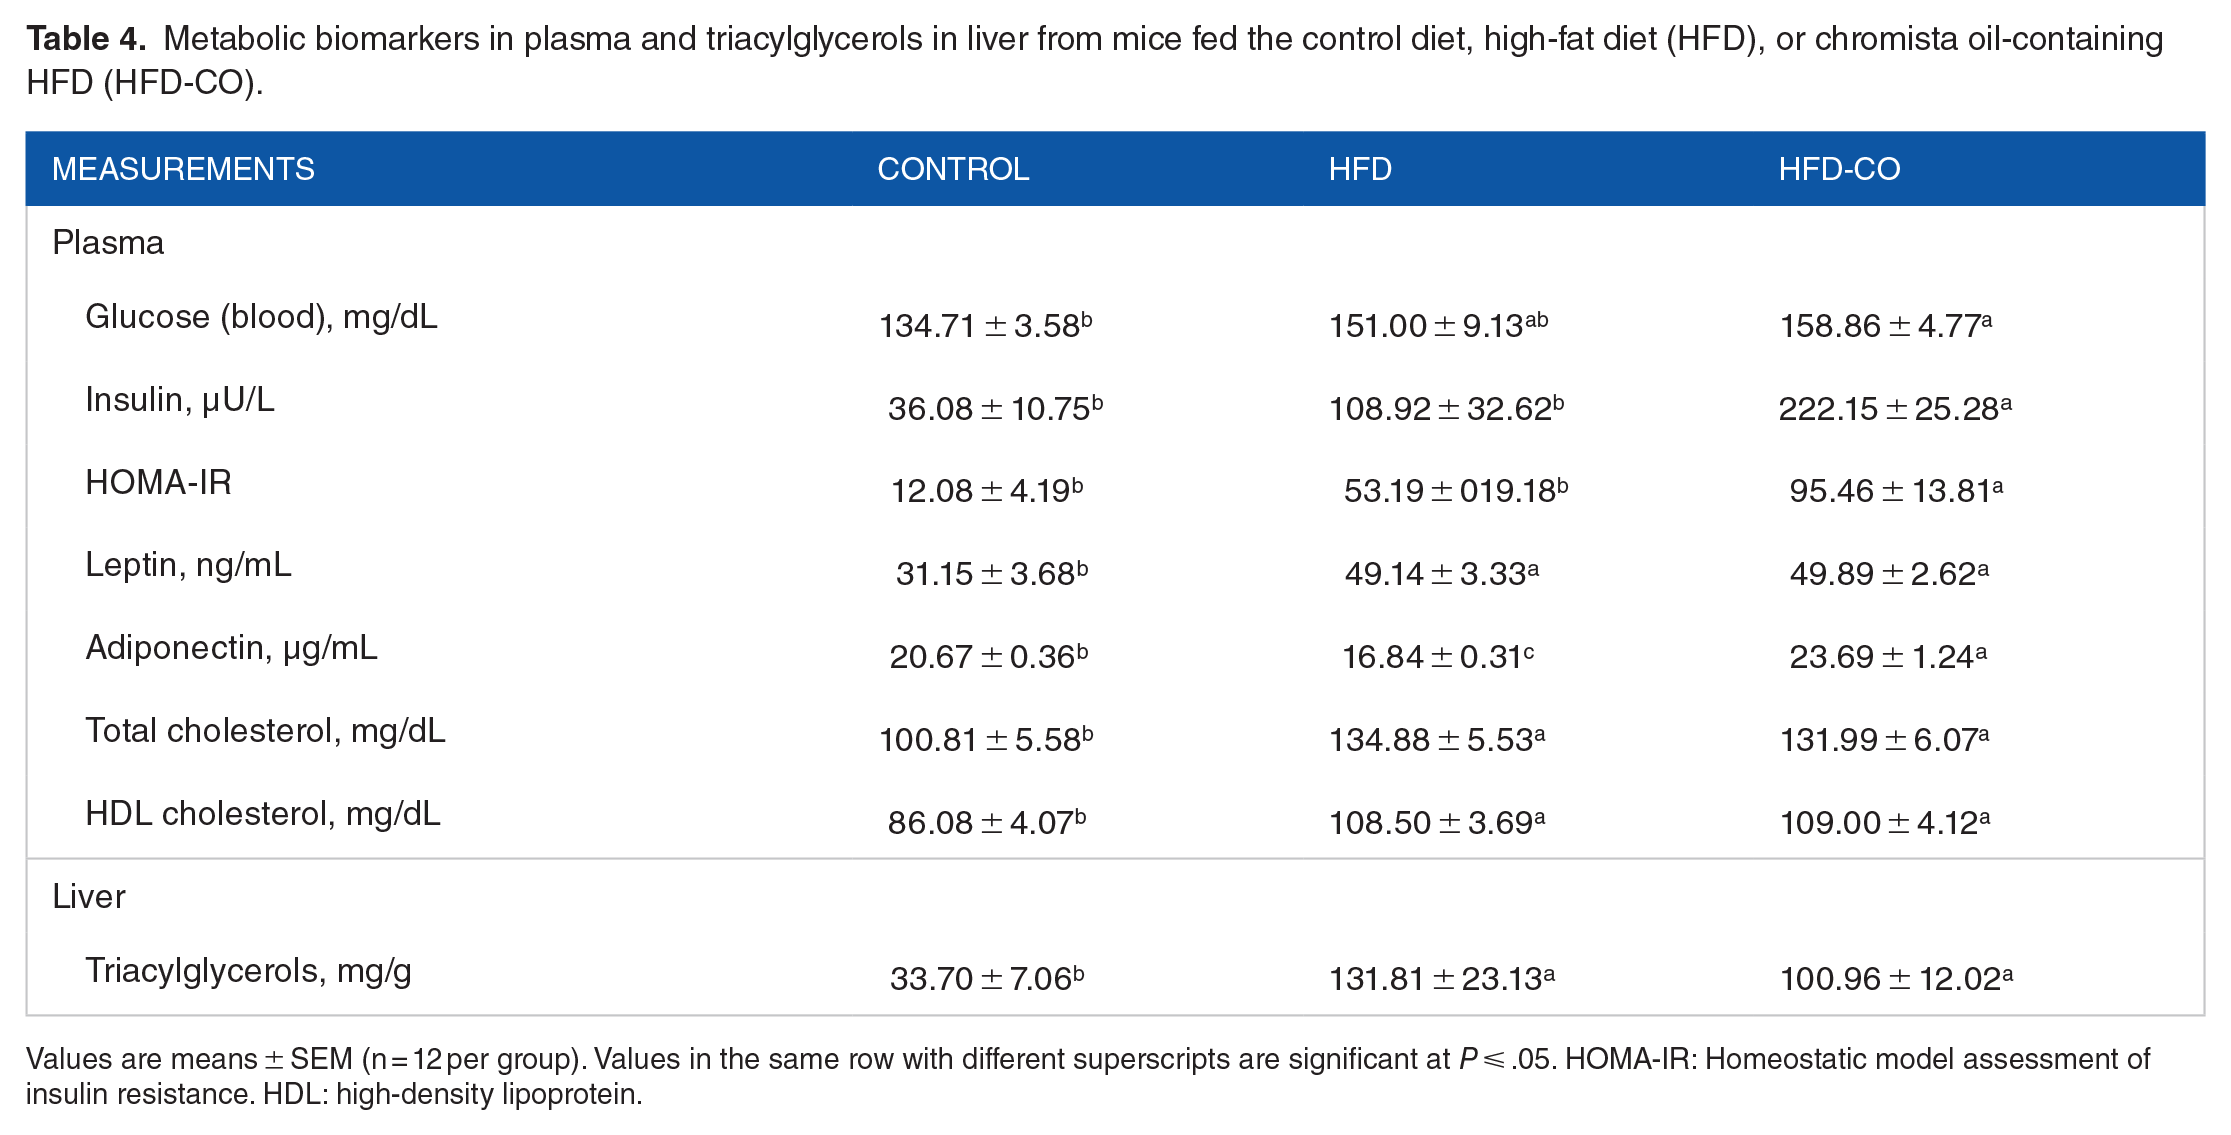
Values are means ± SEM (n = 12 per group). Values in the same row with different superscripts are significant at P ⩽ .05. HOMA-IR: Homeostatic model assessment of insulin resistance. HDL: high-density lipoprotein.
Genes encoding circadian rhythms and fatty acid metabolism
Elevated transcription of Per1, Per2 and Rev-erb occurred in both HFD-fed groups relative to the control group; the elevation was similar between the 2 HFD groups (Figure 2). Transcription of Clock, Bmal1 and Cry1 did not differ among the 3 groups (Figure 2). Transcription of Acaca, Fads1, Fads2, Fasn, Scd1 and Srebf1 was similar among the three groups (Figure 2).
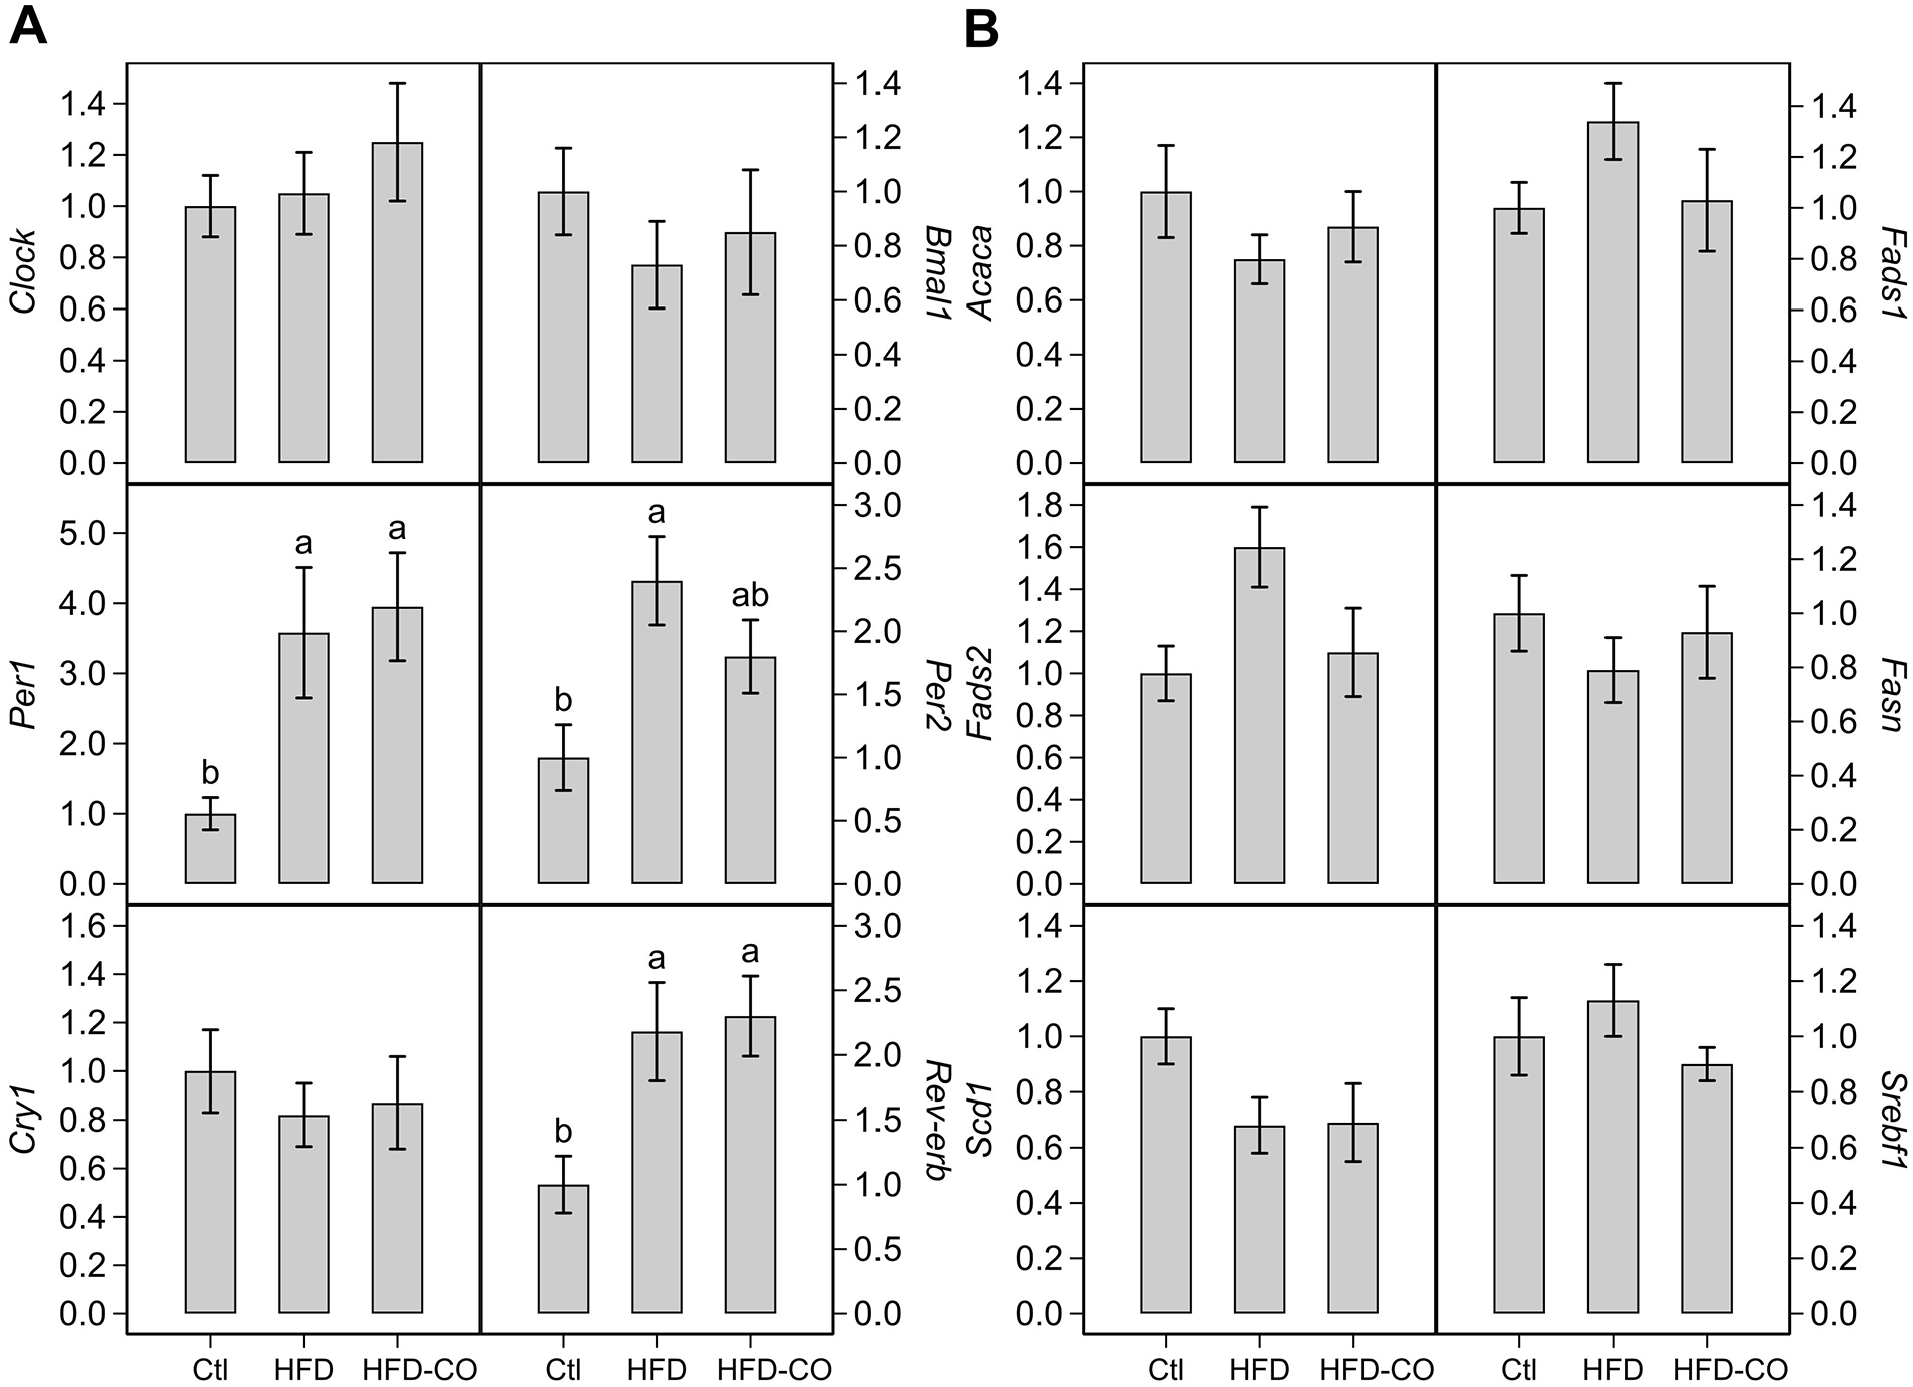
Changes in hepatic transcription of genes encoding circadian rhythm (A) and fatty acid metabolism (B) in mice fed the control diet (Ctl), high-fat diet (HFD), or chromista oil-containing HFD (HFD-CO). Results are means ± SEM (n = 12 per group, P ⩽ .05 for different letters in each panel).
Hepatic metabolomes
A total of 160 analytes were detected by GC-TOF-MS (Supplemental Table 1). Among them, 87 analyte ion peak heights were ⩾0.02% of the total signal intensity and were considered to be metabolites or common intermediates of mammalian metabolism.32,33 These metabolites were used for metabolomic and statistical analyses. Based upon their metabolic functions, these metabolites were categorised into 4 groups related to amino acid (Table 5), energy (Table 6), lipid (Table 7), and nucleotide and vitamin metabolism (Table 8).
Hepatic metabolites related to amino acid metabolism from mice fed the control diet, high-fat diet (HFD) or chromista oil-containing HFD (HFD-CO).
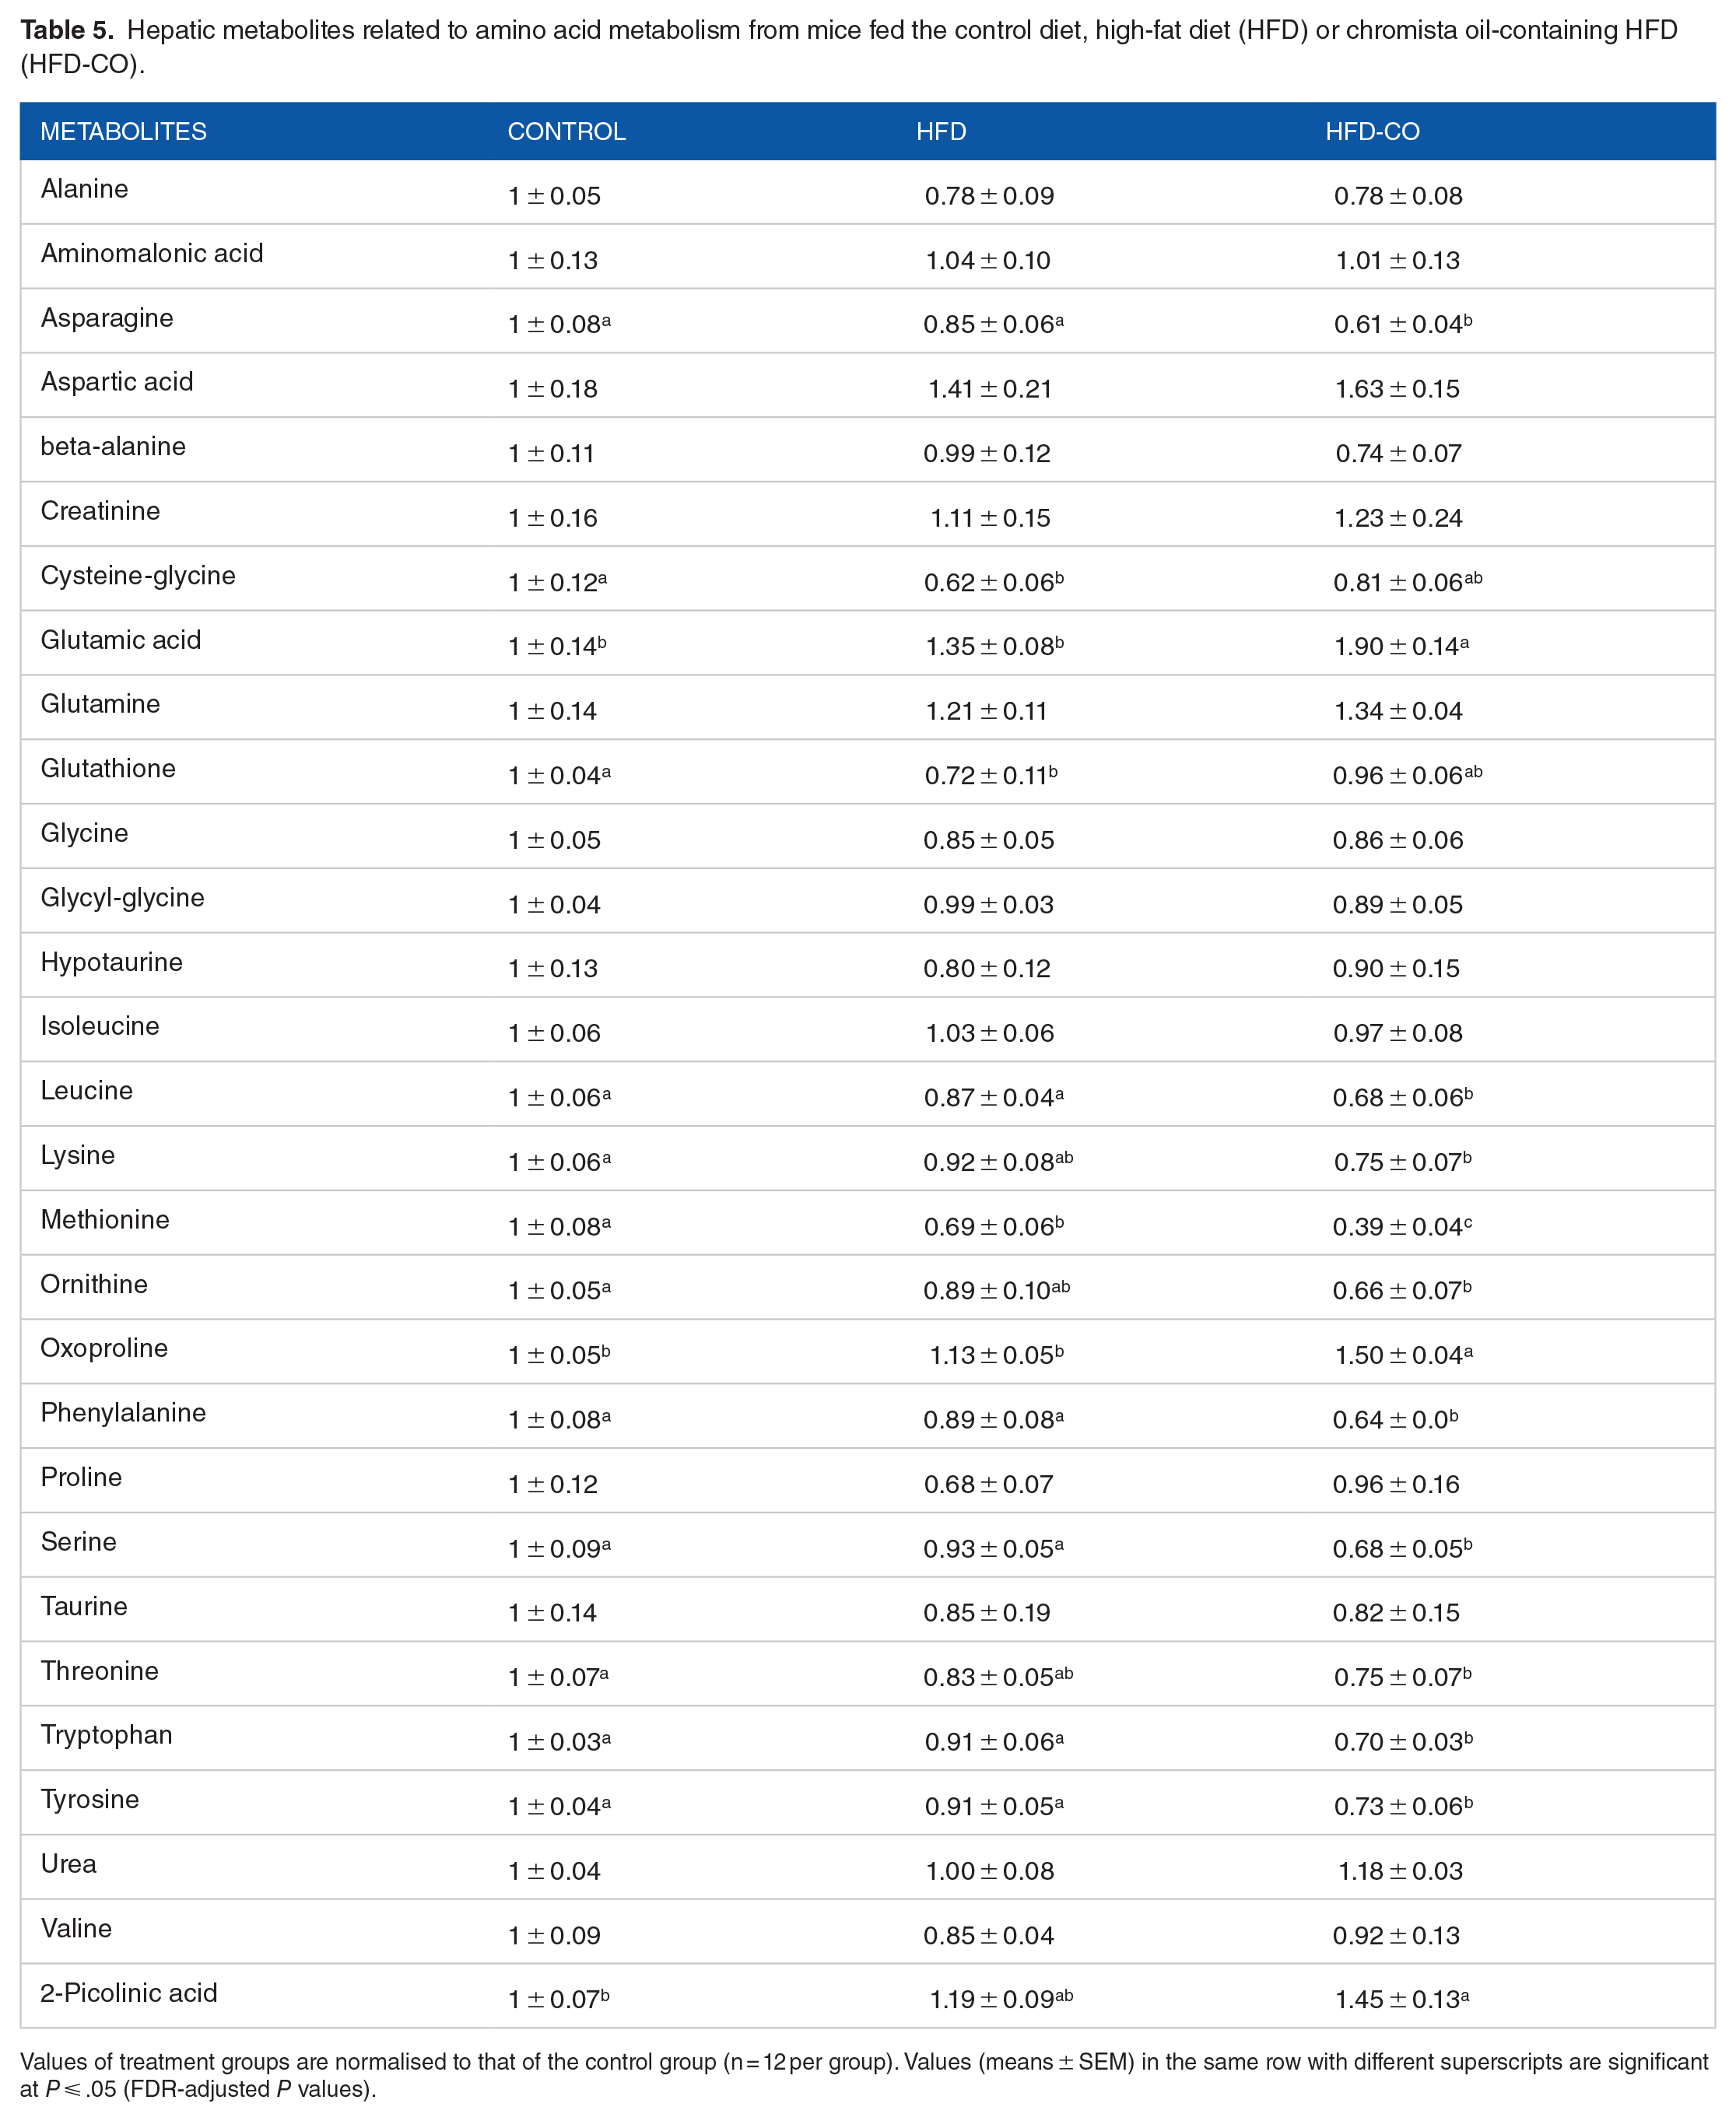
Values of treatment groups are normalised to that of the control group (n = 12 per group). Values (means ± SEM) in the same row with different superscripts are significant at P ⩽ .05 (FDR-adjusted P values).
Hepatic metabolites related to energy metabolism from mice fed the control diet, high-fat diet (HFD), or chromista oil-containing HFD (HFD-CO).

Values of treatment groups are normalised to that of the control group (n = 12 per group). Values (means ± SEM) in the same row with different superscripts are significant at P ⩽ .05 (FDR-adjusted P values).
Hepatic metabolites related to lipid metabolism from mice fed the control diet, high-fat diet (HFD), or chromista oil-containing HFD (HFD-CO).

Values of treatment groups are normalised to that of the control group (n = 12 per group). Values (means ± SEM) in the same row with different superscripts are significant at P ⩽ .05 (FDR-adjusted P values).
Hepatic metabolites related to nucleotide and vitamin metabolism from mice fed the control diet, high-fat diet (HFD), or chromista oil-containing HFD (HFD-CO).
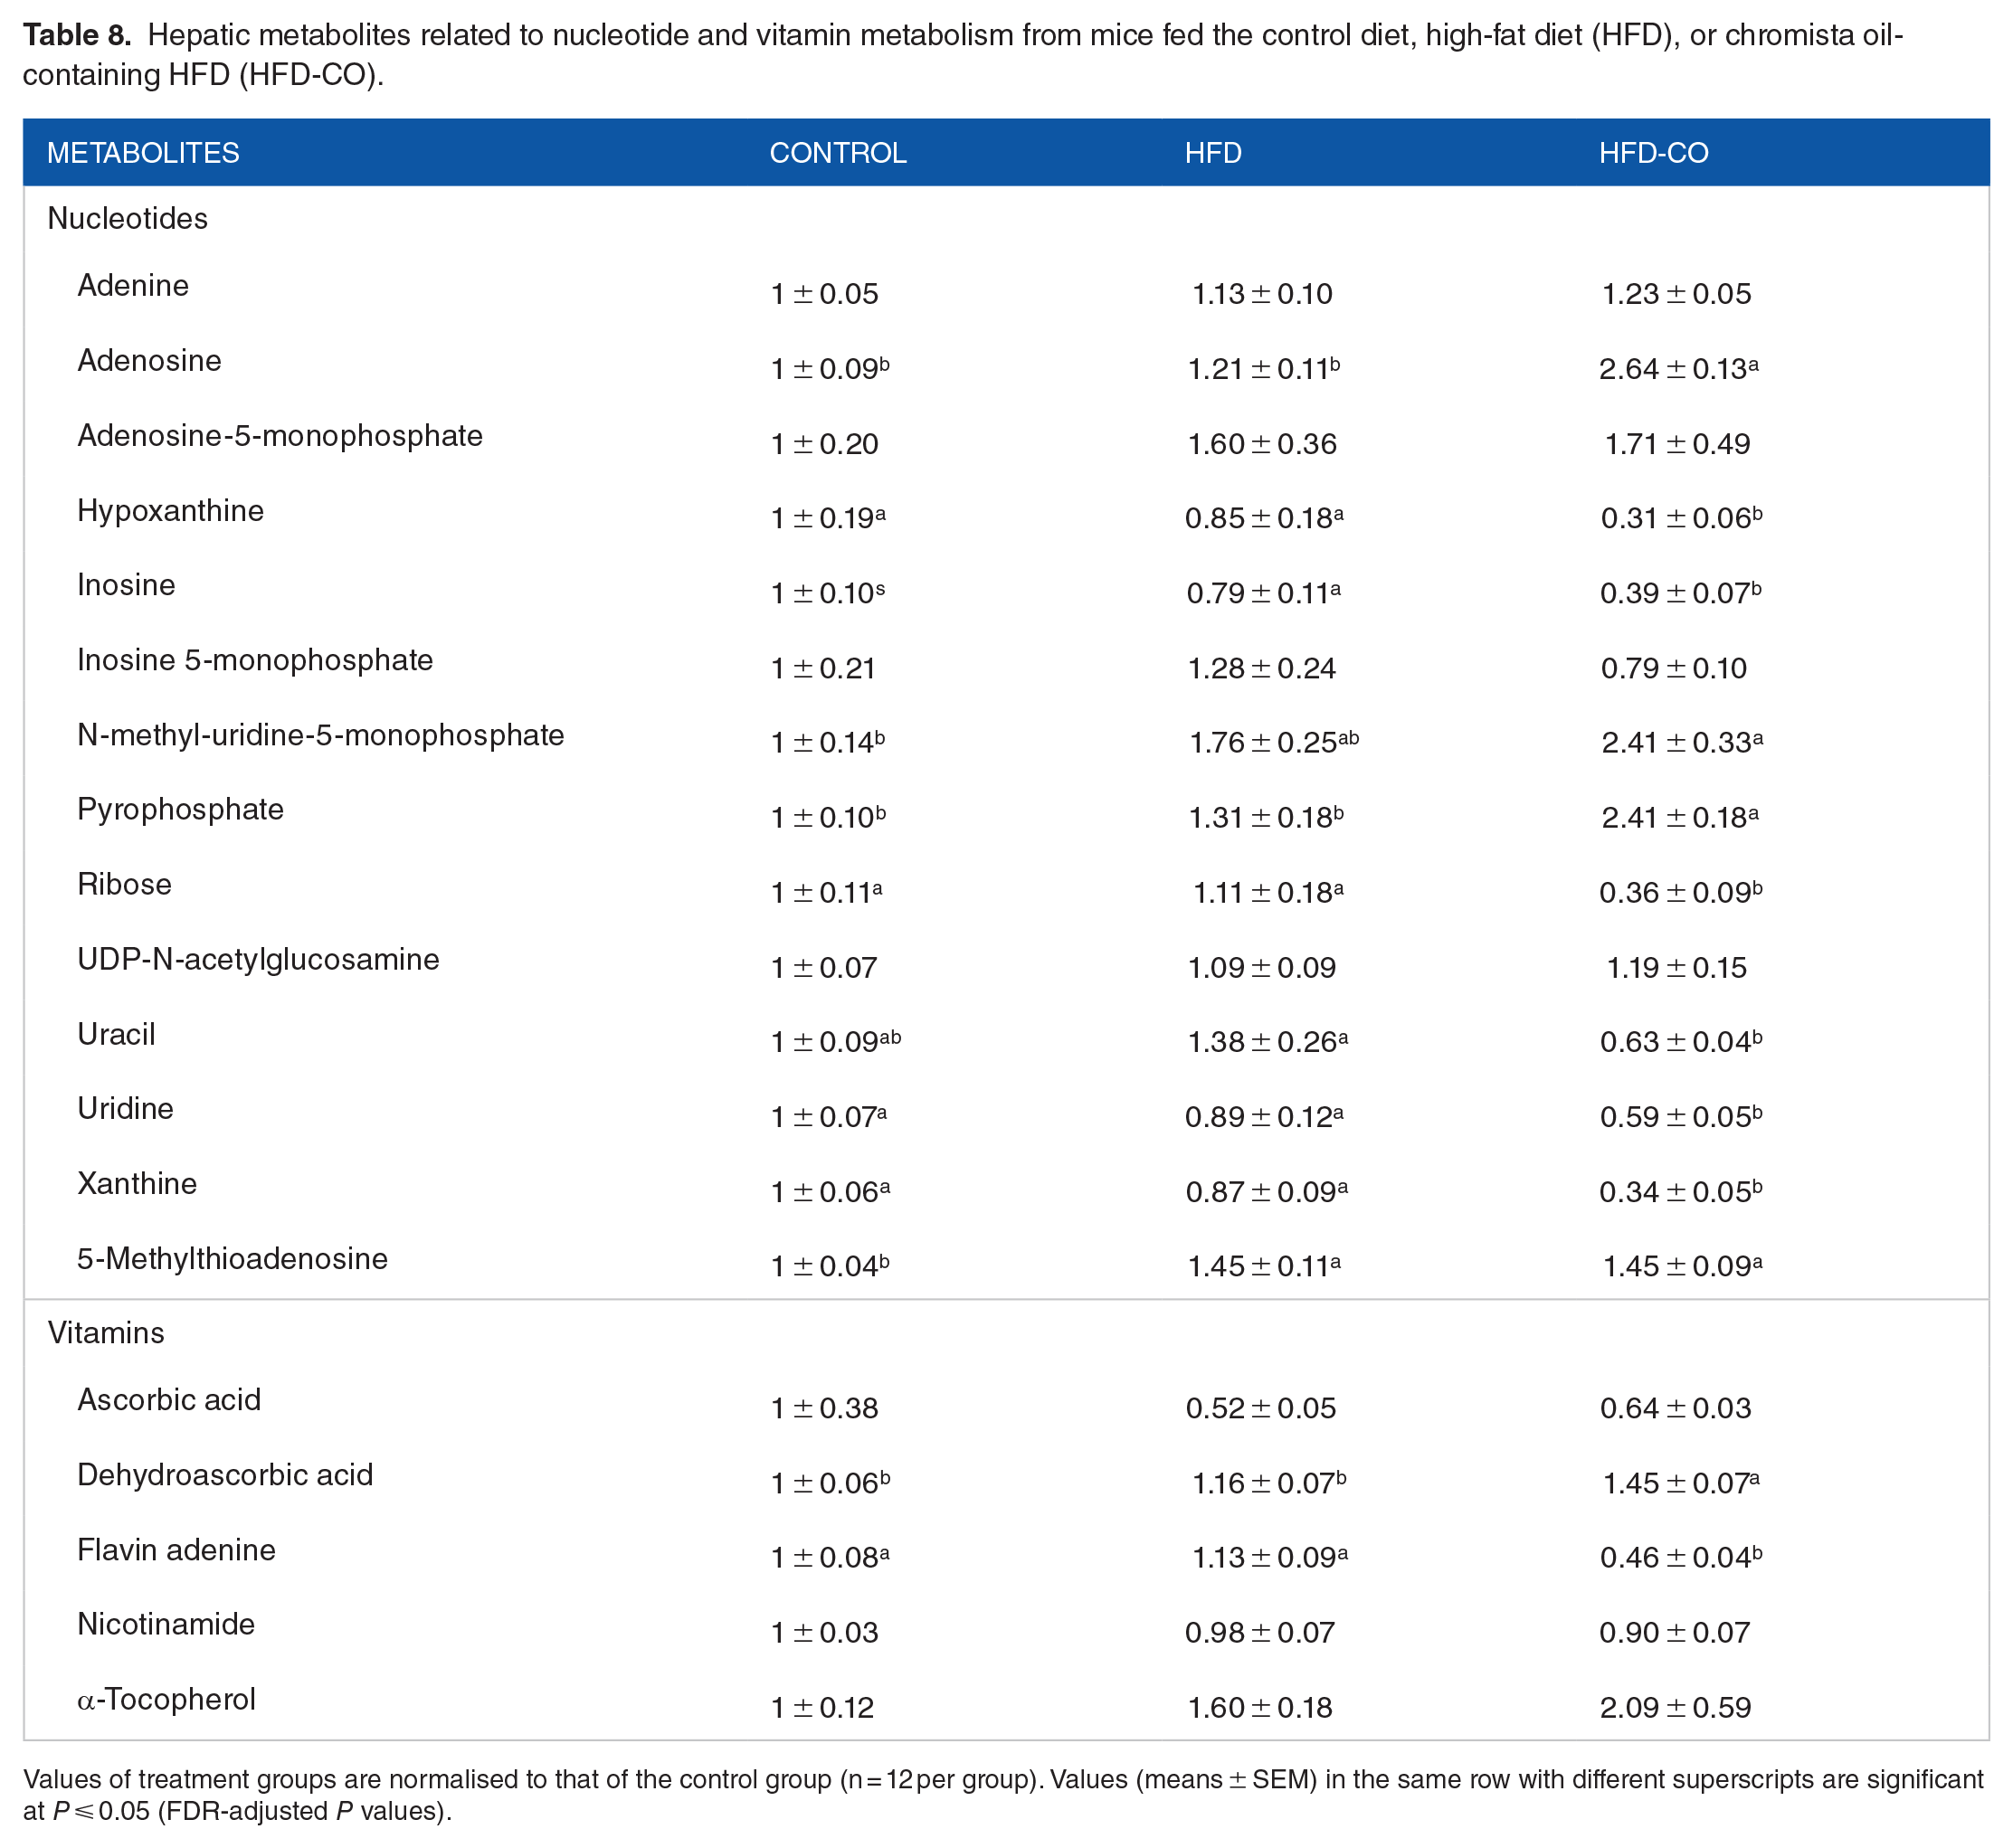
Values of treatment groups are normalised to that of the control group (n = 12 per group). Values (means ± SEM) in the same row with different superscripts are significant at P ⩽ 0.05 (FDR-adjusted P values).
The heatmap of hierarchical clustering showed the 25 most differentiating metabolites in liver and grouped these metabolites into 3 clusters (Figure 3). Cluster 1 was characterised by elevated responses of 12 metabolites in the chromista group compared to the control and HFD groups. These metabolites included cholesterol, malic acid, fumaric acid, inositol-4-monophosphate, dehydroascorbic acid, glucuronic acid, glutamic acid, adenosine, succinic acid, pyrophosphate, oxoproline and glycerol-α-phosphate. Arachidonic acid, glycerol, oleic acid and flavin adenine, which comprised cluster 2, were greater in the HFD group than in the control and chromista groups. Thirteen metabolites were lower in the chromista group; nine of which were represented in cluster 3 (mannose, palmitoleic acid, methionine, inosine, maltotiose, linoleic acid, tryptophan, xanthine and maltose) and with 4 in cluster 2 (arachidonic acid, glycerol, oleic acid and flavin adenine) (Figure 3).

Heatmap of the 25 metabolites in liver that are the most significantly differentiated among the 3 groups fed the control diet, high-fat diet (HFD), or chromista oil-containing HFD (HFD-CO) (n = 12 per group, FDR corrected P ⩽ .05). Each square is the mean of 12 samples. Colour codes: blue, weaker signal strength; dark-red, greater signal strength.
The sparse partial least square-discriminant analysis showed separation of the 3 dietary groups (Figure 4A). Component 1, representing 30.7% of the explained variance, showed the separation of the chromista group from the control and HFD groups. Component 2 showed separation of the HFD group from the control and chromista groups.
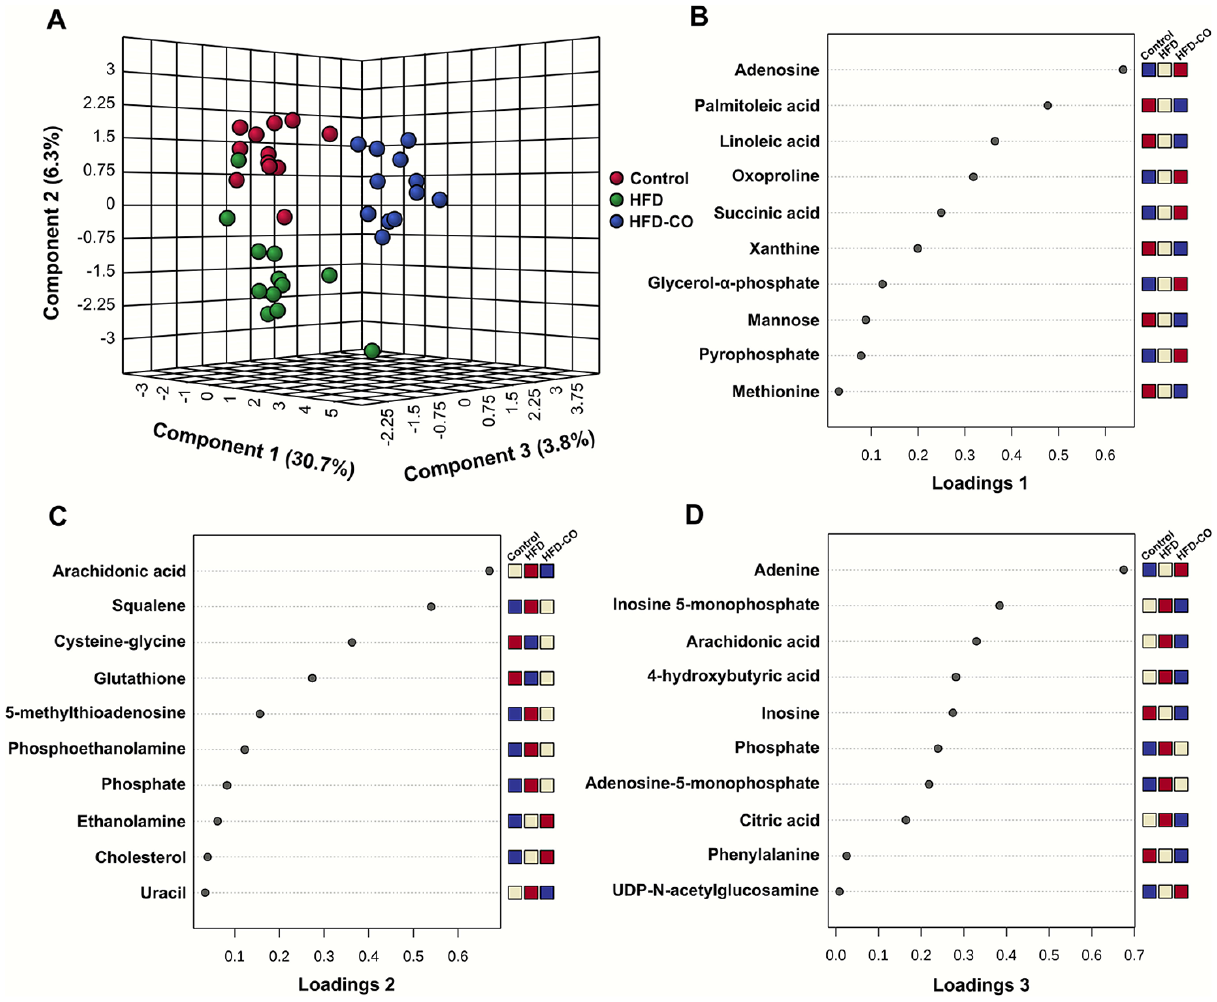
Sparse partial least squares discriminant analysis (sPLS-DA) of identified metabolites in liver from mice fed the control diet, high-fat diet (HFD), or chromista oil-containing HFD (HFD-CO) (A). Loadings plots 1 (B), 2 (C) and 3 (D) represent the 10 metabolites that are the most influential in treatment separation for components 1, 2 and 3, respectively, of the sPLS-DA scores plot (n = 12 per group).
The major determinants of separation for component 1, as shown in loadings plot 1 (Figure 4B), were metabolites related to energy metabolism (succinic acid, glycerol-α-phosphate and mannose), nucleotide metabolites (adenosine, xanthine and pyrophosphate), lipid metabolites palmitoleic acid and linoleic acid, and amino acid metabolites oxoproline and methionine. Lipid metabolites (arachidonic acid, squalene, phosphoethanolamine, phosphate, ethanolamine and cholesterol) predominated the loadings plot of component 2, with the energy metabolite glutathione, the amino acid metabolite cysteine-glycine, and nucleotide metabolites 5-methyl-thioadenosine and uracil, also major determinants of separation (Figure 4C). Nucleotide metabolites (adenine, inosine-5-monophosphate, inosine, adenosine-5-monophosphate and UDP-N-acetylglucosamine), lipid metabolites (arachidonic acid, 4-hydroxybutyric acid and phosphate), the energy metabolite citric acid, and amino acid phenylalanine evoked differentiation in the loadings plot of component 3 (Figure 4D).
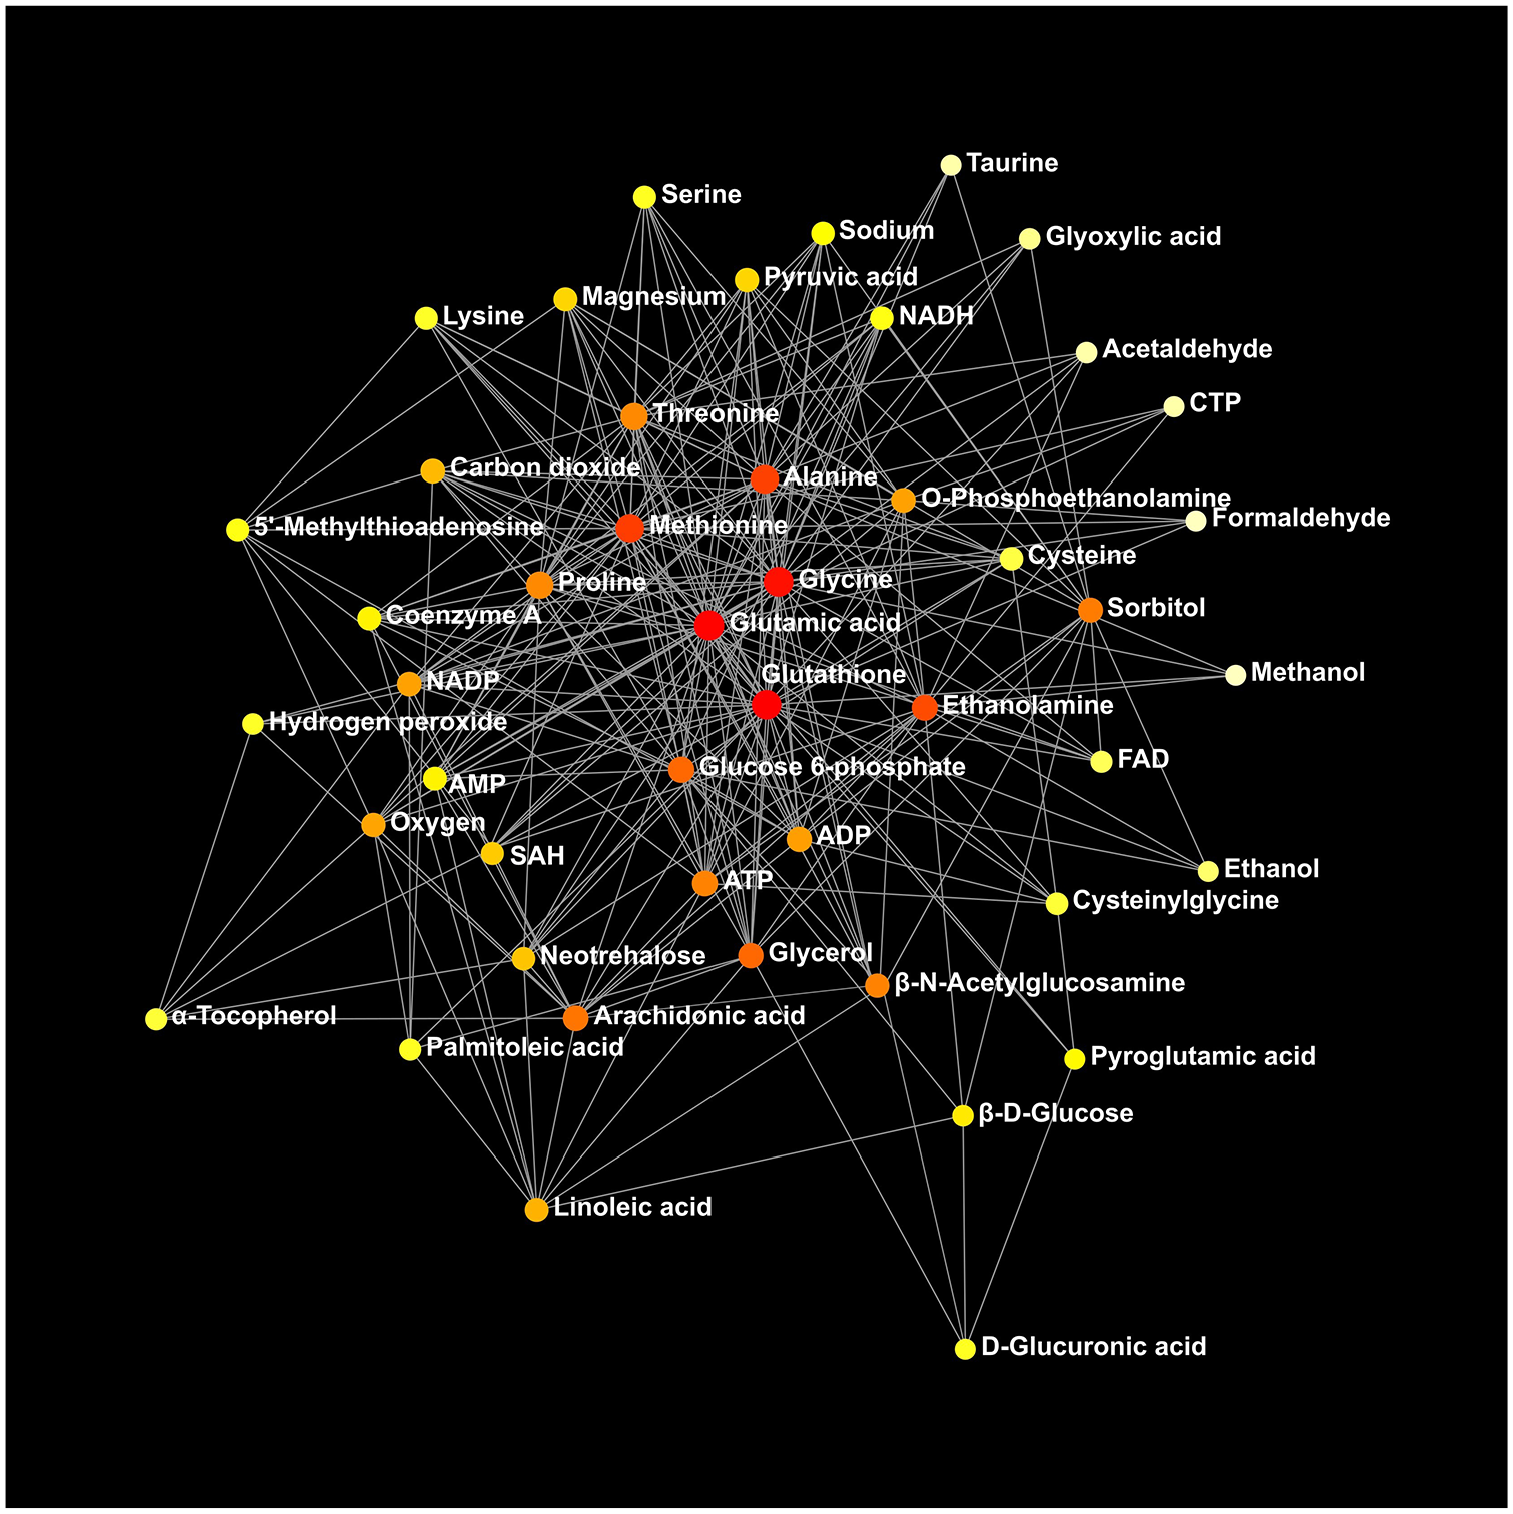
Thirty-three metabolic pathways were identified comparing the HFD group to the control group by the network analysis (Supplemental Table 2). Significant alterations in the aminoacyl-tRNA-biosynthesis pathways and the glutathione metabolism pathway were apparent between the 2 groups (Table 9). Thirty-six metabolic pathways were identified when the chromista group was compared to the HFD group (Supplemental Table 3). The aminoacyl-tRNA-biosynthesis pathways were altered significantly between the 2 groups (Table 9). Functional relationships of the metabolites between the HFD and control groups and between the chromista and HFD groups are presented in Figures 5 and 6, respectively.
Network enrichment pathways identified by the KEGG global network analysis that are significantly altered by the high-fat diet (HFD) or the chromista oil containing HFD (HFD-CO).

Number of identified metabolites that match to pathway metabolites.
FDR-adjusted P values.
Functional relationships of the identified metabolites when comparing the high-fat diet group to the control group (n = 12 per group). Colour codes: white-yellow, weaker impact; red, greater impact. Network statistics for the analysis are in Supplemental Table 2.

Functional relationships of the identified metabolites when comparing the chromista oil-containing high-fat diet group to the high-fat diet group (n = 12 per group). Colour codes: white-yellow, weaker impact; red, greater impact. Network statistics for the analysis are in Supplemental Table 3.
Discussion
Whether carbohydrate or fat is primarily being utilised for energy is indicated by the RER with a value of near 1.0 indicating that carbohydrates predominate and a value near 0.7 indicating that fatty acids predominate. The oscillation of RER between light and dark phases as shown by the control mice in this study demonstrates the metabolic flexibility to which mice adapt substrate utilisation to fed and fasting conditions. Feeding a HFD has been shown to impair metabolic flexibility,18,36 which was also demonstrated in the present study. Adding chromista oil to the HFD did not alter the flattened diurnal oscillations of RER induced by the HFD, which indicates that chromista oil was unable to correct the metabolic inflexibility caused by the HFD.
Mice fed either the HFD were heavier than mice fed the control diet. However, their caloric intake and energy expenditure were similar to those of the control mice. This lack of consistency can be explained by that both HFDs were energy-dense diets (48% of energy from fat vs. 16% of energy from fat for the control diet). Mice fed the HFD ate less. However, because of the high energy density of their diets, they had very similar caloric intake to the control mice. Furthermore, HFD-fed mice exhibited greater feed efficiency and were less physically active in the dark phase (active phase for nocturnal rodents). Both contributed to their accelerated weight gain. The control diet used in this study conformed to the AIN93G formulation, which is a standard formulation for rodent growth and maintenance 20 . The growth and metabolic performance of control mice in this study were consistent with previous reports using mice fed the AIN93G diet.18,36,37 Thus, mice fed the control diet in this study was a valid comparison to study metabolic inflexibility of mice fed the HFD.
Plasma insulin concentration was doubled in mice fed the chromista HFD, which coincided with the elevation of HOMA-IR score. These findings conform with the report that fish oil increases glucose-stimulated insulin secretion. 38 Long-chain n-3 PUFA from fish oil have been hypothesised to improve glucose tolerance through mechanisms that include reduced inflammation, induction of incretin hormones, and direct stimulation of insulin secretion in beta cells. 39 In contrast, we previously found that a HFD based on fish oil reduced fasting plasma insulin. 18 A possible explanation for this contrast is experimental differences including the type and quantity of dietary fat tested and the age and the status of body fat mass of mice when the experimental feeding was initiated. For example, fish oil providing 35% of energy (34.5 g DHA/kg diet) was used in the aforementioned study 18 whereas chromista oil providing 1.45% of energy (8.76 g DHA/kg diet) was used in the present study. However, the finding of no significant difference in blood glucose between the 2 HFD groups does not support the hypothesis that n-3 PUFA increase insulin sensitivity. It indicates that n-3 PUFA from chromista oil are unable to improve insulin sensitivity in mice with excess adiposity. Moreover, the lack of diurnal oscillations of RER in the chromista group indicates that chromista oil is unable to mitigate HFD-induced metabolic inflexibility. Taken together, these results contribute to the conclusion that chromista oil at the level tested in this study is insufficient to overcome the overwhelming suppressive effects of the HFD-induced excess adiposity on metabolic flexibility.
The elevation of plasma adiponectin concentration in the chromista group compared to the HFD group supports previous findings that dietary fish oil attenuates inflammation. 8 Our results also agree with previous reports that dietary oils of marine origin elevate adiponectin in rodent models of obesity.18,40 Adiponectin, its concentration ordinarily inversely related to adipose mass,41,42 is an anti-inflammatory cytokine with insulin stimulating and sensitising effects.43,44 The increased adiponectin resulting from chromista oil consumption was not accompanied by a decreased body fat mass in this study. Furthermore, the chromista oil did not ameliorate glucose intolerance even with the dramatic increase in insulin, presumably stimulated by the increase in adiponectin. In fact, insulin resistance as indicated by HOMA-IR score was nearly doubled in mice fed the chromista HFD, because of the elevated insulin while glucose was unaffected. Previous work found that while fish oil-enriched HFD induced body fat mass, it did mitigate insulin resistance in mice.45,46 Thus, our work highlights the difficulty in overcoming insulin resistance after excess adiposity has been established. Further investigation is needed to determine whether increasing adiponectin through increasing dietary chromista oil consumption can reverse glucose intolerance in mice with excess adiposity.
The lack of differences in circadian transcript expression between the 2 HFD groups indicated that consumption of chromista oil does not affect the HFD-induced circadian alteration in liver. The alteration of circadian rhythms in peripheral organs, including liver, by a HFD has been established in laboratory rodents.47 -49 Like mice fed the HFD, elevated transcription of Per1, Per2 and Rev-Erb occurred in mice fed the chromista HFD. The elevated gene transcription, together with increased plasma insulin, found in chromista HFD-fed mice, is consistent with previous reports showing that a fish oil containing diet increases hepatic expression of Per2 and blood insulin concentrations in mice. 15 Interestingly, the reported increases in both Per2 expression and plasma insulin parallel with a large phase delay of Per2 oscillations in liver, suggesting that the fish oil diet may have altered the rhythmic expression of Per2. 15 Circadian alteration by dietary chromista oil was not an objective of the present study. However, in a short-term, 3-week feeding study, we found that a HFD resulted in phase delay of the rhythmic expression of both Per1 and Per2 in liver of pubertal mice. 49 Thus, the regulatory roles of chromista oil, including its active components n-3 PUFA, in circadian rhythms at both central hypothalamic and peripheral levels and their metabolic impact remain an interest for further investigation.
Transcription of genes encoding fatty acid metabolism remained similar between 2 HFD groups; the decreases found in the transcription of Fads1, Fads2 and Srebf1 in chromista HFD-fed mice were not significant. The lack of significant findings is consistent with reports that fish oil does not alter the expression of genes regulating fatty acid metabolism in mice fed a HFD.50,51
The network analysis showed that the aminoacyl-tRNA-biosynthesis pathways were altered by both the HFDs. Aminoacyl-tRNA synthetases are enzymes essential in esterification of a tRNA to its cognate amino acid in protein synthesis. 52 The HFD alteration is consistent with a recent report that a HFD alters aminoacyl-tRNA biosynthesis pathways in mammary glands of pubertal mice. 53 The finding that dietary chromista oil further altered the pathways by decreasing the signals of 7 amino acid metabolites (asparagine, leucine, methionine, phenylalanine, serine, tryptophan and tyrosine) and increasing 2 metabolites (glutamic acid and oxoproline) indicates that chromista oil may alter amino acid metabolism in mice with excess adiposity. Dysregulation of amino acid metabolism in impaired glucose homeostasis elevates circulating amino acids, including branched chain amino acids, phenylalanine and tyrosine.54,55 Insulin resistance and mitochondrial dysfunction are inextricably linked. 56 Perhaps, the chromista oil-enhanced hepatic insulin resistance, which is indicated by the elevated HOMA-IR score, is partly responsible for the altered amino acid metabolism in mice with excess fat mass.
The glutathione metabolism pathway is the second metabolic pathway that was altered by the HFD. The HFD decreased signals of both glutathione and its metabolite cysteine-glycine. Glutathione is a tripeptide of glutamate, cysteine and glycine. In glutathione metabolism, glutamate is removed from glutathione to yield cysteine-glycine, 57 which enhances antioxidant capacity. 58 A HFD has been found to downregulate glutathione metabolism in mice. 59 In this study, there were no significant differences in the glutathione metabolism pathway and signals of glutathione and cysteine-glycine when the chromista HFD group was compared to the HFD group. It suggests that chromista oil, at the dietary level tested, does not affect glutathione metabolism altered by the HFD or that it acts similarly in mice with excess adiposity.
Consumption of chromista oil in mice fed a HFD affected metabolites associated with energy metabolism. Signals from intermediates of glycolysis (eg, glycerol-α-phosphate) and the citrate cycle (eg, succinic acid) were elevated in chromista HFD-fed mice compared to those fed the HFD. In contrast, maltose, maltotriose and mannose were substantially downregulated in chromista HFD-fed mice. Maltose and maltotriose are saccharides containing two and three glucose molecules, respectively. Both are digestive products of amylose in starch. Mannose, a monomer of aldohexose, glycosylates proteins for cell signalling and recognition. 60 The changes in metabolites of energy metabolism in the present study suggest that mice with excess adiposity may have increased metabolic needs when they were fed the chromista HFD. This suggestion is supported by the elevated signals from adenosine (a nucleotide) and pyrophosphate in chromista HFD-fed mice. Adenosine provides chemical energy in the form of adenosine triphosphate (ATP) for many cellular functions that demand energy; the release of energy occurs with the hydrolysis of ATP to adenosine monophosphate (AMP) and pyrophosphate.
Significant increases in plasma total and HDL cholesterols and liver triacylglycerol occurred in mice fed either the HFD compared to the control mice. These findings are consistent with previous research in rodents fed a HFD36,61 and with human studies that obesity increases cholesterol and triacylglycerol in blood.62,63 These increases likely can be attributed to a higher dietary fat intake rather than an elevated de novo lipid biosynthesis. This likelihood is supported by the finding of no significant differences in transcription of genes encoding fatty acid metabolism among the 3 groups. However, signals from unsaturated fatty acids were diminished while signals from saturated fatty acids were not affected by the chromista oil feeding. The finding of changes in unsaturated fatty acids is consistent with an early report that n-6 fatty acid contents were lower in mice consuming a fish oil-based HFD 64 and suggests that chromista oil might attenuate de novo lipogenesis in mice with excess fat mass. Furthermore, the lack of difference in plasma HDL cholesterol between the 2 HFD groups suggests that chromista oil at the level tested in this study does not affect HDL cholesterol metabolism in mice with excess adiposity.
The ethanolamine signal was spectacularly higher in mice fed either the HFD. Ethanolamine is a naturally occurring compound containing a primary amine and a primary alcohol. Its derivative phospholipids are constituents of biological membranes. A recent study has shown that the relative abundance of gut bacteria, which metabolises ethanolamine, is diminished in obesity while gut permeability is increased. 65 Unmetabolised ethanolamine from the gut reaching liver may be the reason for the extraordinary amounts found in mice with excess fat mass and for intake of chromista oil not preventing the elevated hepatic ethanolamine.
We found increased adenosine and pyrophosphate and decreased hypoxanthine, inosine, ribose, uracil, uridine and xanthine in mice fed the chromista HFD. These changes indicate that consumption of chromista oil may have altered nucleotide metabolism. Adenosine is a glycosylated purine consisting of an adenine and a ribose. A common purine breakdown product is xanthine. Also, when a nucleotide is incorporated into a growing DNA or RNA, ATP is hydrolysed to AMP and pyrophosphate to provide needed energy for the incorporation. Thus, the changes in signals of nucleotide metabolism indicate that chromista oil might have increased adenosine formation, decreased purine breakdown or both in mice with excess fat mass.
In summary, feeding the chromista oil containing HFD to mice with excess adiposity did not affect body adiposity, body weight, feed efficiency, RER, energy intake, total and HDL cholesterols in plasma, triacylglycerols in liver and transcription of genes encoding circadian rhythm and fatty acid metabolism when compared to the HFD. Thus, chromista oil, at the dietary level tested in this study, is unable to mitigate the HFD-induced metabolic inflexibility in mice with excess adiposity. Increases in plasma insulin and adiponectin by the chromista oil feeding suggests that chromista oil may be anti-inflammatory, but the insulin sensitising effect of adiponectin is unable to overcome the overall suppressive effects that a HFD and excess adiposity have on insulin sensitivity. Untargeted metabolomic analysis found significant differences in metabolomic profiles with substantial alterations in amino acid metabolism between mice fed the HFD with and without chromista oil. Targeted metabolomic analysis and investigations on mechanisms underlying the alterations in metabolomic profiles are warranted to fully elucidate the role of chromista oil, including its active components n-3 PUFA, on metabolism in models of obesity.
Supplemental Material
sj-xlsx-1-nmi-10.1177_11786388241297143 – Supplemental material for Dietary Intake of Chromista Oil Alters Hepatic Metabolomic Profile of Mice With Excess Fat Mass
Supplemental material, sj-xlsx-1-nmi-10.1177_11786388241297143 for Dietary Intake of Chromista Oil Alters Hepatic Metabolomic Profile of Mice With Excess Fat Mass by Bret M Rust, Forrest H Nielsen and Lin Yan in Nutrition and Metabolic Insights
Supplemental Material
sj-xlsx-2-nmi-10.1177_11786388241297143 – Supplemental material for Dietary Intake of Chromista Oil Alters Hepatic Metabolomic Profile of Mice With Excess Fat Mass
Supplemental material, sj-xlsx-2-nmi-10.1177_11786388241297143 for Dietary Intake of Chromista Oil Alters Hepatic Metabolomic Profile of Mice With Excess Fat Mass by Bret M Rust, Forrest H Nielsen and Lin Yan in Nutrition and Metabolic Insights
Supplemental Material
sj-xlsx-3-nmi-10.1177_11786388241297143 – Supplemental material for Dietary Intake of Chromista Oil Alters Hepatic Metabolomic Profile of Mice With Excess Fat Mass
Supplemental material, sj-xlsx-3-nmi-10.1177_11786388241297143 for Dietary Intake of Chromista Oil Alters Hepatic Metabolomic Profile of Mice With Excess Fat Mass by Bret M Rust, Forrest H Nielsen and Lin Yan in Nutrition and Metabolic Insights
Footnotes
Acknowledgements
The authors wish to thank Dr. Matthew Picklo for input in study conceptualisation, Dr. Kathleen Yeater and Daniel Palmer for assistance in statistical analyses, James Lindlauf for diet design and manuscript revisions, Jack He, Laura Idso and Joseph Idso for technical support, nutrition analytical laboratory staff for quantifying fatty acid contents of chromista oil, and vivarium staff for diet preparation and animal care. USDA is an equal opportunity provider and employer. Mention of trade names or commercial products in this publication is solely for the purpose of providing specific information and does not imply recommendation or endorsement by the USDA.
Author Contributions
Conceptualisation, methodology and investigation, LY; data curation and formal analysis, LY BMR; writing – original draft and review & editing, LY, BMR and FHN; supervision, LY; funding acquisition LY. All authors approved final draft for publication.
Funding:
The author(s) disclosed receipt of the following financial support for the research, authorship, and/or publication of this article: The USDA Agricultural Research Service funded this research (Project #3062-51000-056-00D).
Declaration Of Conflicting Interests:
The author(s) declared no potential conflicts of interest with respect to the research, authorship, and/or publication of this article.
Ethics Statement
The Institutional Animal Care and Use Committee of the Grand Forks Human Nutrition Research Center approved this study.
Supplemental material
Supplemental material for this article is available online.
References
Supplementary Material
Please find the following supplemental material available below.
For Open Access articles published under a Creative Commons License, all supplemental material carries the same license as the article it is associated with.
For non-Open Access articles published, all supplemental material carries a non-exclusive license, and permission requests for re-use of supplemental material or any part of supplemental material shall be sent directly to the copyright owner as specified in the copyright notice associated with the article.