
Abstract
Background
In modern diets, alcohol consumption has led to an increase in the number of cases of alcohol-related liver disease (ALD). Dihydromyricetin (DMY) is commonly used as a hepatoprotective agent owing to its remarkable efficacy in treating chronic alcoholic liver injury; however, its mechanism of action is unclear. The object of the study is to investigate the effect and mechanism of DMY in alleviating chronic ALD.
Methods
A mouse model of chronic ALD was established. Mice were treated with DMY for 56 days, and their biochemical parameters including liver function, blood lipids, and oxidative stress-related indices were measured. Farnesoid X receptor (FXR) expression, NOD-like receptor protein 3 (NLRP3) pathway-related protein expression, and inflammation-related gene expression were determined to elucidate the mechanism of DMY in mice with ALD. Lastly, serum and liver metabolomics-based UHPLC-Orbitrap Exploris MS analyses were used to determine the influence of the metabolism of DMY on mice with ALD.
Results
Pharmacodynamic studies showed that DMY could decrease aspartate transaminase, alanine transaminase, triglyceride, and low-density lipoprotein cholesterol levels, improve superoxide dismutase activity, and reduce inflammation in mice with ALD. DMY treatment protects the liver by increasing FXR protein expression and by decreasing NLRP3 pathway-related protein expression and inflammatory gene expression. Metabolomics analysis indicated that ethanol treatment mainly altered metabolism in mice. DMY could regulate 10 metabolites in serum, namely, N-α-acetyllysine, 1-pyrrolinecytosine, glutamyllysine, 5-methylcytosine, N-methylvaline, pyridoxamine, demethoxycurcumin, L-arginine, triacetin, and 15-methylpalmitate. It could also regulate 31 metabolites in the liver, including L-methionine and L-leucine. DMY treatment altered the following important pathways: valine, leucine, and isoleucine biosynthesis; cysteine and methionine metabolism; and valine, leucine, and isoleucine degradation. Correlation analyses using heatmaps revealed that the metabolic parameters are closely related to the pharmacodynamic index.
Conclusion
These findings indicated that DMY alleviated ALD by regulating the FXR-NLRP3 signaling pathway and could treat serum and liver metabolic disorders.
Highlights
Dihydromyricetin (DMY) could relieve chronic alcoholic liver injury.
DMY regulated the Farnesoid X receptor-NOD-like receptor protein 3 pathway to relieve chronic alcoholic liver injury.
DMY could regulate 10 metabolites in serum and 31 liver metabolites.
DMY ameliorated serum and liver metabolic disturbances.
Introduction
There are 3.3 million deaths globally due to chronic alcohol consumption.1,2 Chronic alcohol consumption can cause alcohol-related liver damage (ALD). The consequences of alcohol abuse include alcoholic hepatitis, liver fibrosis, cirrhosis, and liver cancer. 3 Several factors contribute to the progression of ALD, including the amount and duration of alcohol abuse, age, gender, ethnicity, comorbidities, and nutritional status. Traditional Chinese medicines (TCMs) contain diverse and numerous active biological ingredients that are beneficial for human health. TCM can thus be used to develop natural hepatoprotective products to prevent ALD. Therefore, it is necessary to identify natural food components with hepatoprotective effects.
Dihydromyricetin (DMY) is a flavonoid found in many plants in Asia such as vine tea and Hovenia acerba Lindl. Studies have shown that DMY protects the liver from pathogenic factors (drugs, ethanol, and hepatitis virus) capable of causing liver injury. Wang et al found that DMY could inhibit the MAPK signaling pathway to induce lipopolysaccharide-induced acute lung injury. 4 Another study reported that DMY inhibited inflammation in mice with carbon tetrachloride (CCl4)-induced acute liver injury via a Janus Kinase-dependent mechanism. 5 Additionally, DMY can improve CCl4-induced chronic liver injury and regulate pyroptosis in hepatocytes. 6 However, to the best of our knowledge, there is no report on the protective effects of DMY on ALD using a metabolomics approach. Moreover, there is a lack of understanding of the effects of DMY intervention on serum and liver metabolic disorders caused by excessive drinking as well as its possible mechanism of action.
Alcohol consumption is associated with metabolic alteration, which is one of the underlying mechanisms of its harmful effects. 7 Metabolomics is a high-throughput method that identifies metabolites as biological systems respond to environmental changes. Systemic metabolic profiling reveals metabolic changes. The metabolic profile of organs, tissues, or cells can be characterized using metabolomics by investigating the changes in metabolic profiles resulting from pathophysiological stimuli or genetic modifications. 8 As a source of massive endogenous metabolites, the metabolism of substances and energy production is primarily the function of the liver. ALD has been studied using metabolomics by identifying candidate biomarkers and determining the underlying mechanisms. 9 Nontargeted approaches to metabolomics are more likely to identify novel biomarkers than targeted approaches in metabolism.
Farnesoid X receptor (FXR) in the liver is a ligand-mediated transcription factor that contributes to the metabolism of bile acids, glucose, and the response to hepatotoxicity under stress. 10 When FXR is activated, liver injury is attenuated, and inflammatory cytokines are suppressed dramatically. 11 Studies show that FXR can regulate mitochondrial dysfunction, oxidative stress, and inflammation to prevent liver damage and that it has hepatoprotective effects. 12 Thus, activating FXR may be a therapeutic strategy to mitigate liver injury.
A mouse model of chronic alcoholic liver injury in the current research was established. Pharmacodynamic parameters including liver function, blood lipids, and other indicators were determined to explain the protective effect of DMY on ALD. Next, the FXR-NOD-like receptor protein (3NLRP3) signaling pathway and serum and liver metabolomics were combined to determine the mechanism of DMY in alleviating ALD.
Materials and Methods
Materials, Chemicals, and Reagents
Dihydromyricetin was purchased from Xi’an Quan’ao Biological Technology Co., Ltd Hongxing Erguotou wine (52% vol) was provided by Beijing Hongxing Erguotou Co., Ltd Bifendate pills were procured from Wanbangde Pharmaceutical Group Co., Ltd Nanjing Jiancheng Bioengineering Institute Co., Ltd provided the total cholesterol (TC), aspartate aminotransferase (AST), triglyceride (TG), low-density lipoprotein-cholesterol (LDL-C), alanine aminotransferase (ALT), and superoxide dismutase (SOD) assay kits. Bioswamp provided the mouse interleukin (IL)-18, IL-1β, and tumor necrosis factor (TNF)-α enzyme-linked immunosorbent assay (ELISA) kits. Formic acid, acetonitrile, and methanol were provided by CNW Technologies GmbH. Ultrapure water was purchased from Watsons. Ammonium acetate was supplied by Sigma-Aldrich. FXR mouse antibody (sc-25309) was purchased from Santa Cruz. NOD-like receptor protein 3 (NLRP3) rabbit antibody (1:1000, A14223) was purchased from ABclonal. Caspase1 (10/45, AF5418) was purchased from Affinity. Caspase1 (45, bs-0169R) was purchased from BIOSS. IL-1β (41059-2) and IL-18 (29566-2) were purchased from SAB. GAPDH rabbit antibody (1:1000, 10494-1-AP) was purchased from Proteintech.
Animal Experiments
Specific-pathogen-free (SPF) Kunming (KM) male mice weighing 18-22 g were used (China Liaoning Changsheng Biotechnology Co., Ltd; experimental animal production license number: SCXK (Liao)2020-0001). Mice were housed in an SPF laboratory (temperature 22 ± 2 °C; humidity 58% ± 2%, 12-h/12-h light/dark cycle), fed a sterilized diet, and provided access to sterilized tap water. The Institutional Review Board committee at Wuhan Myhalic Biotechnological Co., Ltd approved the animal experiments (HLK-20221008-001).
After 5 days of restriction-free nourishment, mice were randomly divided into the following 5 distinct groups: Control, Model, bifendate (8.775 mg/kg), dihydromyricetin high-dose (DMY-H, 375 mg/kg), and dihydromyricetin low-dose (DMY-L, 125 mg/kg) groups. All groups of mice, except the control group, received alcohol via gavage (Hongxing Erguotou wine, 52% vol) at a dose of 10 mL/kg. Mice in the control group received a gavage of saline, whereas mice in the bifendate, DMY-H, and DMY-L groups were administered the corresponding drugs by gavage for 8 weeks. 13
On day 56, mice were anesthetized by ether, and the blood was obtained by extirpating the eyeballs. Blood samples were centrifuged for 15 min to obtain serum (1000 ×g, 4 °C). After blood samples were extracted, the mice were sacrificed and their livers were collected. Liver tissue samples were fixed by immersion in 4% paraformaldehyde, dehydrated, embedded in paraffin, and stained with hematoxylin-eosin. Then, to prepare tissue homogenates, liver tissue samples were ground with saline in a 1:9 ratio (g/mL), and a biochemical analysis of the supernatant was conducted. Biochemical test kits were used to measure the levels of AST, ALT, TC, TG, and LDL-C in the liver. Serum IL-1β, TNF-α, and IL-18 levels were measured using the corresponding ELISA kits and following the manufacturers’ instructions.
The activities of betaine-homocysteine S-methyltransferase (BHMT), leucine transaminase (LT), leucine dehydrogenase (LDH), methionine synthase (MS), branched-chain amino-acid transaminase (BCAT), and homocysteine S-methyltransferase (HMT) in the liver were determined using ELISA kits (ShanghaiFusheng Industrial Co., Ltd).
Quantitative Polymerase Chain Reaction
RNA was isolated using RNAiso plus (TaKaRa), and subsequently, cDNA synthesis was performed using a cDNA synthesis kit (TOYOBO). The SYBR GREEN quantitative polymerase chain reaction (qPCR) mix (TOYOBO) was used for quantitative real-time PCR (qRT-PCR). A Bio-Rad CFX96 Real-Time PCR Detection System (Bio-Rad) was used for data acquisition. The 2−ΔΔCT method was used to obtain fold expression levels. The primer pairs for quantitative real-time PCR are listed in Table 1.
Primers for Quantitative Real-Time PCR.

Abbreviations: PCR, polymerase chain reaction; TNF, tumor necrosis factor; IL, interleukin.
Western Blotting
Western blotting was used to detect the expression of FXR, NLRP3, Caspase 1, cleaved Caspase 1, IL-18, IL-1β, and GAPDH. Liver tissues were lysed using lysis buffer (Beyotime) to obtain whole-protein extracts. Protein samples (20 mg) were separated using 10% sodium dodecyl sulfate–polyacrylamide gel electrophoresis and transferred to polyvinylidene fluoride membranes (Millipore). After blocking with 5% skimmed milk in Tris-buffered saline/Tween-20, the membranes were incubated overnight with the primary antibody at 4 °C and then incubated with the respective horseradish peroxidase–conjugated secondary antibodies for 1.5 h. The membranes were visualized using BeyoECL Plus regent (Beyotime Biotechnology). The results were analyzed using ImageJ.
Metabolomics Analysis
Preparation of Serum Samples
Samples (100 μL) were mixed with the extraction solution (methanol [MeOH]: acetonitrile [ACN], 1:1 (v/v), 400 μL) containing deuterated internal standards. The mixed solutions were vortexed for 30 s, sonicated in a water bath for 10 min at 4°C, and incubated for 1 h at −40°C to precipitate proteins. The samples were centrifuged at 13800 ×g for 15 min at 4°C, and the supernatant was transferred to a fresh glass vial for analysis.
Preparation of Liver Samples
Liver tissue samples of mice (25 mg ± 1 mg) were mixed with beads and extraction solution (MeOH:ACN:H2O, 2:2:1 [v/v], 500 μL) containing deuterated internal standards. The mixed solution was vortexed for 30 s. The subsequent procedures were the same as those listed in the preparation of serum samples section.
Liquid Chromatography With Tandem Mass Spectrometry (LC-MS/MS)
A UHPLC system was used for LC-MS/MS analyses (Vanquish, Thermo Fisher Scientific) with a Waters ACQUITY UPLC BEH amide column (2.1 mm × 50 mm, 1.7 μm) coupled to an Orbitrap Exploris 120 mass spectrometer (Orbitrap MS, Thermo). The autosampler temperature was 4°C and the injection volume was 2 μL. The mobile phase consisted of 25 mmol/L ammonium acetate and 25 mmol/L ammonium hydroxide in water (pH = 9.75) (A) and ACN (B). The Orbitrap Exploris 120 mass spectrometer was used for its ability to acquire MS/MS spectra in the information-dependent acquisition mode controlled by the acquisition software (Xcalibur, Thermo), which continuously evaluates the full scan MS spectrum. The electrospray ionization source conditions were as follows: sheath gas flow rate: 50 Arb; aux gas flow rate: 15 Arb; capillary temperature: 320°C; full MS resolution as 60 000; MS/MS resolution as 15 000; collision energy: SNCE 20/30/40; spray voltage: 3.8 kV (positive) or −3.4 kV (negative).
Data Preprocessing and Annotation
Raw data were converted to the mzXML format using ProteoWizard and processed with an in-house program, which was developed using R and was based on XCMS, for peak detection, extraction, alignment, and integration. An in-house MS/MS database (BiotreeDB from SHANGHAI BIOTREE BIOTECH CO., LTD) was used for metabolite annotation.
Statistical Analysis
SPSS 22.0 was used for statistical analysis. Data were analyzed using one-way analysis of variance and the results are presented as mean ± standard error of the mean. A P value of .05 indicated significant differences.
Results
Effect of DMY on Liver Function, Blood-Lipid Indices, and Oxidative Stress Indices in Mice
The protective effects of DMY on chronic alcoholic liver injury were studied by determining the liver function, blood lipids, and oxidative stress indices of mice. The levels of AST, ALT, TC, TG, and LDL-C were significantly increased and SOD activity was significantly decreased in mice in the model group compared with those in the control group (Figure 1, P < .05 and P < .01). Low and high doses of DMY significantly decreased AST, TG, and LDL-C levels (P < .05 and P < .01) and increased SOD activity (P < .01). DMY-H could also decrease ALT levels (P < .05).
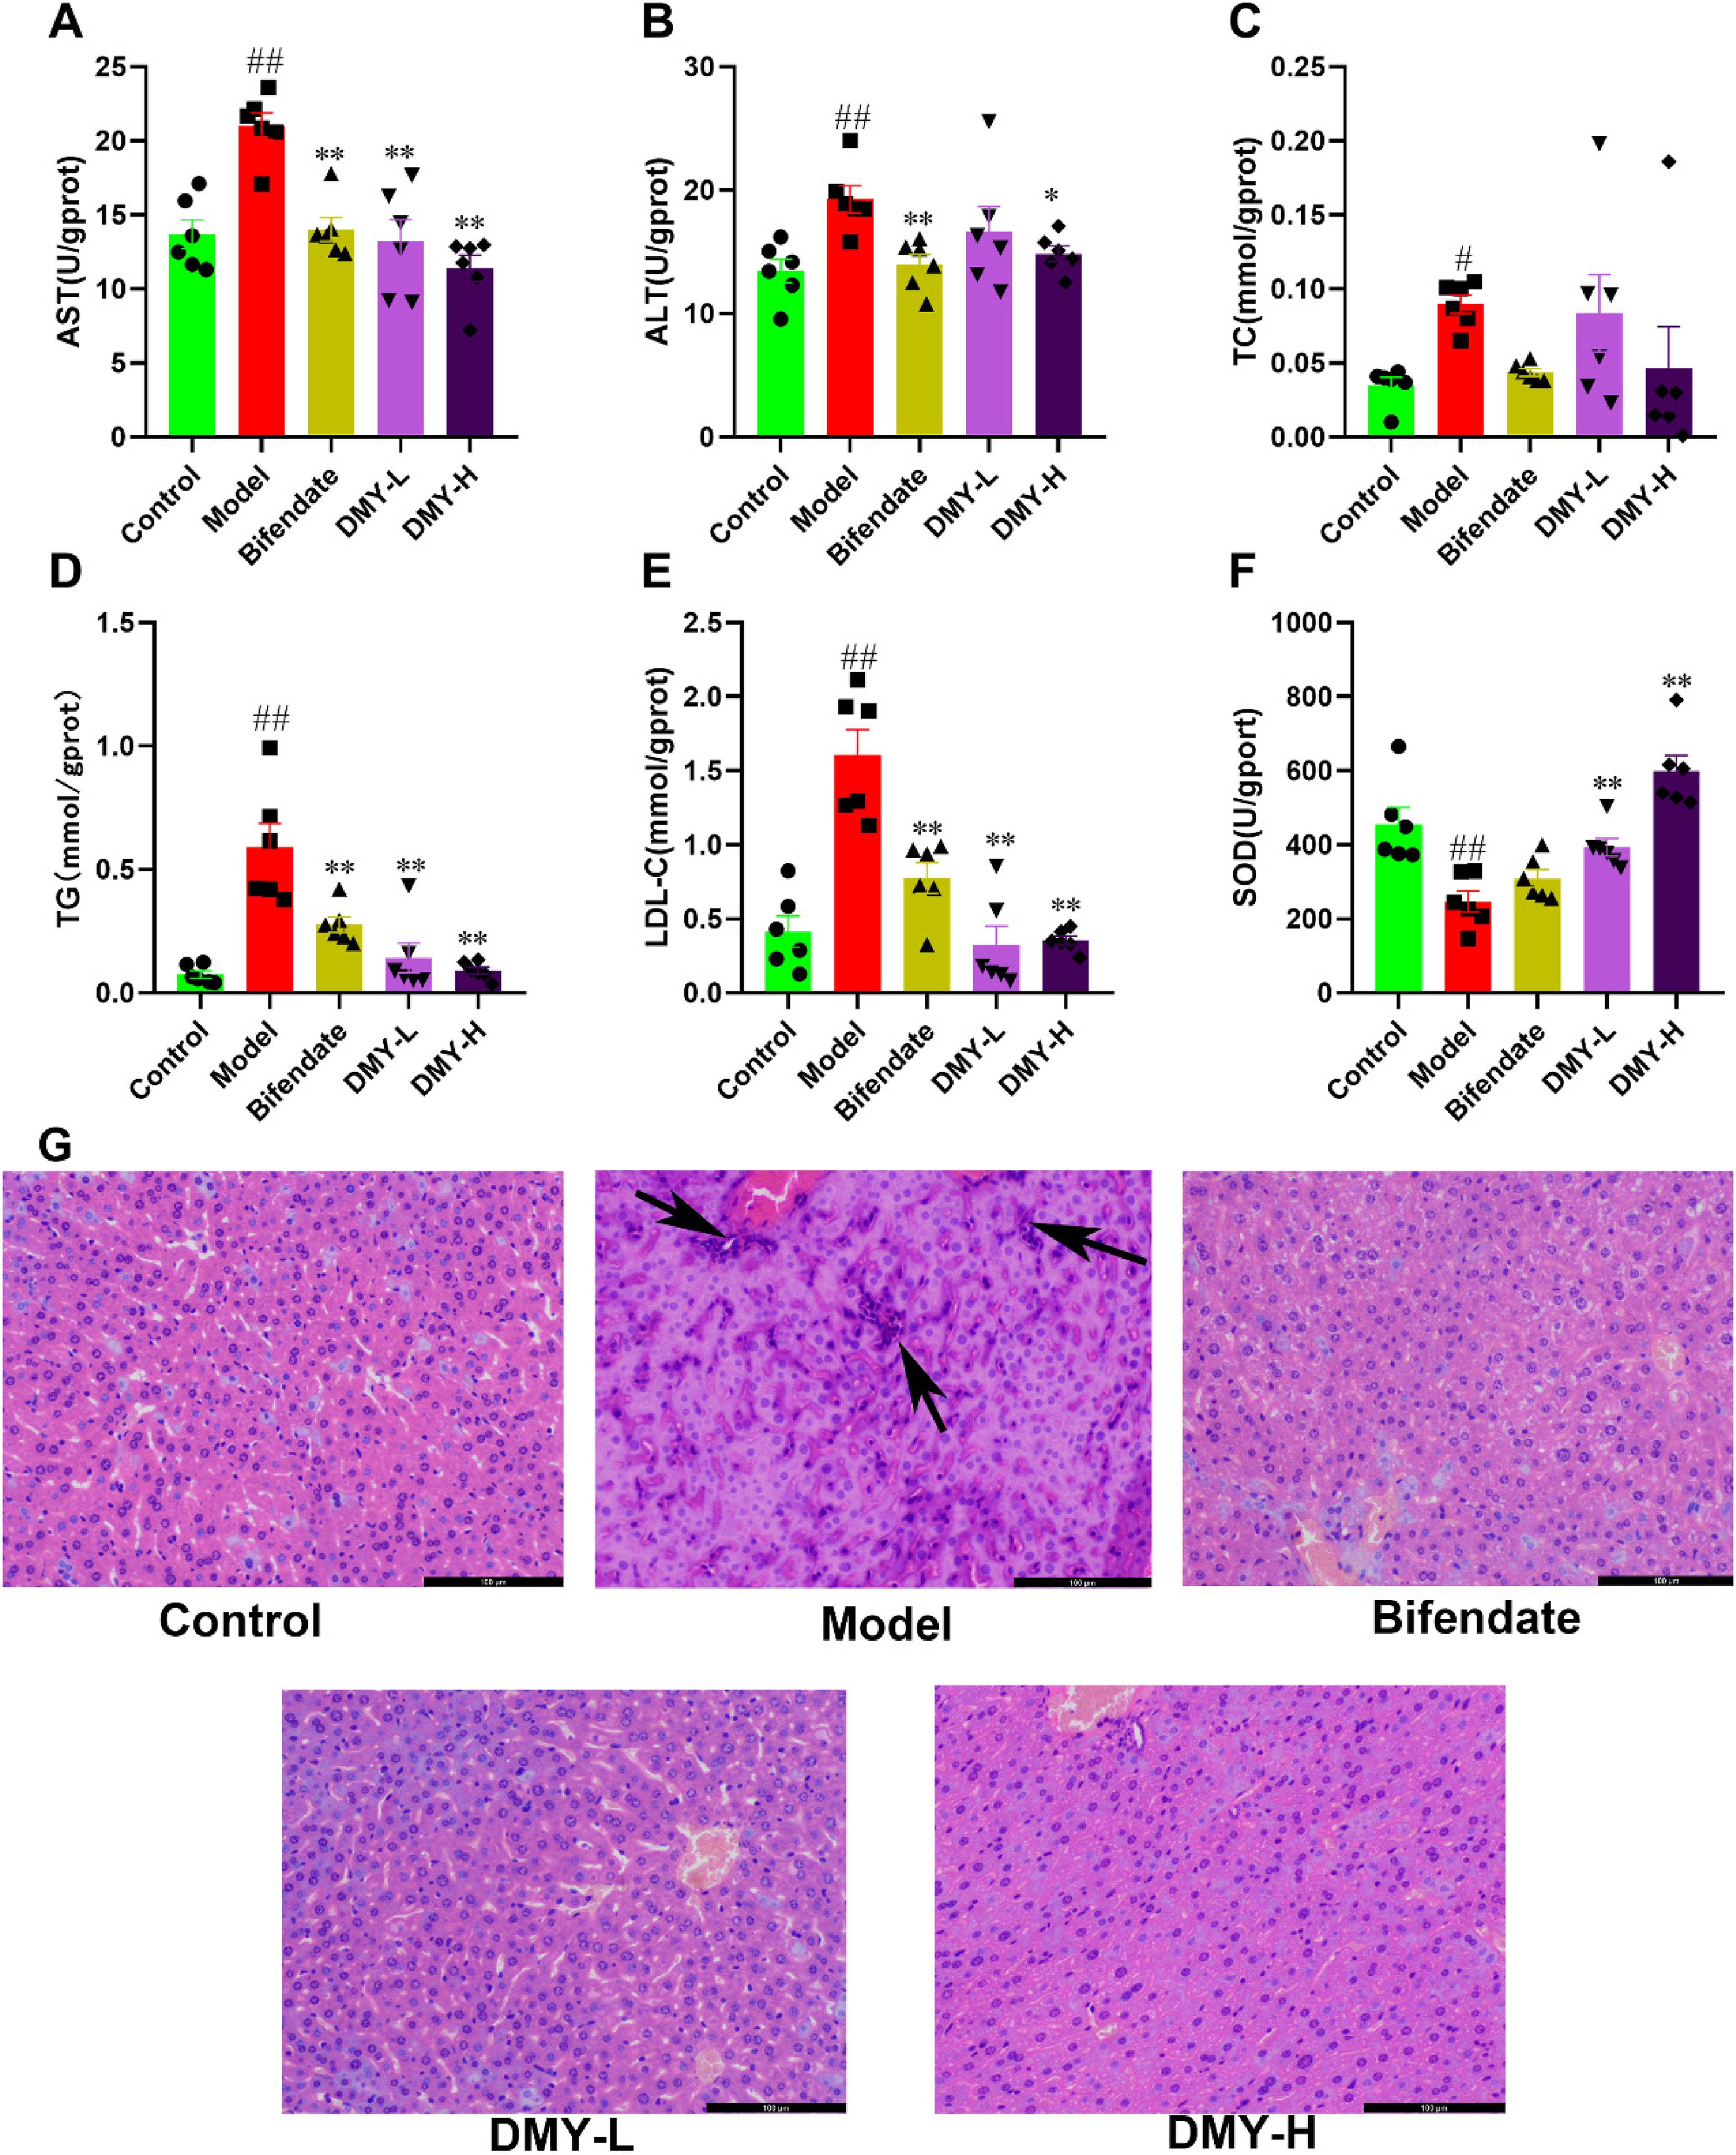
Effect of DMY on AST (A), ALT(B), TC (C), TG (D), LDL-C (E), SOD (F), and hematoxylin and eosin staining of liver sections (×200). Solid triangles, squares, and dots represent the sample data for each group. #P < .05, ##P < .01, compared with the control; *P < .05, **P < .01, compared with the model.
As shown in Figure 1G, there was no inflammation or hepatocyte hyperplasia, and the liver cells were arranged in an orderly manner in the control group. Marked inflammatory cell infiltration was observed in model mice, and DMY-L and DMY-H could attenuate the inflammatory cell infiltration.
FXR/NLRP3 and the Expression of Inflammatory Factors
Based on the above preliminary study, DMY-H was chosen to further explore the mechanism of DMY in ALD. FXR expression was found to be downregulated, and NLRP3, IL-1β, and IL-18 expression and cleaved Caspase1/caspase 1 levels were upregulated in the livers of mice in the model group, whereas DMY-H treatment upregulated FXR expression and downregulated NLRP3, IL-1β, and IL-18 expression, and cleaved Caspase1/caspase 1 levels in mouse livers (Figure 2A-F). Next, inflammation-related gene expression was determined using real-time PCR. As shown in Figure 2G-1, the gene expression of TNF-α, IL-1β, and IL-6 were significantly upregulated in model rats (P < .01), whereas treatment with DMY-H significantly decreased IL-1β and IL-6 gene expression (P < .01). The levels of inflammatory factors were measured using ELISA (Figure 2J-L), and the results showed that serum TNF-α, IL-1β, and IL-18 levels in mice in the model group increased significantly compared with those in the control group (P < .01). The levels of all 3 inflammatory factors decreased after treatment with DMY (P < .05 and P < .01).

Effect of DMY on FXR and NLRP3 signaling pathway protein expression (A), relative NLRP3 protein expression (B), relative FXR protein expression (C), cleaved caspase-1/caspase-1 (D), relative IL-1β protein expression (E), relative IL-18 protein expression (F), relative TNF-α mRNA levels (G), relative IL-1β mRNA levels (H), relative IL-6 mRNA levels (I), and inflammatory cytokines (J-K) in mice with alcoholic liver injury. Solid triangles, squares, and dots represent the sample data for each group. #P < .05, ##P < .01, compared with the control; *P < .05, **P < .01, compared with the model.
Serum Metabolomics
Figure 1 shows that DMY-H treatment significantly ameliorated hepatic injury. Therefore, serum and liver metabolic analyses were conducted using a high dose of DMY. The levels of nontargeted serum metabolites were measured to analyze the effect of DMY on the serum metabolites in the control, model, and DMY-H groups. To visualize the general clustering of samples in the 3 groups, an unsupervised learning method was used. As shown in Figure 3A-B, principal component analysis (PCA) scoring revealed that serum samples from the above 3 groups showed clear separation, whereas DMY samples appeared closer to the control group. Supervised orthogonal partial least squares discriminant analysis (OPLS-DA) was used to identify the metabolites after PCA. Figure 3C-D shows the OPLS-DA score plots of the 2 groups (control vs model; DMY vs Model). The established OPLS-DA models were identified based on 200 response permutation testing (Figure 3E-F). The R2Y and Q2 values were R2Y = 0.98, Q2 = −0.34 between the model and control groups, and were R2Y = 0.98, Q2 = −0.30 between the model and DMY groups. Volcano plots are used to illustrate the differential metabolites (Figure 3G-H). Based on variable importance in the projection (VIP) values > 1 and t-test P values > .05, the model and control groups differed in 117 metabolites (Supplemental Figure 1), and there were 26 metabolic pathways in which these metabolites were enriched (Supplemental Table 1, Figure 4A). A total of 53 differential metabolites were identified between the DMY and model groups (Supplemental Figure 2), and a total of 10 metabolic pathways were enriched with these metabolites (Supplemental Table 2, Figure 4B). Based on these results, it was inferred that DMY could alter the following 5 pathways: vitamin B6 metabolism; nicotinate and nicotinamide metabolism; aminoacyl-tRNA biosynthesis; arginine and proline metabolism; glycine, serine, and threonine metabolism.

Differences in serum metabolites among the 3 groups. PCA among the 3 groups (A), PCA between the control and model groups (B), OPLS-DA scores between the control and model groups (C), OPLS-DA scores between the model and DMY groups (D), permutation test of OPLS-DA model between the control and model groups (E), permutation test of OPLS-DA model between the model and DMY groups (F), volcano plots of differentially expressed metabolites (G) between the control and model groups, and volcano plots of differentially expressed metabolites (H) between the DMY and model groups.

Summary of pathway analysis based on the different metabolites between the model and control (A), summary of pathway analysis based on the different metabolites between the DMY and control groups (B).
Next, the common metabolites among the 3 groups were selected for t-test analysis to determine specific metabolic biomarkers. The metabolic biomarkers are shown in Figure 5 and Table 2. Alcohol treatment downregulated the levels of N-α-acetyllysine, 1-pyrrolinecytosine, glutamyllysine, 5-methylcytosine, N-methylvaline, and pyridoxamine (P < .05 and P < .01), and upregulated the levels of demethoxycurcumin, L-arginine, triacetin, and 15-methylpalmitate (P < .05 and P < .01). DMY upregulated the levels of N-α-acetyllysine, 1-pyrrolinecytosine, glutamyllysine, 5-methylcytosine, N-methylvaline, and pyridoxamine (all P < .05), and downregulated the levels of demethoxycurcumin, L-arginine, triacetin, and 15-methylpalmitate (P < .05 and P < .01) in mice compared with those in the model group.

Hierarchical clustering analysis presented as a heatmap for the control, model, and DMY groups (A), bar graphs of the key metabolites (B-K). The solid triangles, squares, and dots represent the sample data for each group. #P < .05, ##P < .01, compared with control; *P < .05, **P < .01, compared with model.
Analysis of Serum Samples for Differential Significant Metabolites.

Abbreviation: DMY, dihydromyricetin.
Note: ↓ indicates reduced levels of metabolites and ↑ depicts increased levels of metabolites.
*, ** Significantly different between the compared groups (*P < .05, **P < .01).
Liver Metabolomics
The liver is the primary organ in the body for ethanol metabolism. UPLC-MS/MS was performed on liver samples of mice from the control, model, and DMY groups, similar to that conducted for serum samples. Overall, the PCA score plot of liver samples showed a clear separation among the control, model, and DMY groups with principal components, whereas the samples from the DMY groups were closer to the control group (Figure 6A-B). Next, supervised OPLS-DA was used to identify the metabolites. Liver OPLS-DA score plots of the 2 groups (control vs model; DMY vs Model) are shown in Figure 6C-D. The established OPLS-DA models were identified based on 200 response permutation testing (Figure 6E-F). Liver samples from the model and control groups differed significantly, and the R2Y and Q2 values were R2Y = 0.87 and Q2 = -0.73 between the model and control groups. The R2Y and Q2 values were R2Y = 0.95, Q2 = −0.29 between the model and DMY groups. Volcano plots are used to illustrate the results of differential metabolites (Figure 6G-H).
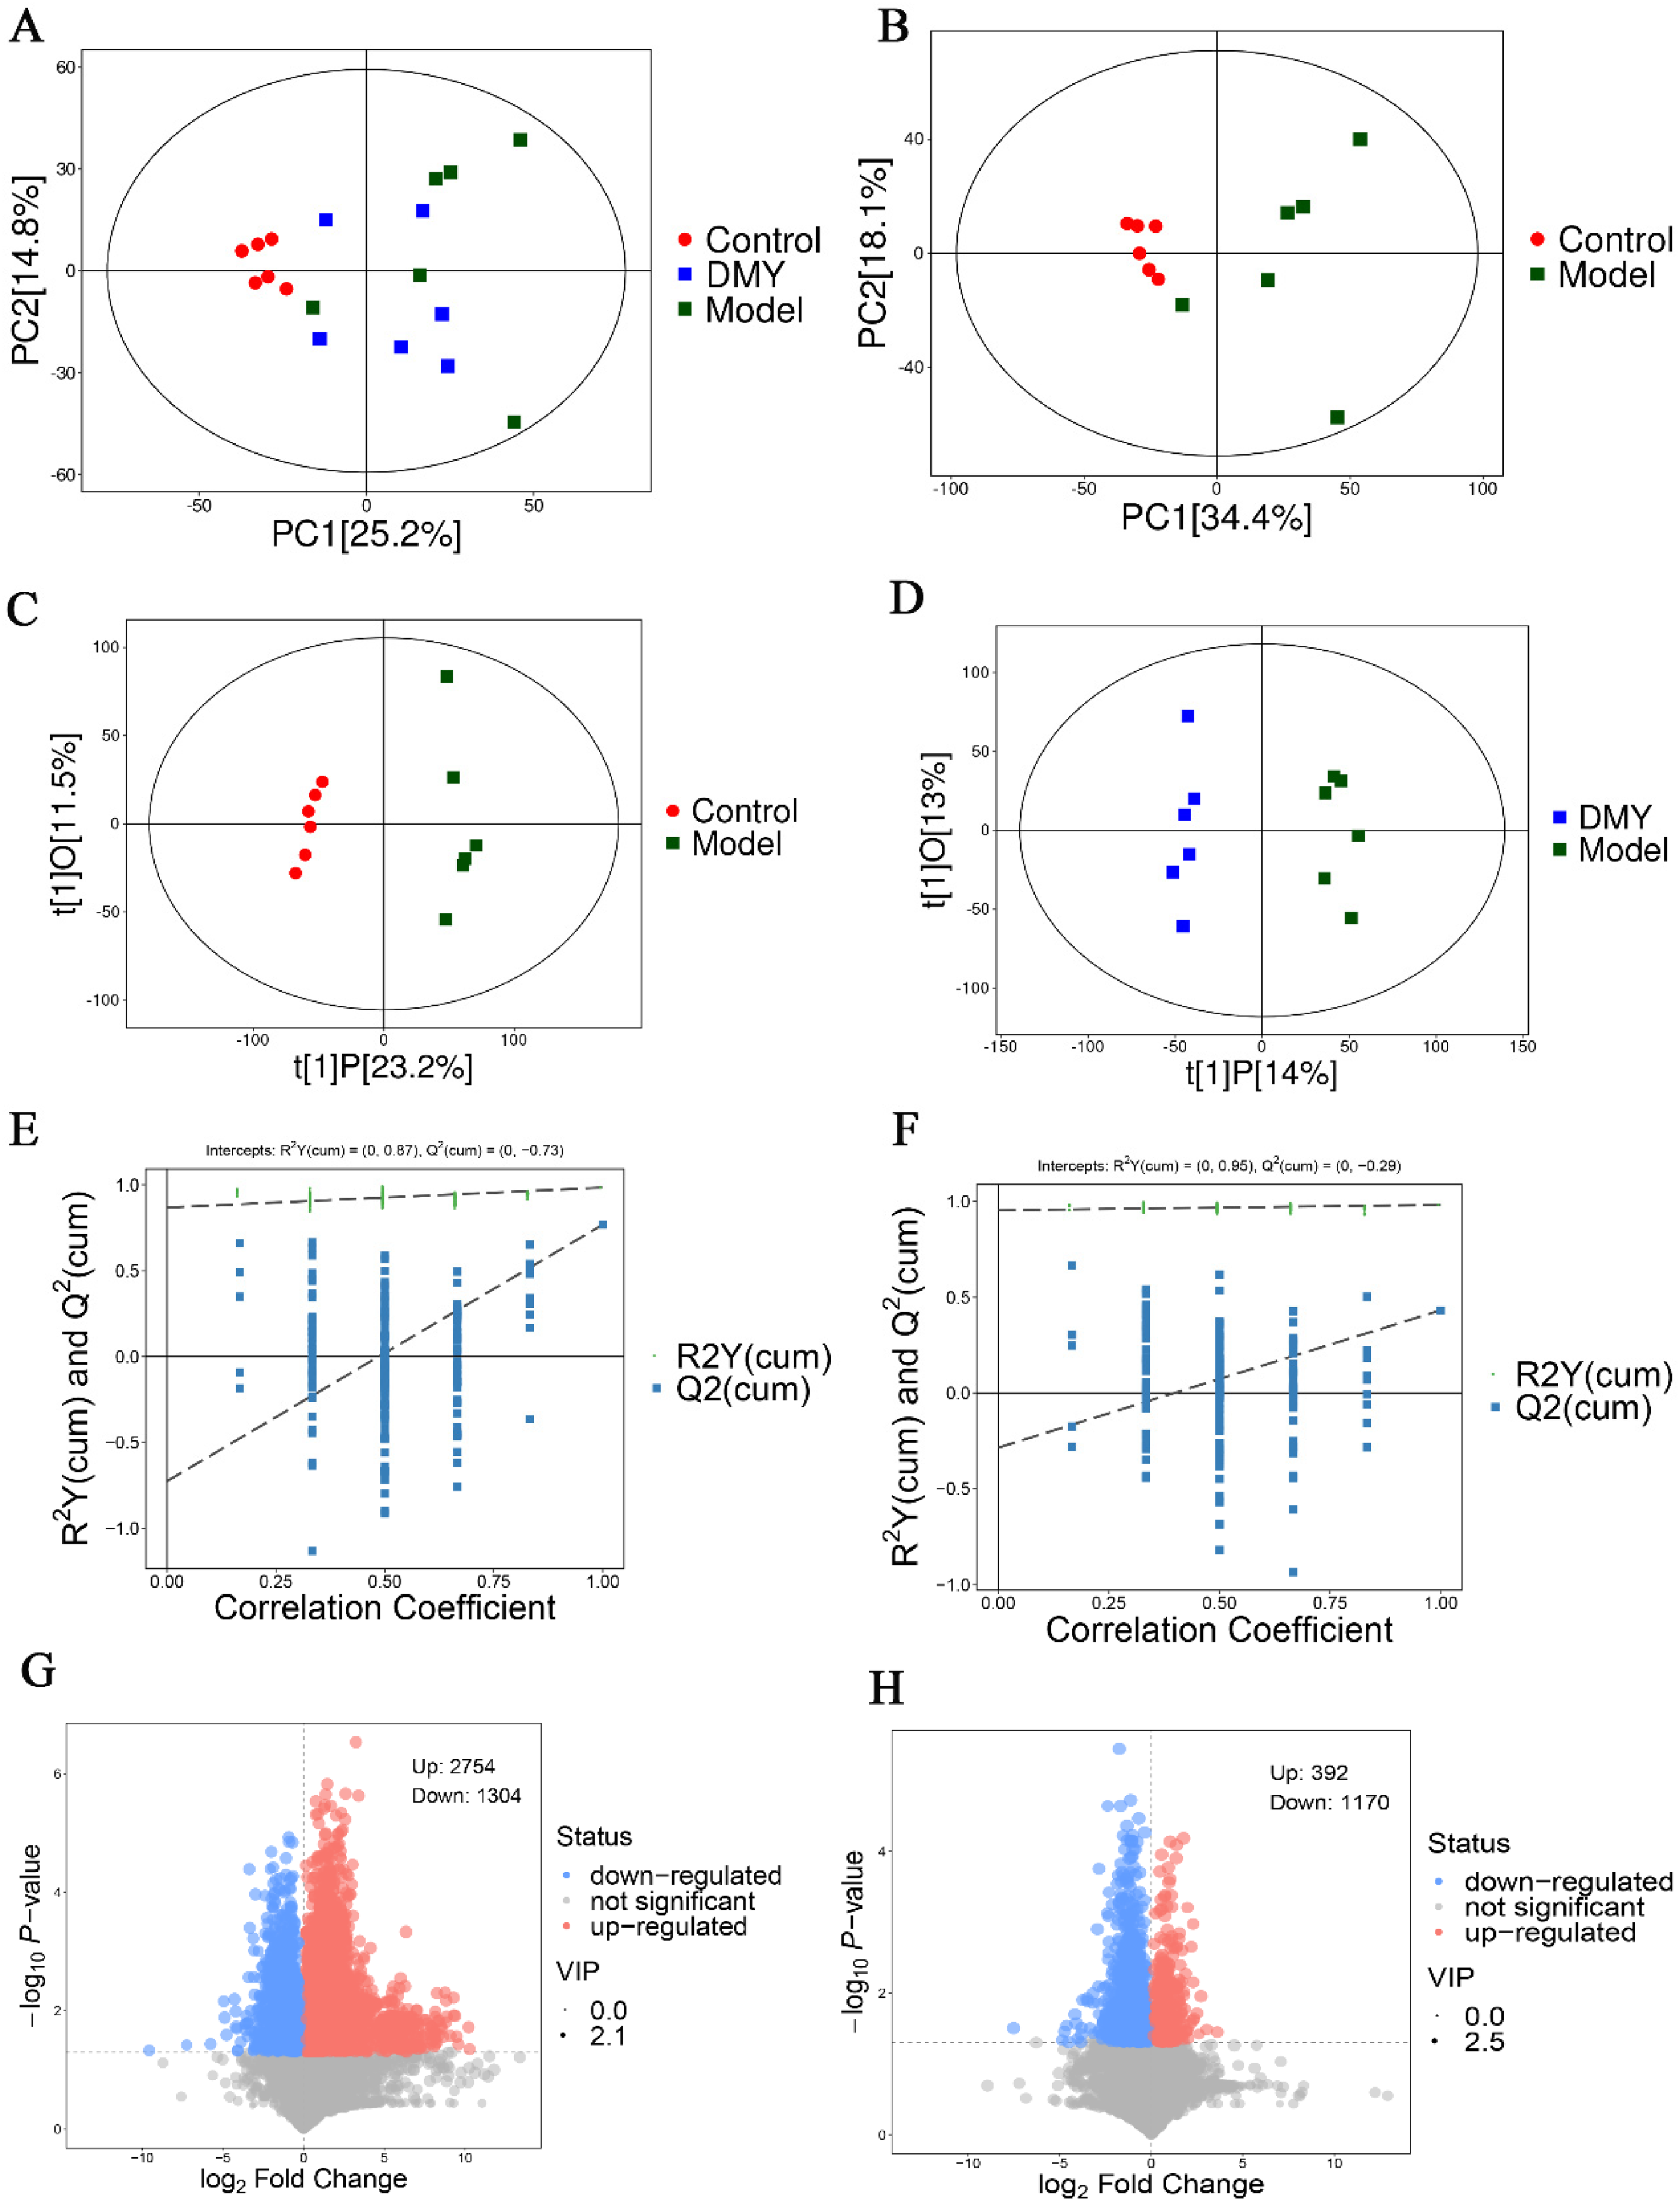
Liver metabolites differences among the 3 groups. PCA among the 3 groups (A), PCA between the control and model groups (B), OPLS-DA scores between the control and model groups (C), OPLS-DA scores between the model and DMY groups (D), permutation test of OPLS-DA model between the control and model groups (E), permutation test of OPLS-DA model between the model and DMY groups (F), volcano plots of differentially expressed metabolites (G) between the control and model groups, and volcano plots of differentially expressed metabolites (H) between the DMY and model groups.
Based on VIP values > 1 and t-test P values > .05, the model and control groups differed in 188 metabolites (Supplemental Figure 3), and there were 40 metabolic pathways in which these metabolites were enriched (Supplemental Table 3, Supplemental Figure 5A). A total of 76 differential metabolites were identified between the DMY and model groups (Supplemental Figure 4), and 27 metabolic pathways were enriched with these metabolites (Supplemental Table 4, Supplemental Figure 5B).
The next step was to select the common metabolites among the 3 groups for t-test analysis to find specific metabolic biomarkers. The differential metabolites in the liver are shown in Figure 7A and Table 3. Among the 31 metabolites, compared with the control group, alcohol treatment downregulated O-propanoyl carnitine (P < .01), and upregulated 30 metabolites including LysoPE(16:0/0:0), L-leucine, LysoPE(18:2(9Z,12Z)/0:0), LysoPE(18:1(9Z)/0:0), L-methionine (P < .05 and P < .01). DMY upregulated the relative level of O-propanoyl carnitine (P < .01) and downregulated the levels of LysoPE(16:0/0:0), L-leucine, LysoPE(18:2(9Z,12Z)/0:0), LysoPE(18:1(9Z)/0:0), and L-methionine (P < .05 and P < .01). Metabolic pathway analysis with MetaboAnalyst 5.0 revealed that DMY treatment altered the following main pathways: valine, leucine, and isoleucine biosynthesis; aminoacyl-tRNA biosynthesis; valine, leucine, and isoleucine degradation; cysteine and methionine metabolism (Figures 7B and 8).

Heatmap of the significantly different liver metabolites between the control and model groups (A), summary of liver pathway analysis (B), relative expression of liver metabolites is represented by different colors (n = 6 per group).

Diagram of the potential signaling pathway and key enzymes.
Analysis of Liver Samples for Differential Significant Metabolites.

Abbreviation: DMY, dihydromyricetin.
Note: ↓ indicates reduced levels of metabolites and ↑ depicts increased levels of metabolites.
*, ** Significantly different between the compared groups (*P < .05, **P < .01).
LT, BCAT, and LDH were the key enzymes in cysteine and methionine metabolism. LT activity increased and BCAT activity decreased significantly compared with that in the control group (P < .05 and P < .01). DMY treatment significantly improved BCAT activity (P < .01) (Figure 8).
MS, BHMT, and HMT were the key enzymes in valine, leucine, and isoleucine biosynthesis. The activity of these enzymes was determined using ELISA to validate the results from liver metabolic pathway analysis (Figure 8). MS activity reduced significantly (P < .01) and BHMT activity improved significantly (P < .01) in the model group compared with that in the control group; DMY treatment improved MS activity and significantly reduced BHMT activity (P < .01).
Correlation Between Serum Metabolites, Liver Metabolites, and Pharmacodynamic Indices
The novel inner relationship between the pharmacodynamic indices, reversal of serum metabolomics, and liver metabolomics was evaluated. Spearman correlation analysis was performed by applying the 10 serum metabolites (Figure 5), 31 liver metabolites (Figure 7), and 9 pharmacodynamic indices (Figures 1 and 2). Correlation coefficient matrices are presented as heatmaps (Figure 9-11).

Correlation between serum metabolomics and liver metabolomics.

Correlation between pharmacodynamic indices and liver metabolomics.

Correlation between pharmacodynamic indices and serum metabolomics.
Serum metabolites exhibited a close relationship with liver metabolites (Figure 9). 15-Methylpalmitate showed a tight correlation with 13 liver metabolites, demethoxycurcumin showed a tight correlation with 10 liver metabolites, L-arginine showed a tight correlation with 6 liver metabolites, triacetin showed a tight correlation with 7 metabolites, glutamyllysine showed a tight correlation with 15 liver metabolites, 5-methylcytosine showed a tight correlation with 18 liver metabolites, N-α-acetyllysine showed a tight correlation with 12 liver metabolites, N-methylvaline showed a tight correlation with 3 liver metabolites, 1-pyrroline showed a tight correlation with 4 liver metabolites, and pyridoxamine showed a tight correlation with 6 liver metabolites.
Pharmacodynamic indices were closely related to serum and liver metabolites (Figures 10-11). SOD showed a tight correlation with 11 liver metabolites and 4 serum metabolites, TG showed a tight correlation with 22 liver metabolites and 4 serum metabolites, AST showed a tight correlation with 14 liver metabolites and 7 serum metabolites, LDL showed a tight correlation with 16 liver metabolites and 8 serum metabolites, ALT showed a tight correlation with 24 liver metabolites and 3 serum metabolites, TC showed a tight correlation with 14 liver metabolites, IL-18 was positively corrected with valyl-serine, IL-1β showed a tight correlation with 28 liver metabolites and 7 serum metabolites, and TNF-α showed a tight correlation with 19 liver metabolites and 8 serum metabolites.
Discussion and Conclusions
Billions of people worldwide drink alcohol. ALD is a chronic liver disease associated with long-term alcohol consumption and overdose. Excessive alcohol consumption can adversely affect human health by disrupting liver metabolism and oxidative stress homeostasis. Pharmacodynamic results from the current study indicated that mice in the Model group had higher levels of AST, ALT, TC, TG, and LDL-C than those in the control group. DMY treatment improved liver function and reduced blood lipid indices. Thus, DMY could improve chronic alcohol-induced liver injury.
Certain medications have been demonstrated to improve liver injury by increasing FXR expression.13,14 FXR activation significantly reduced liver damage and inhibited the production of inflammatory cytokines. 15 A prior investigation has indicated that FXR levels in the liver showed an inverse correlation with the extent of NLRP3 inflammasome activation in individuals with hepatitis B virus-related liver failure or nonalcoholic fatty liver disease and in mice with liver injury. 16 An excessive inflammatory reaction is likely to cause more severe harm or even hepatocyte death. 17 During cecal ligation and puncture-induced liver injury, Chen et al observed an elevation in the protein levels of NLRP3 and in pyroptosis-associated proteins. 18 Liu et al showed that hepatic NLRP3 was triggered in mice with Schistosoma-induced liver injury. 19 NLRP3, IL-1β, and IL-18 expression, and cleaved Caspase1/caspase 1 levels increased in alcohol-fed mice and were accompanied by the increased expression of inflammatory genes (TNF-α, IL-6, and IL-1β). Moreover, NLRP3 inflammasome-related inflammatory factors TNF-α, IL-18, and IL-1β also increased in alcohol-fed mice. DMY intervention increased FXR expression and decreased the proinflammatory response. Thus, DMY decreased NLRP3 expression, inflammatory gene expression, and the levels of the inflammatory factors TNF-α, IL-18, and IL-1β.
Excessive alcohol consumption can adversely affect the body, particularly the liver, which is the main site of ethanol metabolism. A metabolomics approach holds promise in improving our understanding of how alcohol consumption affects metabolic function. Therefore, LC-MS and serum and liver metabolomics were used to detect important metabolic changes between healthy mice, alcohol-induced mice, and DMY-treated mice. Several small molecular metabolites are generated during ethanol metabolism, which may be related to ethanol-induced damage. These alterations are associated with both alterations in metabolic profiles and changes in metabolic parameters. In the current study, serum metabolomics profiling revealed that DMY altered the metabolic pathways, including vitamin B6 metabolism; arginine and proline metabolism; nicotinate and nicotinamide metabolism; and glycine, serine, and threonine metabolism. Liver metabolomics profiling revealed that DMY altered the following metabolic pathways: valine, leucine, and isoleucine biosynthesis; aminoacyl-tRNA biosynthesis; cysteine and methionine metabolism; valine, leucine, and isoleucine degradation.
Pyridoxamine is an important metabolite in the metabolic pathway of vitamin B6 metabolism. Additionally, pyridoxamine is a cofactor for enzymes involved in biological and metabolic processes. 20 Maessen et al 21 found that pyridoxamine treatment inhibits fat-cell expansion and inflammation in obese mice and decreases their body weights. A previous study also found that pyridoxamine could reduce metabolic changes by improving fasting glycemia, visceral fat deposition, and hepatic lipid profile. 22 Traditionally, pyridoxamine has been considered beneficial because it prevents advanced glycation end products. 23 In the current study, serum metabolomics revealed that alcohol intake led to a significant decrease in pyridoxamine and that DMY treatment restored pyridoxamine levels. Another study also indicated that pyridoxamine modulates oxidative stress, advanced glycosylation, levels of inflammatory factors, and metabolic disorders. 24 Correlation analysis in the current study revealed that pyridoxamine was negatively related to IL-1β and LDL-C, and positively related to SOD. These previous findings are in concordance with the results of the current study. 24
Chronic liver diseases can profoundly alter nutritional status and amino acid metabolism. 23 In the present study, alterations in amino acids such as L-leucine were observed in alcohol-induced mice. L-leucine plays an important role in the biosynthesis of valine, leucine, and isoleucine as well as in their degradation. 25 Several organs and physiological systems are potentially affected by L-leucine. Contradictory effects have been reported for L-leucine. Supplementation with L-leucine before the development of obesity prevented diet-induced obesity in a study. Nevertheless, L-leucine did not have any beneficial effects when administered to obese mice. 26 Wang X found that L-leucine levels were increased in the ethanol-administered group. 27 Branched-chain amino acids may be degraded by BCAT. Under abiotic stress, BCAT maintains low levels of free branched-chain amino acids, which are nontoxic, to resist stress injury. 28 In the current study, BCAT activity was lower in the model group, indicating a decrease in L-leucine degradation and an increase in its levels. Therefore, L-leucine levels were higher in the model group than in the control group. 29 This finding was consistent with a previously published study. 27 DMY treatment improved BCAT activity and decreased the activities of LT and L-leucine. The results indicated that DMY may alleviate chronic alcoholic liver injury through valine, leucine, and isoleucine biosynthesis; and valine, leucine, and isoleucine degradation. Spearman's correlation analysis revealed that L-leucine was positively correlated with TG and ALT.
Multiple factors contribute to liver disease resulting from excessive and chronic alcohol consumption. Alterations in methionine metabolism with hyperhomocysteinemia have been reported in liver injury. 30 L-Methionine is essential for the synthesis of proteins and other molecules. In addition to serving as a methyl donor for polyamines, choline, and creatinine, L-methionine is also used for the biosynthesis of cysteine and S-adenosylmethionine. 31 Some studies show that animals deficient in methionine exhibit bone structural changes and are more susceptible to hepatocellular injury, oxidative stress, and inflammation. Methionine deficiency increases the risk of nonalcoholic steatohepatitis,31,32 whereas methionine excess causes hematological changes, hemolytic anemia, enlargement of the spleen, and hemosiderin deposition in the spleen.33,34 In the current study, mice in the model group had higher concentrations of L-methionine compared with those in the normal group. L-methionine is a metabolite of cysteine and methionine metabolism. MS, HMT, and BHMT play a role in methylating homocysteine to produce methionine. 35 It has been suggested that alcohol (ethanol) contributes to homocysteine dysregulation. Hepatic methionine-metabolism enzymes are posttranslationally modified due to chronic alcohol consumption, resulting in hyperhomocysteinemia. Alcohol use inhibits methionine synthase, resulting in lower homocysteine remethylation. 36 Therefore, the activities of these 3 enzymes in this pathway were tested. It was found that DMY regulated the activities of MS, BHMT, and HMT. Cysteine- and methionine-metabolism pathways regulate oxidative stress through the methionine/glutathione trans-sulfuration pathway. 36 In the current study, alcohol-fed mice showed a decrease in SOD activity, whereas DMY treatment improved SOD activity.
In summary, DMY could regulate FXR expression, NLRP3 expression, inflammatory gene expression, and metabolic disorders via key metabolic pathways such as valine, leucine, and isoleucine biosynthesis; cysteine and methionine metabolism; and valine, leucine, and isoleucine degradation to alleviate alcoholic liver injury. There are also limitations in the current study. The relationship between different metabolites and FXR and NLRP3 is unclear. Accordingly, in the next step, this relationship will be experimentally verified. Overall, the results from the current study provide insights into the potential use of DMY to treat alcoholic liver damage and serve as a reference for the design and production of functional foods.
Supplemental Material
sj-doc-1-npx-10.1177_1934578X241250254 - Supplemental material for Modulatory Effect of Dihydromyricetin on Chronic Alcoholic Liver Injury Based on the FXR-NLRP3 Signaling Pathway and Serum and Liver Metabolomics
Supplemental material, sj-doc-1-npx-10.1177_1934578X241250254 for Modulatory Effect of Dihydromyricetin on Chronic Alcoholic Liver Injury Based on the FXR-NLRP3 Signaling Pathway and Serum and Liver Metabolomics by Hao Wang, Jinhang Zhou, Wenxin Shi, Shijuan Shao and Yunzhong Chen in Natural Product Communications
Supplemental Material
sj-docx-2-npx-10.1177_1934578X241250254 - Supplemental material for Modulatory Effect of Dihydromyricetin on Chronic Alcoholic Liver Injury Based on the FXR-NLRP3 Signaling Pathway and Serum and Liver Metabolomics
Supplemental material, sj-docx-2-npx-10.1177_1934578X241250254 for Modulatory Effect of Dihydromyricetin on Chronic Alcoholic Liver Injury Based on the FXR-NLRP3 Signaling Pathway and Serum and Liver Metabolomics by Hao Wang, Jinhang Zhou, Wenxin Shi, Shijuan Shao and Yunzhong Chen in Natural Product Communications
Footnotes
Author Contributions
Yunzhong Chen designed the research; Hao Wang and Jinhang Zhou wrote the manuscript; Hao Wang, Jinhang Zhou, Wenxin Shi, Shijuan Shao, and Yunzhong Chen performed the research; Hao Wang and Jinhang Zhou analyzed the data; Yunzhong Chen revised the manuscript. All data were generated in-house and no paper mill was used. All authors agree to be accountable for all aspects of work, ensuring integrity and accuracy.
Authors’ Notes
Hao Wang and Jinhang Zhou are cofirst authors, these authors contributed equally to this work.
Declaration of Conflicting Interests
The authors declared no potential conflicts of interest with respect to the research, authorship, and/or publication of this article.
Ethical Approval
This study was approved by the Administration Committee of Experimental Animals, Hubei Province, China.
Funding
The authors disclosed receipt of the following financial support for the research, authorship, and/or publication of this article: This work was supported by the Hubei Province Central Guided Local Science and Technology Development Special Project “Construction of Hubei Province Traditional Chinese Medicine and Health Food Engineering and Technology Research Center” (No. 2019ZYYDO69).
Statement of Human and Animal Rights
All experimental procedures involving animals were conducted in accordance with the Institutional Animal Care guidelines of Hubei University of Chinese Medicine, China and approved by the Administration Committee of Experimental Animals, Hubei Province, China.
Statement of Informed Consent
There were no human subjects in this study and informed consent was not applicable.
Supplemental Material
Supplemental material for this article is available online.
References
Supplementary Material
Please find the following supplemental material available below.
For Open Access articles published under a Creative Commons License, all supplemental material carries the same license as the article it is associated with.
For non-Open Access articles published, all supplemental material carries a non-exclusive license, and permission requests for re-use of supplemental material or any part of supplemental material shall be sent directly to the copyright owner as specified in the copyright notice associated with the article.