
Abstract
Background:
Under nutrition among pregnant women is common public health problem in developing countries including Ethiopia. It leads to poor maternal and neonatal outcomes. Despite its consequences there is shortage of research evidence to support intervention in this regard in the southern part of the country. Therefore, the aim of the study was to assess the determinates of under nutrition among pregnant women visiting antenatal care clinics at selected health facilities in Hawassa town.
Methods:
Health facility based cross-sectional study was employed among 454 systematically selected study participants. Data were collected by using structured and pre-tested questionnaires with face to face interview. Data were entered into Epi info and then exported to SPSS version 26 statistical software for analysis. Data were analyzed with descriptive statistics; bivariate and multivariate binary logistic regression.
Result:
The over all of prevalence of under nutrition among pregnant women was 27.6% [95% CI (22.6, 30.8)]. In multivariate logistic regression model, lowest wealth quintile [AOR = 3.3, 95% CI (1.7, 7.0)], women with dietary diversity [AOR = 2.0, 95% CI (1.3, 4.0)], presence of anemia [AOR = 10.7, 95% CI (5.8,19.8)], lower pregnant women education level [AOR = 3.3, 95% CI (1.4, 7.9)], lower partner education level [AOR = 3.1, 95% CI (1.1, 8.5)], not ate flush/meat food [AOR = 2.8, 95% CI (1.7, 4.8)], and not ate other fruits [AOR = 1.8, 95% CI (1.1, 2.8)] had significant association with under nutrition.
Conclusion:
In this health facility based study, the burden of under nutrition was high. Lowest wealth quintiles, low dietary diversity scores, being anemic and low education of the pregnant women and her partner were associated with under nutrition. Therefore, counseling for dietary diversity during antenatal care, health promotion and education for pregnant women and empowering women on income generation activities are a key intervention to tackle under nutrition.
Keywords
Background
Globally, under nutrition is a serious public health challenges, as evidence have shown that 1 in 9 people is hungry or under nourished. 1 In 2018, about 821.6 million peoples were under nourished in worldwide; 256.1 million peoples were from Africa. 2 Similarly, maternal and child under nutrition and micronutrient deficiencies affect approximately half of the world’s population. 3 The current evidences have indicated that, globally, under nutrition continues as an extremely high level. In spite of some progresses reported in selected nutrition measurements, improvement is insufficient to meet the 2025 global nutrition targets. Therefore, strong efforts and actions are required to meet each of those targets.1,4,5 Furthermore, Malnutrition burden is increasing in almost all sub regions of Africa, the region with the highest prevalence of under nutrition, at almost 20%.2,6 Moreover, meta-analysis report revealed that, there is a high burden of under nutrition during pregnancy in Africa. 6 Similar studies in Ethiopia have shown that, there is high level of under nutrition among pregnant women.4,7 Thus, it needs government and partners efforts to reduce the level of under nutrition among pregnant women.
Global leader meet and amended new plan, which is a plan of sustainable development goal (SDG), set of 17 goals with 69 targets for the implementation of just 15 years for 2030. The goal 2 directly related to end hunger, achieve food security and improve nutrition status of pregnant women and promote Sustainable agriculture. 8 Besides, the government of Ethiopia also adapted the SDG to implement the nutritional program which has included pregnant women nutrition status improvement through stakeholder efforts and multi-sectorial collaboration and coordination. 9
Malnutrition in all its forms remains unacceptably high across all regions of the world.1,10 The Global nutrition evidence has shown that, burden of under nutrition in all countries putting as a public health challenge, about 2 to 3 billion people is malnourished and experience some type of under nutrition, obesity or micronutrient deficiencies. 10 Furthermore, under nutrition is the main driver behind the global burden of disease and results in the economic loss of annual gross domestic product in low and middle income countries. 11 Besides, the majority of the under nutrition burden exists in sub-Saharan Africa and South-Central Asia.2,6,12-14
In Ethiopia, the studies have shown that there is a high burden of under nutrition among pregnant women, 19% 15 and 21.8%. 16 According to Ethiopian demography health survey report 2016, overall percentage of under-nutrition among reproductive women is 22%, 7 Therefore, the existing evidence indicated that no country is on target to meet all of the 9 global targets that are being tracked.1,10 This proof alarms us to exert great efforts and an intensive intervention to tackle under nutrition among pregnant women and others.
The consequence of under nutrition among pregnant women includes economic burden mean that, high burden of under nutrition hinders economic growth and that leads to poverty17,18, an inadequate diet intake during pregnancy may increase the likelihood of stillbirths, premature births, low birth weight infants, and maternal deaths.19,20 Moreover, maternal under nutrition further contributes to 800 000 neonatal deaths annually.6,12,13
In spite of evidence on effective interventions and increasing political commitment to, and financial investment in nutrition, millions of women, children, and adolescents worldwide remain under nourished. 21 Moreover, maternal nutrition has long been neglected largely due to gender- based inequities in resource allocation. 22 In the study area, there is limited evidence on under nutrition among pregnant women. Hence, research proof is very important to address the gap and helps to tailor interventions. Therefore, the recent study aimed to assess the determinates of under nutrition among pregnant women visiting antenatal care (ANC) at selected health facilities in Hawassa town, Ethiopia.
Method and Materials
Study area
Hawassa city administration (Figure 1) is the capital city of the Southern Nations, Nationalities and People Regional (SNNPR) State and Sidama Region. It is located 275 km far from Addis Ababa in south direction. Based on 2007, population projections from the Central Statistical Agency of the Hawassa city administration, the total populations was 394 057, of the total residence, male populations were 197 107 and female populations were 196 950, estimated pregnancy were 13 634. 23 According to city administration health department, health service for community is being served by 1 public referral hospital, 1 public general hospital, 2 public primary hospital, 10 public and 2 non-governmental organization health centers, 5 private hospital, 7 private special clinic, 58 private medium clinic, 22 pharmacy, 115 drug store, 18 health posts. 24
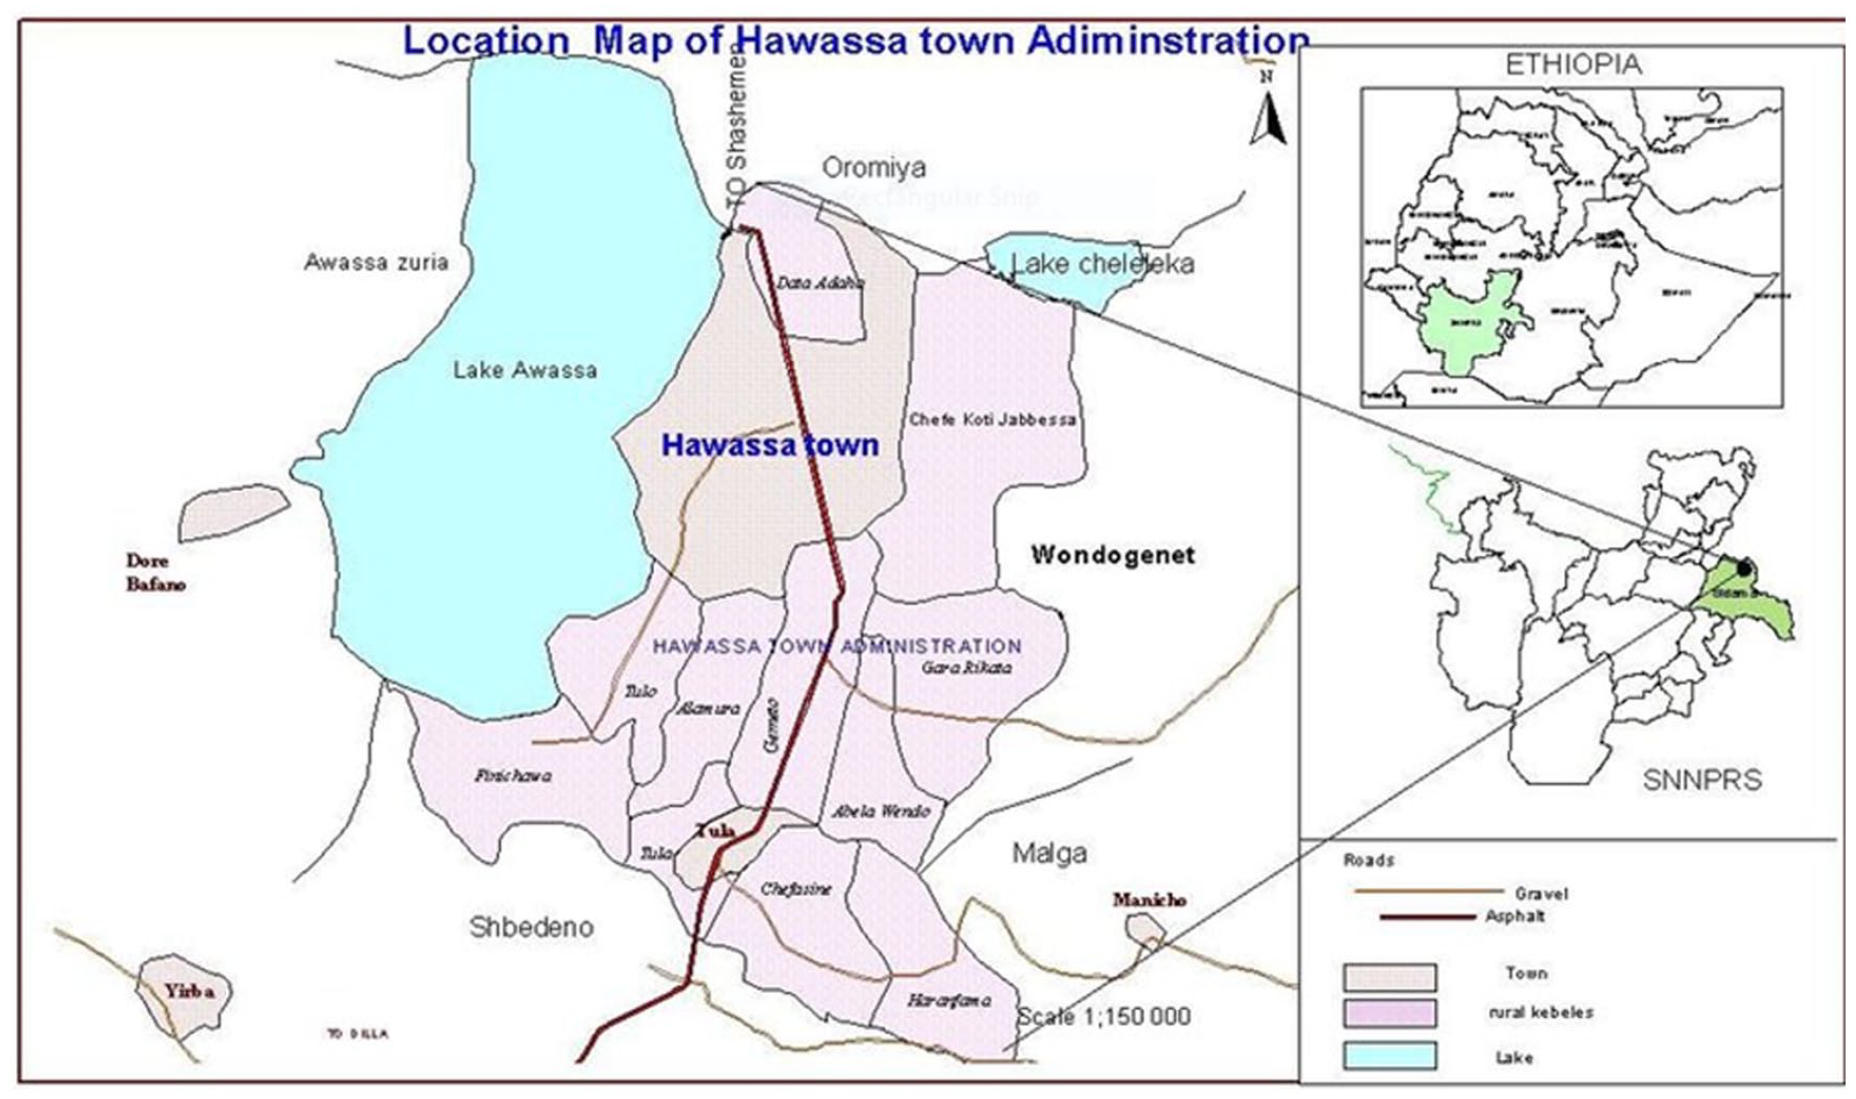
Maps of Hawassa city Administration.
Study design and period
Facility based cross-sectional study was employed from August 1 to September 30, 2021 to carry out this study.
Source population and study population
Pregnant women who were attending antenatal care (ANC) follow up at Hawassa City hospital and health center (HCs) were used as a source population. The study populations were selected pregnant women who were attending ANC follow up at selected hospital and HCs.
Inclusion and exclusion criteria
Inclusion criteria
Pregnant women in age group of 15 to 49 years were included in the study. However, pregnant women who were unable to respond or communicate due to critically illness during data collection period excluded from study. Pregnant women who were not willing to give consent for anthropometry and blood sample measurement were excluded from the study.
Sample size determination and sampling technique
Sample size was determined for both objectives separately by using single population proportion formula and double population proportion formula. The sample size for objective 1 was calculated by single population proportion: with assumption of 95% confidence level, and 5% margin of error. With assumption of the previous similar study from southern Ethiopia, 16 the prevalence of under nutrition is 21.8%. n = sample size, α = level of significance (set at .05), z = the standard normal deviate with 95% CI (1.96), P = expected prevalence, d = degree of precision (0.04).
Considering non response rate of 10% = 409 + 11% non-response rate (409), n =
For second objective, we considered double population proportion formula with Epi info version 7 software, with the assumption of 95% CL, 80% power, 1:1 ratio of control to case, and 10% non-respondent rate.
When we compare the first single population proportion sample size with the second objective sample size, the single population proportion sample size had shown us a large sample size. Thus, we were considering adequate and representative sample size to respond the research objectives. Therefore, the final sample size was
In Hawassa town, there are 4 public hospital and 10 HCs and 2 NGO (non-governmental organization) health center (HC); from those, 1 primary hospital and 2 HCs was randomly selected. The sample size was proportionally allocated to each HCs and hospital. For this particular study, we considered systematic random sampling technique to select every study participants from selected the hospital and health center (HCs) register. At interval of k = 3, of the first 3 pregnant women, the first woman was randomly selected by using a lottery method. Therefore, every third pregnant women was included based on their Antenatal care (ANC) follow up visit order until the sample size met (Figure 2).
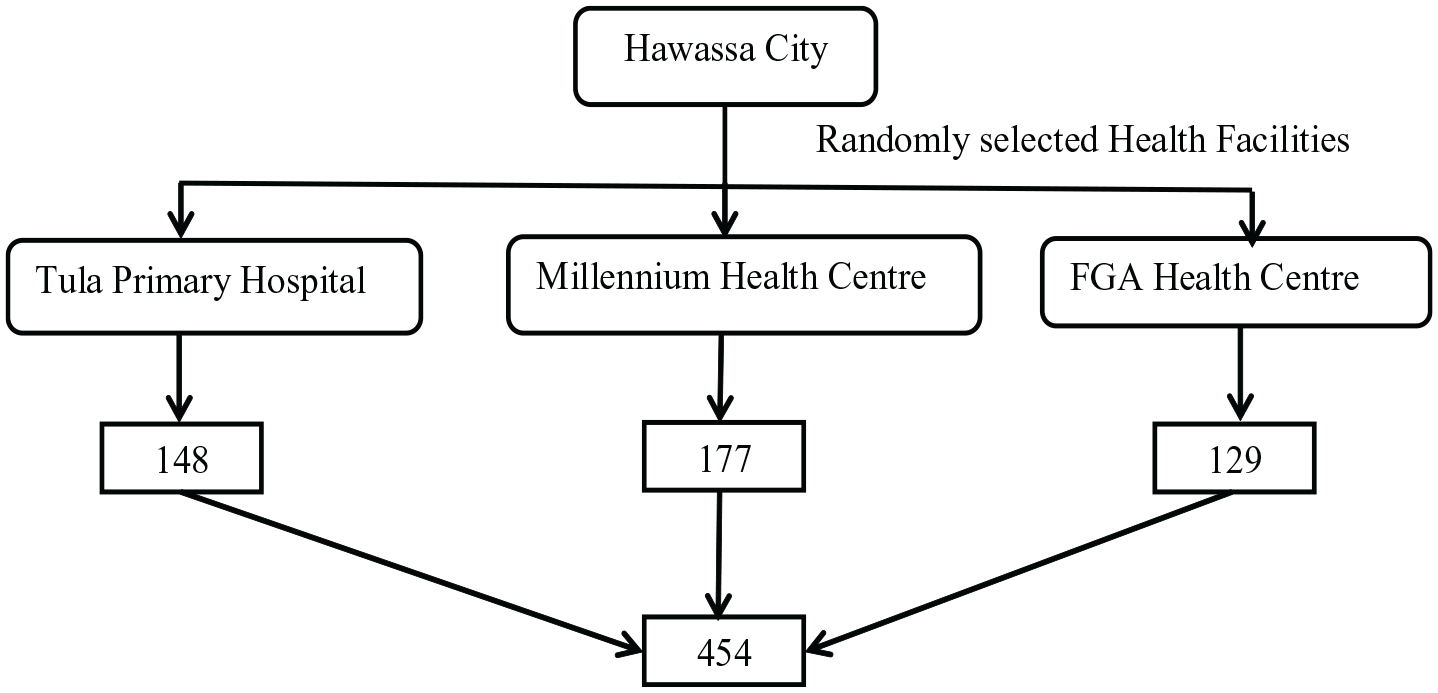
Schematic presentation of sample size determination.
Data collection tool and technique
In the current study, we collected data from August 2 to September 30, 2021. Data were collected by using structured and pre-tested questionnaires with face to face interview. The socio-demographic and health related part had taken from Ethiopian demographic survey, 7 dietary diversity taken from Food and Agricultural Organization (FAO) guide, 25 food frequency and other part of the questionaries’ had taken from different literatures. Anthropometric measurement was carry out by using mid upper arm circumference (MUAC). It is a suitable tool to identify under nutrition burden among pregnant women. 26 Furthermore, we assessed the hemoglobin level of the pregnant women by using hematocritine machine. A hematocrit test was used to measure blood hemoglobin levels. Blood was drawn from the respondents arm by using syringe and needle. The test was carried out by experienced laboratory technologists. Moreover, basic safety measures were taken during the blood samples collection.
The data collection tool was developed based on conceptual frame work, initially it was prepared by English language and then translated to local language, and Sidamegna and Amharic before data collection carry out.
Data quality and management
Before data collection carried out, the researchers were cautiously recruit 3 midwifery nurses and 1 supervisor for each health facility based on their experience in the previous similar study. After recruitment completed, the 2 days training was given for data collectors and supervisor on study objectives, purpose of the study, and practical session on questionnaire interview. Prior to data collection, 5% (n = 23) of the sample size was pre-tested on Allamura health center, which was similar background, but not actual study population. Based on the pre-test result we made some questionnaires corrections like skipping pattern, and sequence of questionnaires. The supervisor checked the data completeness on daily bases. Moreover, we facilitated the data entry in 2 computers to avoid error during data entry. Besides, we carefully cleaned data before actual data analysis begins.
Data entry and analysis
Researchers manually checked the data completeness, consistency, missed values, and unlikely responses before actual data entry initiated. Moreover, we properly coded the responses and enter data in to 2 computers. After data entry, data were analyzed by SPSS version 20, interpreted and summarized it. The descriptive analysis like measure of central tendency like mean, median, standard deviation and range result was presented by using percentage, frequency, graphs, and tables. Furthermore, we constructed wealth index using the household assets and possessions on the following variables: type of latrine facility, water sources used, electricity, radio, television, non-mobile phone, refrigerator, table, chair, kerosene lamp, watch, mobile phone, bicycle, motor cycle, animal drawn cart, car/truck, and Bajaj. Bivariate and multivariate logistic regression model applied to assess the relationship of socio-demographic and other independent factors with under nutrition. The outputs of the regression model were presented with crude odds ratio (COR) and adjusted odds ratio (AOR) with their respective confidence intervals (CI). The conditions for exporting variables to the multivariate model will be P-value less than .25. Furthermore, variables with P-value less than .05 used to declare statistically significant association. In regression model, goodness of fitness was assured through the non-statistical significance result of the Hosmer-Lemeshow test. Moreover, variance inflation factor (VIF) test used to check multi collinearity among the independent variable, and no significant (VIF > 10) collinearity was detected.
Results
Scio-demographic characteristics among pregnant women
Out of the total 454 pregnant women, 450 were voluntarily participated in the study, which gave a response rate of 99.1%.
The Mean (±SD) of pregnant women age was 25.7 (±4.4) with the minimum and maximum age of 15 and 40 years, respectively. The Mean (±SD) of family size was 3.63 (±1.47) with the minimum and maximum of 1 and 10 family sizes year, respectively. Majority, 97.8% (n = 440) of the respondents were married, and only, few respondents, 7.6% (n = 34) were illiterate. More than quarter, 27.8% (n = 125) of the partner education were secondary level, 22.7% (n = 102), and 44.7% (n = 201) partner education were primary and higher level, respectively. Moreover, significant proportion of respondents, 4.9% (n = 22) of partner education were illiterate.
More than half, 52% (n = 235) of the respondents were house wife, also less than quarter, 22.9% (n = 103) were government employed. The dominate religion in the study area, 55.6% (n = 250) of the respondents were protestant religion followers, followed by, 28% (n = 126) of Orthodox, 4.4% (n = 20), and 12% (n = 54) of were Catholic and Muslim religion, respectively.
Majority, 97.3% (n = 438) of the pregnant women had access of piped water, and followed by 1.8% (n = 8) of respondents had access of protected well. Moreover, 33.8% (n = 152) of the respondents had ventilated improved pit latrine and 33.6% (n = 151) of the respondents had pit latrine with slab, while the rest, 19.6% (n = 88), 13.1% (n = 59) of the respondents had pour flush toilet and open pit latrine, respectively.
About 25.1% (n = 113) of the respondents were in the lowest wealth quintile group, the rest, 24.9% (n = 112), 25.3% (n = 114), and 24.7% (n = 111) of the respondents were in second, middle and high wealth quintile group, respectively (Table 1).
Socio-demographic characteristics among pregnant women visited health facility for ANC in Sidama region, Hawassa town, Ethiopia, 2021 (n = 450).

Others*a = NGO, student.
Prevalence of under nutrition among pregnant women
Mean (±SD) of pregnant women nutritional status was 23.2 (±1.58). The over all of prevalence of under-nutrition among pregnant women was 27.6% [95% CI (22.6, 30.8)] (Figure 3).
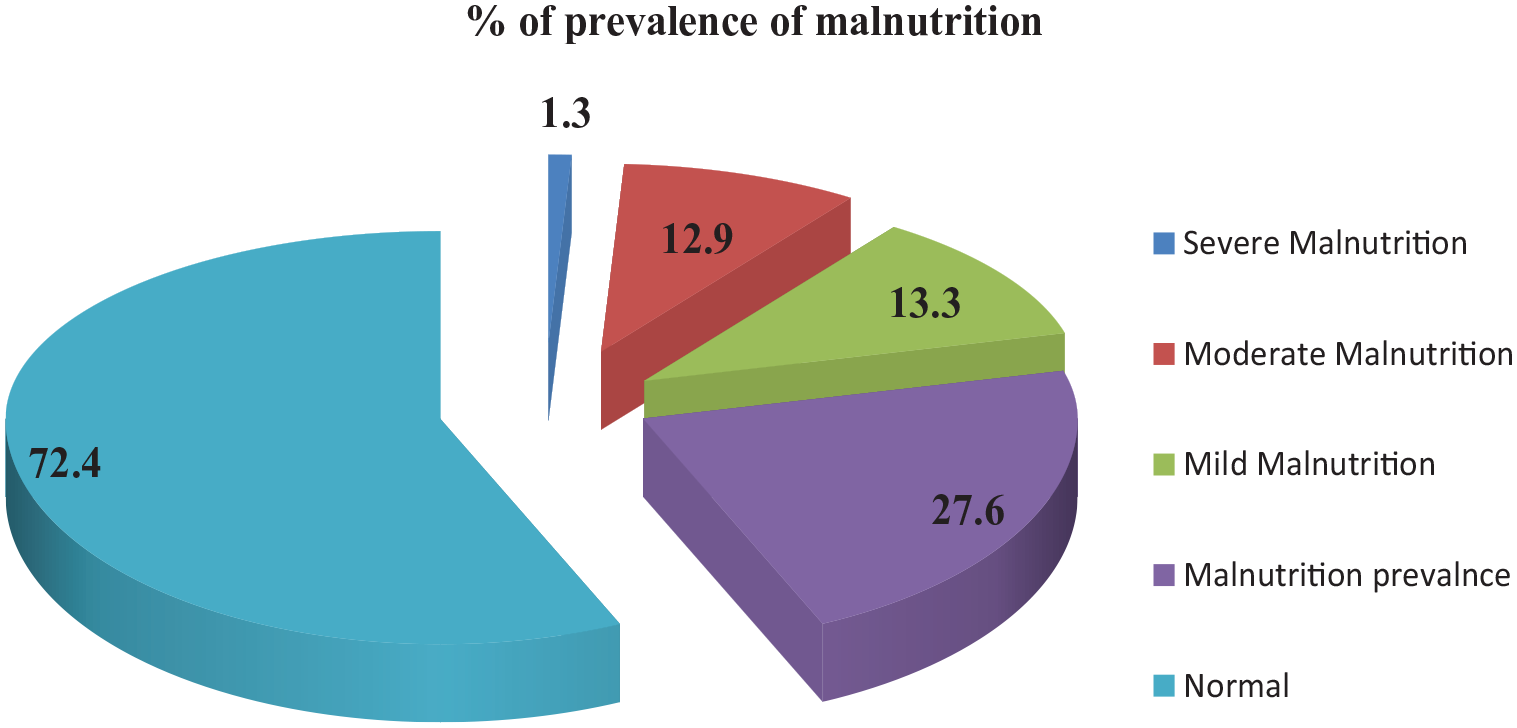
Malnutrition among pregnant women at Sidama region, Hawassa town, Ethiopia, 2021.
Maternal health and obstetric characteristics
Regarding maternal obstetric characteristics, around one-in-three 31.8% (n = 143) of the respondents were primi gravid. The mean (±SD) of number of pregnancy was 2.2 (±1.9) with minimum and maximum value of 1 and 6, respectively. Besides, more than quarter, 32.4% (n = 146) of the respondents had 1 live child. Concerning the trimester of the pregnancy, majority, 64% (n = 288) of the respondent were in second trimester. The mean (±SD) of gestational age was 25.4 (±7.2) with range of 28. Moreover, majority, 92% (n = 415) respondents planned and wanted the current pregnancy. Besides, large proportion, 93.8%(n = 422) of the respondents had taken iron folic acid supplementation.
Women dietary diversity level
Regarding to women dietary diversity level, about 13.8% (n = 62) of respondents were in the low dietary diversity group, almost near to half, 49.1% (n = 221) of the respondents had taken a diet in the group of moderate dietary diversity level and the rest, 37.1% (n = 167) of the respondent had grouped in to high dietary diversity (Figure 4).

Dietary diversity level among pregnant women at Sidama region, Hawassa town, Ethiopia, 2021.
Pregnant women food frequency characteristics
Researchers assessed the food consumption pattern of the pregnant women by using structured questionnaires, the result as shown in Table 3, about, 34.2% (n = 154) of the respondents had eaten flesh foods once in week, the rest, 25.6% (n = 115), and 18.7% (n = 84) of the pregnant women took flesh food in holidays and day off, respectively. Moreover, near to half, 49.3% (n = 222) of the respondents took dairy product (Milk and cheese) in 2 to 5 days/week, while the rest, 22.7% (n = 102), and 10.9% (n = 49) pregnant women ate milk product once a week and based on seasons, respectively.
More than quarter, 37.8% (n = 170) of the respondents ate egg food once a week, the rest, 25.3% (n = 114), and 15.3% (n = 69) of the respondents ate egg food on 2 to 5 days/week and based on season, respectively. Likewise, the large proportion, 38.2% (n = 172) of the respondents ate vitamin A rich fruits and vegetable on 2 to 5 days per week, while the rest, 34.2% (n = 154) and 17.8% (n = 80) of the pregnant women consumed vitamin A rich fruits and vegetables, respectively (Table 2).
Food frequency distribution among pregnant women visited health facility for ANC in Sidama region, Hawassa town, Ethiopia, 2021 (n = 450).

Hemoglobin level among pregnant women
Mean (±SD) of hemoglobin level among pregnant women was 12.3 (±1.03) with minimum and maximum values of 10 and 15, respectively. The overall prevalence of anemia among pregnant women was 16.2% [95% CI (13.25, 20.15)].
Factors associated with under nutrition among pregnant women
In order to identify contributing factors associated with under nutrition, bivariate and multivariate binary logistic regression analysis was used. The variables with P-value of <.25 in bivariate analysis were included in the subsequent multivariate analysis. The analyzed data were presented with crude and adjusted odds ratio (COR and AOR) with 95% of confidence interval (CI) by considering P-value of .05 to declare statistical significant association. During the bivariate analysis; wealth index, dietary diversity (DD), partner education, Latrine facility, water sources, beans and pea, nuts-seed, meat/fish, dark green leaf vegetable, and other fruits were candidate for multivariate regression, which was carried out in bivariate analysis, considered P-value of <.25.
In multivariate regression model, lower wealth quintile [AOR = 3.3, 95% CI (1.7, 7.0)], lower women with dietary diversity [AOR = 2.0, 95% CI (1.3, 4.0)], lower hemoglobin level [AOR = 10.7, 95% CI (5.8, 19.8)], lower pregnant women education level [AOR = 3.3, 95% CI (1.4, 7.9)], lower partner education [AOR = 3.1, 95% CI (1.1, 8.5)], flush/meat food [AOR = 2.8, 95% CI (1.7, 4.8)], and other fruits [AOR = 1.8, 95% CI (1.1, 2.8)] were statistically significant association with under nutrition among pregnant women.
Accordingly, pregnant women from the lowest wealth index were 3.3 times more likely to develop under nutrition when compared with high wealth income respondents [AOR = 3.3, 95% CI (1.7, 7.0)]. Pregnant women who were primary education level were 3.3 times more likely to develop under nutrition when compared to pregnant women from higher education level [AOR = 3.3, 95% CI (1.4, 7.9)]. Likewise, the odds of being under nutrition was 3.1 times higher among non-partner education group when compared with counterpart [AOR = 3.1, 95% CI (1.1, 8.5)]. Furthermore, the odd of being under nutrition was 10 times higher among mild anemia group when compared with the normal hemoglobin level [AOR = 10.7, 95% CI (5.8, 19.8)]. Furthermore, the odd of being under nutrition was 10 times higher among mild anemia group when compared with the normal hemoglobin level [AOR = 10.7, 95% CI (5.8, 19.8)]. The odds of being under nutrition was 2.8 times higher among non-meat consumers group when compared with meat consumers [AOR = 2.8, 95% CI (1.7, 4.8)], it had statistical significant association with under nutrition (Table 3).
Bivariate and multivariate logistics registration analysis among pregnant women in Sidama region, Hawassa town, Ethiopia, 2021 (n = 450).

AOR, adjust odd ratio; COR, crude odd ratio.
Indicate that, there is a statistical significant association with under nutrition.
Discussion
The over all, prevalence of under nutrition among pregnant women was 27.6% [95% CI (22.6, 30.8)], which was higher than the national demography and health survey report (22%). 7 The current study result is comparable with previous research study conducted in Malga district Southern, Ethiopia (26%) 27 ; evidence from Ethiopia (29%) 28 and in Africa 23.5%. 6 In contrast, the recent prevalence of under nutrition is lower than the previous study conducted in North, Tigray, Ethiopia (40.6%) 14 ; in Ethiopia (38%), 29 Jordan Syrian (49.2%) 30 and Konso district, southern Ethiopia (43.1%). 31 The possible justification for this could be study setting, sample size, socio-economic difference, and MUAC cut off point might bring discrepancy.
Besides, the current prevalence of under nutrition was relatively higher than the previous evidence documented in Northwest Ethiopia (14.4%), 32 in Dessie town, Northeastern Ethiopia (19.5%), 33 and Gondar Hospital, Northwest Ethiopia (16.2%). 34 The reason for this variation could be seasonal variation, MUAC cut off (they used MUAC < 21 cm) difference, and sociocultural difference may contribute for discrepancies.
In current study, contributing factors of under nutrition among pregnant women was also assessed and found out, lowest wealth quintiles, lower dietary diversity score (WDD), hemoglobin level, lower pregnant women education level, not consumed flush/meat food, not consumed beans and peas, and other fruits were contributing factors for under nutrition among pregnant women in Sidma region, Hawassa town.
Pregnant women economic status from the lowest wealth quintile was 3.3 times more likely to develop under nutrition when compared to with high wealth quintile. It had statistically significant association with under nutrition. This finding is consistent with other evidence documented anywhere.27-29 The likely justification for this could be household who have enough money (assets), they can purchase food and food item for the family to secure their food availability in the house, and also may have access for health care. So, investing in small and large income generating activity for women are very vital to improve the nutritional status in this study area.
In this study, in adequate intake of dietary diversity was statistically significant association with under nutrition, the odds of being under nutrition was 2.0 times higher among lower dietary diversity (LDD) ate pregnant women when compared with high dietary diversity (HDD) group [AOR = 2.0, 95% CI (1.0, 4.0)]. This study finding was supported by the previous evidence conducted by Ayele et al., 14 Getaneh et al., 28 Workicho et al., 29 and Dadi and Desyibelew 32 The possible reason for this could be, the pregnant women who usually ate mono food item may lack enough nutrients, as result, and they may develop under nutrition. Therefore, counseling pregnant women to eat home based diversified foods are important activities to improve the pregnant women nutritional status.
Moreover, the odds of being under nutrition was 10.7 times higher among lower hemoglobin group when compared with the normal hemoglobin level <11 g/dl [AOR = 10.7, 95% CI (5.8, 19.8)], it had statistical significant association with under nutrition. This finding is supported by the study conducted anywhere.31,32,34 The possible explanation for this could be, the recent evidence as shown as, when the pregnant women mid upper arm circumference (MUAC) level reduce also the hemoglobin level reduce, mean that, anemia is one type of malnutrition that result from different factors during pregnancy.
The pregnant women from lower education level were 3.3 times more likely to develop under nutrition when compared to pregnant women from higher education level [AOR = 3.3, 95% CI (1.4, 7.9)],it had significant association with under nutrition. This finding was comparable with existing evidence.14,29,34 The possible justification could be pregnant women, those who have high education level may have access to information for nutrition practice, and also may have opportunity for decision on income in the house to secure food item, and these could help them to improve the nutritional status.
In current study, the odd of being under nutrition was 2.8 times higher among those who didn’t consume flesh meat in their diet when we compare with counterpart [AOR = 2.8, 95% CI (1.7, 4.8)], it had positive association with under nutrition. This result was consistent with the previous study. 31 The possible reason could be, during pregnancy women nutrient needs increased because of their fetus development in the womb, and other reason could be due to lack of key nutrients in their diets that may bring deficiency of micro/macro nutrient consequently lead to under nutrition.
Strength and limitation of the study
Adequate and representative sample size used to respond the research objectives, moreover various data collection tools such as food frequency, dietary diversity, anthropometric, and hemoglobin were measured to determine under nutrition. However, this study was conducted at health facility level so that study participants may not represent the general population. Besides, 24 hours dietary diversity level needs respondents’ capacity of remembrance. Additionally, we did not triangulate qualitative data to explore pregnant women perception, also the current data collected at one season (from August 1 to September 30, 2021), we did not compare the other season.
Conclusion
In this health facility based study, a significant proportion of pregnant women were developed under nutrition (26.7%) and anemia (16.2%), which is a public health problem. Lowest wealth quintiles, lower dietary diversity score (WDD), lower hemoglobin level, lower pregnant women education level, not consumed flush/meat food, not consumed beans and peas, and other fruits were contributing factors for under nutrition among pregnant women. Therefore, counseling for dietary diversity during ANC, iron folic acid adherence, women education, and empowering women for small income generation activity were recommend to improve the nutritional status of the pregnant women in the study area.
Footnotes
Acknowledgements
Authors would like to appreciate Sidama regional health bureau for their facilitation for data collection at health facility level. All involved hospitals and health centers were greatly acknowledged. We would like to acknowledge midwifery, nurses and supervisors who took part in data collection at field.
Funding:
The author(s) received no financial support for the research, authorship, and/or publication of this article.
Declaration of Conflicting Interests:
The author(s) declared no potential conflicts of interest with respect to the research, authorship, and/or publication of this article.
Author Contributions
TA, TY, and TS contributed in conception, study design, data collection at field work, data analysis, and interpretation. TA and TS edited the manuscript, critically reviewed the manuscript. All authors read and approved the manuscript before submission.
Availability of Data and Materials
All data about the recent study are available in the hands of the corresponding authors on reasonable request.
Ethical Considerations
Ethical clearance was obtained from the Institutional Review Board (IRB) committee at the Pharma College of health sciences. Formal permission letter was ensured from Sidama regional health bureau and Hawassa town zone health department. A written and informed consent obtained from each respondent after describing the purpose and objectives of the study. All the information we collect, it was keep strictly confidential. The confidentiality was ensured through record code, would not ask respondent name and, data only allowed to access research teams. Participation in this study was completely voluntary. Those who were not willing to participate had the right to do so. At any stage of the study, they had the right to withdraw and stop the participation.
Operational Definitions
• Anemia: The World Health Organization (WHO) define hemoglobin levels for pregnant women: a hemoglobin level under 11 g/dl is mild anemia, a hemoglobin level between 7 and 10 g/dl with moderate anemia, and a hemoglobin level less than 7 g/dl with severe anemia. 35
• Dietary diversity: Dietary diversity scores are calculated by summing the number of food groups consumed by the individual respondent (pregnant women) over the 24-hour recall period. A dietary variety consisting of fewer than 3 nutritional categories/groups demonstrates minimum dietary diversity, a diet with between 4 and 5 nutritional groups comply with medium dietary diversity, while a variety of 6 or more nutritional categories demonstrates high dietary diversity. 25
• Under nutrition is a deficiency of essential nutrients. It is a condition consequential from inadequate food consumption to meet requirement for nutrients and calories. 20 In this study, under nutrition refer to inadequate intake of nutrients by pregnant women, which might occur due to various reasons. According to WFP, UNICEF and MOH Recommendation: MUAC < 23 cm consider as risk for nutrition. This study used a MUAC cut-off <23 cm as a measurement of under nutrition. 26