
Abstract
Background:
The rapid biological and physical changes during adolescence require adequate nutrient intake. This study assessed dietary diversity and nutritional status of adolescents living in selected rural areas in Ghana.
Method:
In this cross-sectional study, 137 young adolescents, aged 10 to 14 years were recruited. Structured questionnaire was used to collect data on sociodemographic, household size and food intake practices. A multiple past 24-hour recall was used to estimate the micronutrients intake. Haemoglobin and anthropometry data were assessed. Dietary diversity score was assessed with 10 food groups described by Food and Agricultural Organization. Descriptive, chi-square, binary regression and partial correlation were used in the data analysis.
Results:
The prevalence of underweight was 5.5%, overweight 5.8% and anaemia 29.9%. The mean dietary diversity score was 3.8 ± 0.8 and about 84.7% of participants had inadequate dietary diversity. Proportions of adolescents who consumed from the different food groups over a 24-hour period were: grains, white roots and tubers, plantain (100%); pulses (10.2%); nuts and seeds (34.1%); dairy (8%); meat, poultry and fish (86.9%); eggs (7.3%); dark green leafy vegetables (29.9%); other vitamin-A rich fruits and vegetables (2.2%); other vegetables (81%); other fruits (7.3%). Dietary diversity scores were positively and significantly correlated with intake of micronutrient, with correlation coefficients of .169, .186, .191, .173 and .175 for vitamin A, niacin, vitamin B6, iron and zinc, respectively. Meal skipping (AOR = 12.2, P < .001, 95% CI: 3.6-41.7) and snacking (AOR = 5.0, P = .007, 95% CI:1.6-16.7) increased odds of inadequate dietary diversity.
Conclusion:
The high prevalence of inadequate dietary diversity was positively related to meal skipping and snacking among adolescents. Dietary diversity score was significantly related to the intake of vitamin A, niacin, vitamin B6, iron and zinc. The prevalence of anaemia among our study participants is of public health concern. Adolescents should be encouraged both at home and school to eat from diverse food groups to promote adequate intake of micronutrients.
Introduction
Adolescence is the age range from 10 to 19 years.1,2 Adolescents set the foundation for adulthood, and undergo biological and physical changes that require optimal nutrition. 3 These changes are not limited to metabolism, skeletal growth, sexual maturation, menarche, lean and fat body mass, but are underpinned by adequate intake of macro-and micronutrients. 4 Adequate dietary intake of micronutrients such as calcium, zinc, iron, vitamin A, vitamin C, thiamine, riboflavin, niacin, vitamin B6, vitamin B12 and folate aids in efficient physiological functions and physical development in adolescents.4-8
Consistent consumption from diverse food groups or sources is required to adequately meet the intake of nutrients. According to the Food and Agriculture Organization (FAO), dietary diversity provides information about the quality of the diet an individual consumed from a variety of food groups the previous day or night. 9 High dietary diversity and healthy meal patterns indicate optimal nutrition as they positively influence the nutritional status of adolescents and vice versa.10-12 Studies among children showed that meeting the minimum dietary diversity was important in the protection against underweight, stunting and wasting.13-15 On the contrary, a high dietary diversity has consequently been associated with obesity. 16
A systematic review of adolescents living in low-and middle-income countries reported poor dietary intake from sources of food such as meat, fruits, vegetables and milk products, but, indulge in a nutrient-poor diet.17-19 Adolescents engaged in excessive consumption of starchy staples and low consumption of meat, milk and milk products and eggs. 20 These practices will implicate adolescents in the triple burden of malnutrition and also contribute to low dietary diversity. A low dietary diversity has been reported among the majority of teenagers living in Iran, India, Ethiopia and Malawi.11,21-23 Pregnant adolescents living in rural Ghana had higher inadequate dietary diversity compared to their counterparts in the urban areas. 24 Different studies showed that adolescents with low dietary diversity also had a higher prevalence of vitamin B12 deficiency, low serum zinc and anaemia.21,25-27
Factors such as gender, guardian educational status, large family size, poverty, rural living, food insecurity, food aversion and poor nutrition knowledge have been linked to inadequate dietary diversity among adolescents living in Pakistan, Ethiopia, Bangladesh, Algeria and Ghana.17,24,28-30
Ghana as an agrarian country uses the majority of its lands in rural areas for food crops production such as maize, yam, cassava, plantain, cocoyam, sorghum, millet, groundnut and beans, and livestock production of cattle, sheep and goat. 31 Do adolescents living in these rural communities in Ghana enjoy foods produced in these areas or are they shifting towards a micronutrient-poor diet? There are recommendations that attention should be given to the dietary diversity of adolescents living in rural areas.21,32 There is paucity of information about the dietary diversity of young adolescents living in rural Ghana. Hence the study aimed to assess the dietary diversity and nutritional status of adolescents living in rural communities in Ghana.
Materials and Methods
Study area, design and participants
The study was conducted in 2 rural communities namely Oborgu and Banka, which were randomly selected in the Asante-Akim South Municipality of Ghana. The predominant occupation of the people in the municipality is farming. Food crops mostly cultivated in the municipality are cassava, plantain, cocoyam, yam, rice and maize. The main domestic animals raised in the communities are sheep, goat and poultry (chicken). 33
About 83.1% of the population lives in the rural communities, and approximately 51% of the population are below the age of 20 years. 34 A multi-stage sampling method was used to select 137 healthy young adolescents (10-14 years) for this cross-sectional study.
Data collection
Questionnaire
Data on sociodemographic, household size and food intake practices (snacking and meal skipping) were collected using a structured questionnaire (both open and closed ended).
Dietary intake
A 24-hour recall was used to collect data on dietary intake (1 weekend and 2 working days). Data were collected on the time of food consumption (breakfast, mid-morning snack, lunch, mid-afternoon snack, dinner and bedtime snack), details of food, drink and the quantities.
The macro-and micronutrient intake was estimated from the multiple past 24-hour recalls. Food intake was estimated with the aid of food models and handy measures. The foods were converted to grammes and the nutrients were analysed with the nutrient analysis template from the University of Ghana. The Recommended Dietary Allowance (RDA) of energy (male: 2279 kcal/day; female: 2071 kcal/day), protein (34 g/day), carbohydrate (130 g/day), vitamin A (600 µg/day), thiamine (0.9 mg/day), Riboflavin (0.9 mg/day), Niacin (12 mg/day), Vitamin B6 (1 mg/day), Vitamin B12 (1.8 µg/day), Folate (300 µg/day), Vitamin C (45 mg/day), Iron (8 mg/day), Zinc (8 mg/day), and Adequate Intake (AI) of Calcium (1300 mg/day) and Sodium (1500 mg/day) were adopted from dietary reference intake. 35 Fat (not determined). The nutrients were categorized: Adequate mean intake met the cut-off of the dietary reference and inadequate mean intake did not meet the cut-off of the dietary reference.
Dietary diversity score
The Food and Agriculture Organization’s (FAO) Minimum Dietary Diversity for Women (MDD-W) was adapted to determine the adolescent’s dietary diversity. 9 The dietary diversity was made up of 10 food groups: grains, white roots, tubers and plantain; pulses (beans, peas and lentils); nuts and seeds; dairy; meat, fish and poultry; eggs; dark green leafy vegetables; vitamin A-rich fruits and vegetables; other vegetables and other fruits. Foods consumed in the past 24 hours were used to calculate the dietary diversity score. All ‘Yes’ responses were scored one (1) and ‘No’ responses were scored zero (0). The food groups consumed were summed into a score ranging from 0 to 10. The total dietary diversity score was 10; classified into adequate (5-10) [a score greater than or equal to 5 (⩾5) meant the participant consumed from 5 or more food groups] and inadequate (1-4) [a score equal to or less than 4 (⩽4) meant the participant consumed from 4 or fewer food groups].
Anthropometry assessment
The weight (kilogramme) and height (centimetre) of participants were measured twice on barefoot and the average was determined. The omron body composition monitor (Model: HBF 516; Omron Healthcare, Inc. 1200 Lakeside Drive, Bannockburn, Illinois 60015) was used to measure the weight and stadiometer (Model: HM 200P; Charder Electronic Co., Ltd, NO.103, Guozhong Rd, Dali Dist., Taichung City 412, Taiwan) was to measure the height. The BMI-for-age z-score (BMIZ) was computed using ANTHRO Plus defining underweight as (BMIZ <−2 SD), normal weight (BMIZ ⩾−2 SD to ⩽1 SD) and overweight (BMIZ >1 SD). 36
Haemoglobin determination
The participants haemoglobin (Hb) levels were determined by HemoCue Hb 301 analyzer (HemoCue AB, SE-26223, Ӓngelholm, Sweden). The mcirocuevette was filled with 10 µl of blood by capillary action. Excess blood on the cuvette was wiped with lint-free wipe. The microcuvette was checked for air bubbles and the open end was not touched. The cuvette was placed in the hemoCue and the results was shown approximately 10 seconds. The haemoglobin was documented. Haemoglobin level less than 11 g/dl was classified as anaemia as documented in the manufacturer’s manual.
Household size
In Ghana, the mean household size in rural areas is 4.4. 37 Based on this reference we categorized the household size into 1 to 5, 6 to 10 and greater than or equal to 11.
Statistical analysis
The Statistical Package for Social Sciences (SPSS) (IBM Corp. Released 2017. IBM SPSS Statistics for Windows, Version 25.0. Armonk, NY: IBM Corp) was used in the data analysis. Descriptive statistic was used to analyse the Dietary Diversity Score (DDS) and dietary diversity. Chi-square analysis was done to assess the association between sociodemographic, food intake practices, anthropometry indices, haemoglobin status and dietary diversity scores. Data were presented in means, standard deviation, frequencies and percentages. Binary logistics regression was used to predict inadequate dietary diversity. Partial correlation (r) tests were used to determine the relationship between dietary diversity scores and micronutrient intake. All P-values were significant at P < .05.
Ethical approval
The study was approved by the ethics review board of the Kwame Nkrumah University of Science and Technology, (reference number: CHRPE/AP/585/22), Ghana. After explaining the purpose, method and benefits of the study, informed consent and assent were given by participants and guardians, respectively.
Results
Sociodemographic, food intake practices and dietary diversity are presented in Table 1. The mean age of participants was 11.5 ± 1.1 and the majority of the participants were males (51.1%). A higher proportion of the participants had upper primary education (70.1%) and majority of the guardians had formal education (78.1%). The majority of the guardians were in the low-income bracket (73.0%). The majority of the participants living in a household size of 6 to 10 represented 60.6%. A large proportion 88.4% had a normal body mass index status while 5.8% each were overweight and underweight. The majority of the participants had normal (70.8%) haemoglobin level.
Sociodemographic, food intake practices, anthropometric indices, haemoglobin status and dietary diversity.
Abbreviations: BMI, body mass index; DDS, dietary diversity score, Inadequate (⩽4), Adequate (⩾5); JHS, junior high school; SD, standard deviation.
Chi-square (X2). N (%), frequency (percentage).
P < .05.
The mean dietary diversity score was 3.8 ± 0.8 and the majority of the participants fell within the inadequate dietary diversity category (84.7%). The associations between sociodemographic, haemoglobin status and dietary diversity showed that majority of the participants had inadequate dietary diversity. None of the association was statistically significant (P < .05) (Table 1).
In terms of frequency of meals, most of the participants who consumed food 2 (89.5%), 3 (85.6%) and 4 (76.2%) times per day had inadequate dietary diversity. None was statistically significant (P > .05).
A significant association was established between meal skipping (P = .033), snacking (P < .001) and inadequate dietary diversity. The majority of the participants who skipped meals (90.8%) and snacked (92.0%) had inadequate dietary diversity (Table 1).
Table 2 presents data on predictors of inadequate dietary diversity. After adjusting for age and gender, meal skipping (AOR = 12.2, P < .001, 95% CI: 3.6-41.7) and snacking (AOR = 5.0, P = .007, 95% CI: 1.6-16.4) had higher odds of inadequate dietary diversity.
Predictors of inadequate dietary diversity.

Abbreviations: NB, adjusted for age and gender; OR: odd ratios; β, beta coefficient.
P < .05.
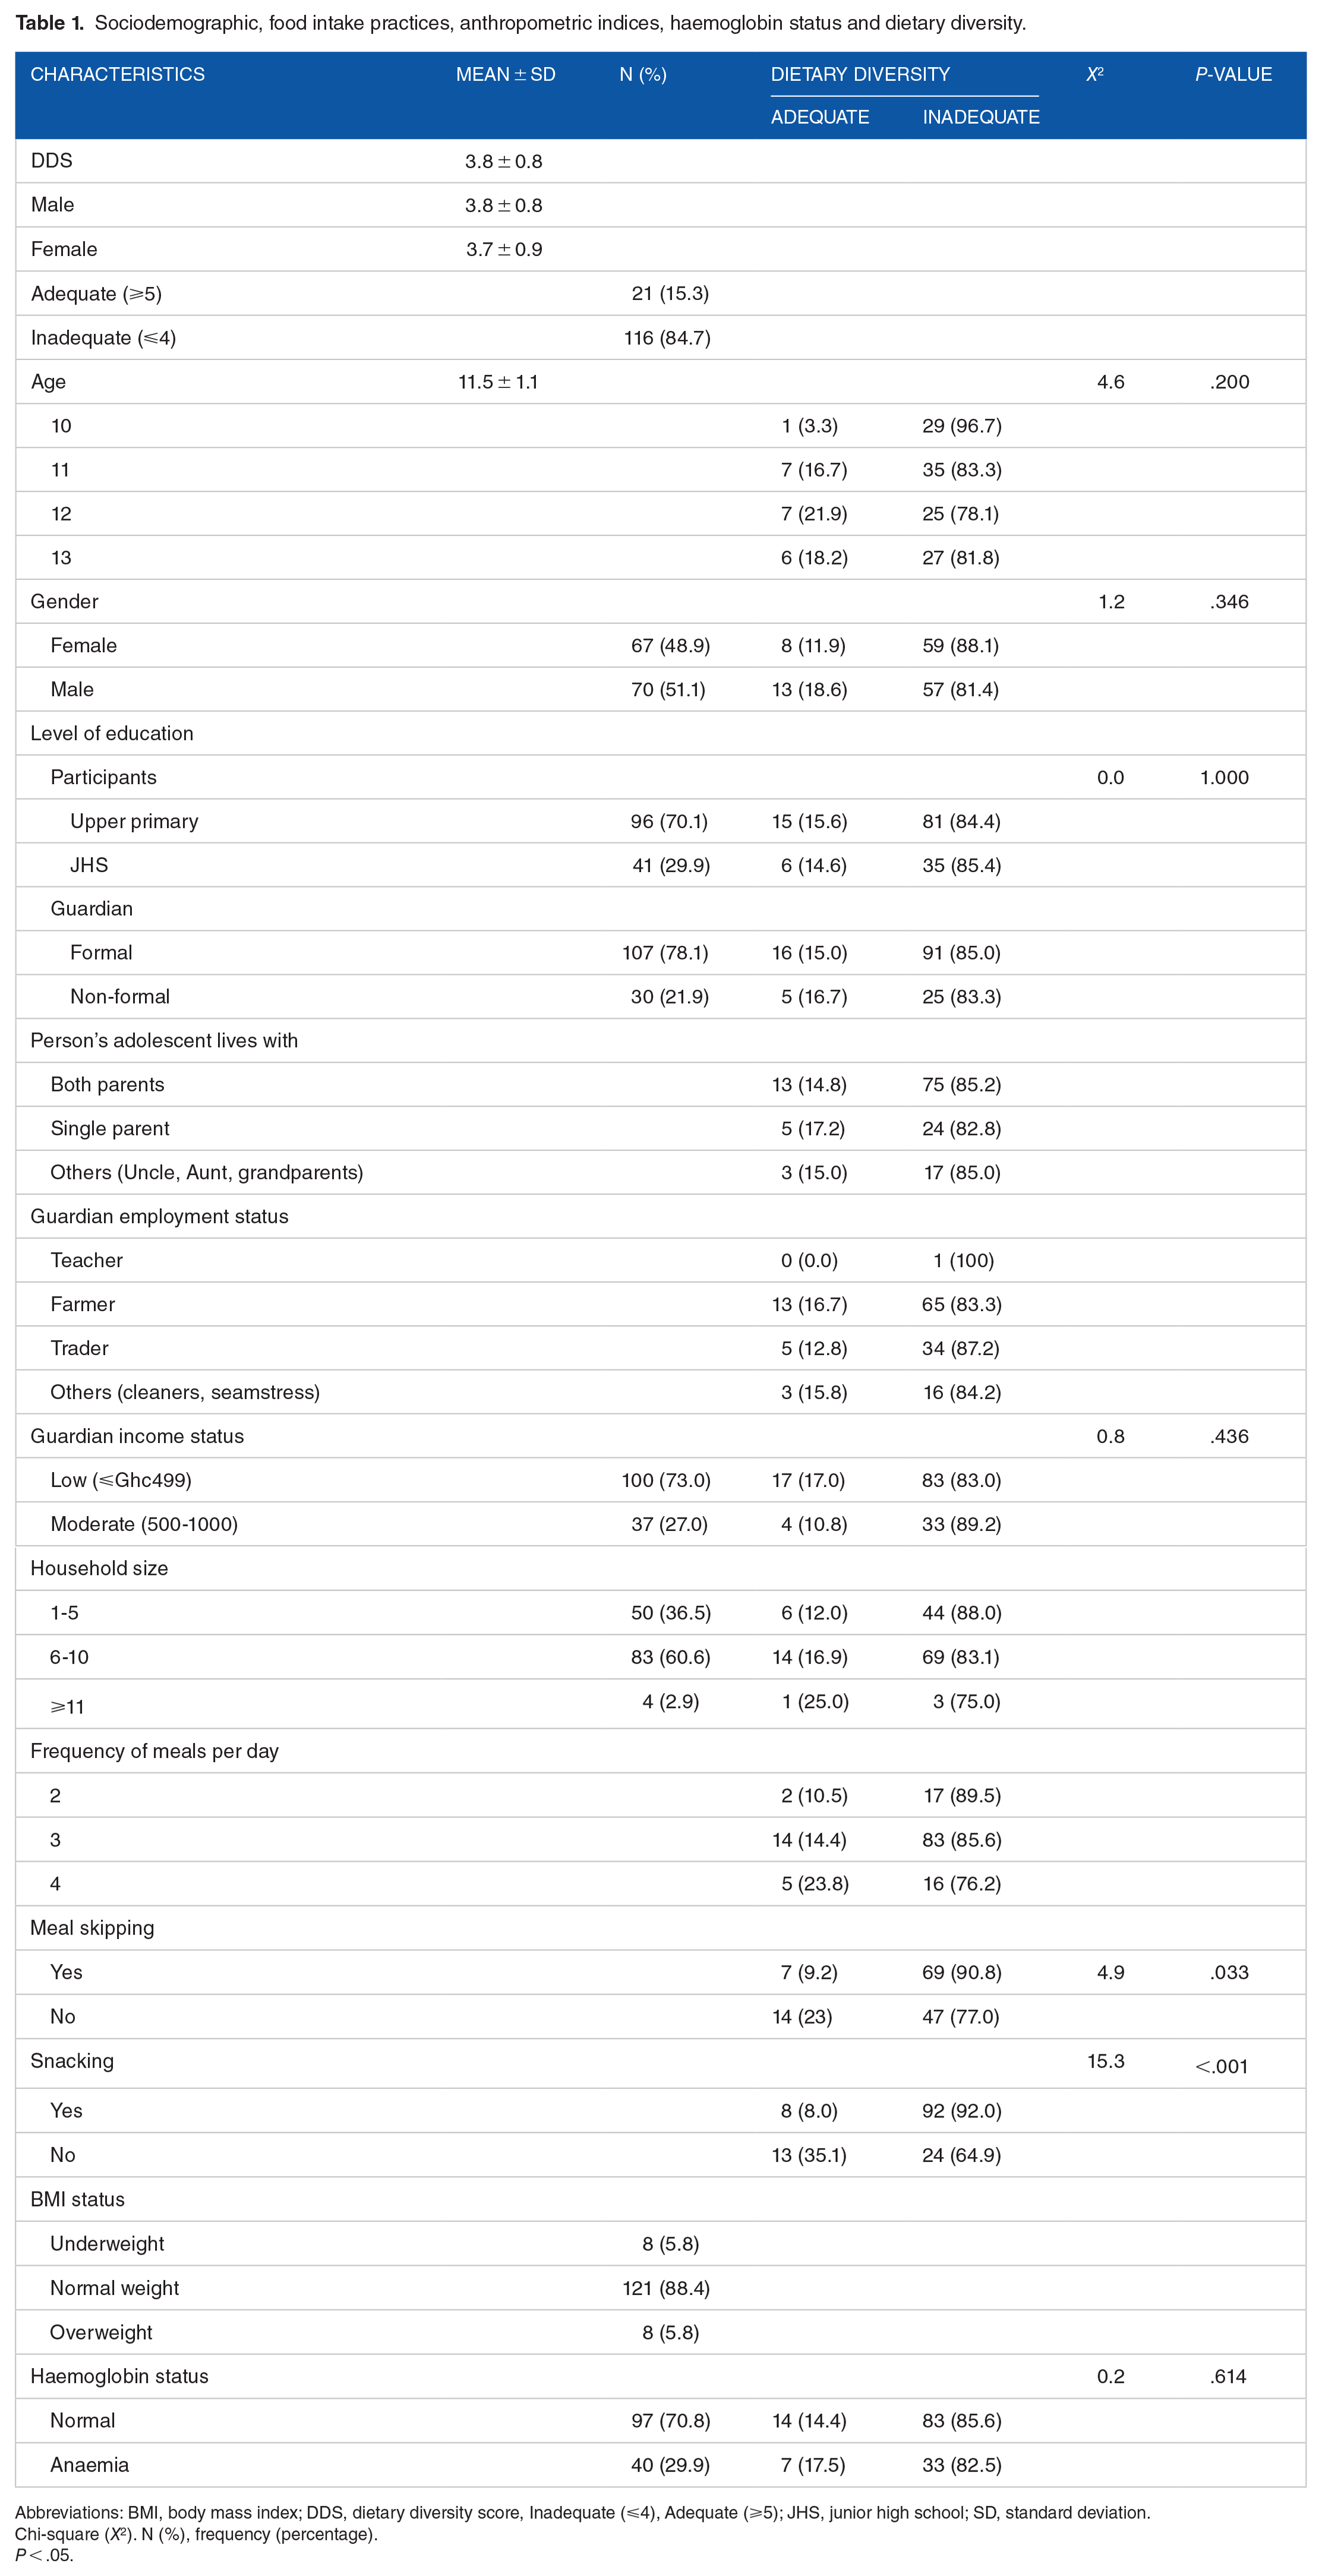
Proportions of participants consuming from the food groups are shown in Figure 1. The food groups consumed on the previous day were mainly: grains, white roots and tubers, and plantain (100%), meat, fish and poultry (86.9%) and other vegetables (81%). Less than 5 in 10 participants consumed nuts and seeds (43.1%) and less than 3 in 10 consumed dark green leafy vegetables (29.9%). Few participants consumed pulses (10.2%), dairy (8%), eggs (7.3%), other fruits (7.3%) and vitamin A-rich fruits and vegetables (2.2%).
Proportions of participants consuming from the different food groups.
The BMI status and dietary diversity is shown in Figure 2. The outcome of Chi-square showed that underweight (75%), normal weight (85.1%) and overweight (87.5%) had inadequate dietary diversity. The overall BMI status had an inadequate dietary diversity of 84.7%.

BMI status and dietary diversity.
The results showed that majority of the participants had inadequate intake of vitamin A (99.3%), thiamine (54.7%), riboflavin (81%), Niacin (51.8%), vitamin B12 (67.9%), folate (60.6%), calcium (99.3%) and zinc (86.9%). Likewise, the mean nutrient intake of participants was relatively lower than the recommended dietary allowances of vitamin A (179.7 ± 104.9), riboflavin (0.8 ± 0.6), vitamin B12 (1.7 ± 1.7), folate (296.8 ± 136.3), calcium (249.4 ± 190) and zinc (5.6 ± 2.4) except for thiamine and Niacin. The mean energy intake of male and female were 1593.3 ± 603.4 and 1474.4 ± 506.2, respectively. However, majority of the participants had adequate intake of protein (68.6%), carbohydrate (94.2%), vitamin B6 (82.5%), vitamin C (94.9%), iron (62.8%) and sodium (86.9%). Participants’ intake exceeded the recommended dietary allowances (RDA) or adequate intake (AI) of these nutrients as well (Table 3).
Estimated nutrient intake.

Abbreviations: SD, standard deviation.
Recommended dietary allowance: Energy (male: 2279 kcal/d; female: 2071 kcal/d), Protein (34 g/d), Carbohydrate (130 g/d), Vitamin A (600 µg/d), Thiamine (0.9 mg/d), Riboflavin (0.9 mg/d), Niacin (12 mg/d), Vitamin B6 (1 mg/d), Vitamin B12 (1.8 µg/d), Folate (300 µg/d), Vitamin C (45 mg/d), Iron (8 mg/d) and Zinc (8 mg/d).
Adequate Intake: Calcium (1300 mg/d), Sodium (1500 mg/d). Fat (not determined).
Adequate means intake met the cut-off of the dietary reference and inadequate means intake did not meet the cut-off of the dietary reference.
Frequency (percentage).
After adjusting for age and gender, partial correlation of dietary diversity scores and micronutrient intake showed significant relationship for vitamin A (r = .169*, P < .05), niacin (r = .186*, P < .05), vitamin B6 (r = .191*, P < .05), iron (r = .173*, P < .05), and zinc (r = .175*, P < .05) except for thiamine (r = .126), folate (r = .151), vitamin C (r = .143), calcium (r = .046) and sodium (r = .130). An inverse relationship existed between dietary diversity and riboflavin (r = −.023) (Table 4).
Partial correlation of dietary diversity score and micronutrient intake.

Abbreviations: DDS, dietary diversity score.
Controlled variables: age and gender.
Partial correlation is significant at the .05 level (2-tailed).
Partial correlation is significant at the .01 level (2-tailed).
Discussion
Dietary diversity provides information about the rate at which people eat from the different food groups. The different food categories provide a variety of macro and micronutrients needed for physiological and biological processes. Adolescents who consume food from several food groups are more likely to meet their nutritional needs and thus promoting their growth and development. The dietary diversity of adolescents is critical for their nutritional and general wellbeing. The study assessed the dietary diversity and nutritional status of adolescents living in rural communities in Ghana. The findings indicate that adolescents had low dietary diversity scores and the majority fell in the inadequate dietary diversity category. Meal skipping and snacking were the key predictors of inadequate dietary diversity. Inadequate micronutrient intake was observed among our study participants. A positive and significant correlation was established between dietary diversity score and micronutrient such as vitamin A, niacin, vitamin B6, iron and zinc.
The current study showed that majority of participants consumed food mainly from grains, white roots, tubers and plantain; meat, fish and poultry; and other vegetables. This outcome is similar to a report by Gyimah et al 24 on pregnant adolescents in Ghana. Excessive consumption of starchy staples has also been reported among rural youth in Nigeria, India and Malaysia.20,21,38 The high intake of starchy staples in this account reflected the high carbohydrate above the recommended dietary allowance. This agrees with another study that showed diets in rural Ghana are predominantly starch-based. 39 Although the mean macronutrient was high however the mean energy was lower than recommended. This may be due to meal skipping, large household size and low socioeconomic status.
Findings from this study showed a high prevalence (84.7%) of inadequate dietary diversity compared to that reported by (56%) Gyimah et al, 24 (69%) Walters et al 22 and (43.3%) Worku et al. 23 Participants in the current study are much younger than the others in the studies cited, and majority also had upper primary education which may have contributed to the difference observed. The large household size and low-income status of guardians may have also led to high inadequate dietary diversity in our study participants. Poor dietary diversity has been linked to low socioeconomic status.11,17,30 This outcome concurs with a study that indicated rural living increased the odds of inadequate dietary diversity. 24 Participants with anaemia and overweight also had higher inadequate dietary diversity. This outcome is contrary to the report that high DD score is associated with obesity in China. 16 The mean dietary diversity score (3.8) of the present study was lower than that documented in Ethiopia 23 (4.69), and Iran 11 (6.81). The difference might be due to scores assigned to the different responses by the different researchers and similar reasons stated above. This study also adds to the other studies that recorded low dietary diversity of adolescents.
The current study showed that meal skipping and snacking significantly increased the odds of inadequate dietary diversity. This is expected as meal skipping limits the possibility of eating from many different food groups. Adolescents have been reported to skip meals and snack on unhealthy foods as part of their dietary practices.40-43
Micronutrients are critical for the physiological functions of the body. Findings from this study showed inadequate intake of most of these micronutrients such as vitamin A, thiamine, riboflavin, Niacin, vitamin B12, folate, calcium and zinc. This could have resulted from the practice of meal skipping, snacking and high consumption of starchy staples. Snacking contributes more to carbohydrates, fat, sugar and salt with less valuable micronutrients.43,44 The poor micronutrient levels may be the throwback of the low dietary diversity score and high prevalence of inadequate dietary diversity. This was observed as 7 out of the 10 food groups was consumed by less than 50% of the participants. The food groups less consumed are rich sources of micronutrients. Adolescents with low dietary diversity score showed low intake of iron foods and also presented with iron, zinc and vitamin B12 deficiency.17,21,26,27
Dietary diversity scores were positively related to micronutrients such as vitamin A, thiamine, niacin, vitamin B6, folate, vitamin B12, vitamin C, iron, calcium, sodium and zinc. More importantly, a significant relationship was observed between dietary diversity scores and vitamin A, niacin, vitamin B6, iron and zinc. It implies dietary diversity is a good predictor of micronutrient intake.
Limitation of the study
The recall bias of the dietary methodology may lead to overestimation or underestimation of the food consumed in the previous days.
Conclusion
The majority of the young adolescents had inadequate dietary diversity. Meal skipping and snacking increased the risk of inadequate dietary diversity in our study. Dietary diversity scores were positively and significantly related to micronutrient intake. Adolescents showed inadequate consumption of most micronutrients and the prevalence of anaemia is of public health concern in our study. Governments and non-governmental organizations should prioritize nutrition education and promotion of healthy eating among young adolescents as it is the foundation for the different phases of the lifecycle.
Footnotes
Acknowledgements
Lawrence Dolyen Yamba, Godwin Opoku Agyemang, Nancy Elizabeth Tandoh, Georgina Benewaa Yeboah, Dorcas Fordjour, Anita Benewaa, guardians and participants are acknowledged.
Funding:
The author(s) received no financial support for the research, authorship, and/or publication of this article.
Declaration of Conflicting Interests:
The author(s) declared no potential conflicts of interest with respect to the research, authorship, and/or publication of this article.
Authors’ Contributions
Michael Akenteng Wiafe involved in conceptualization—supporting, formal analysis—supporting, investigation—equal, project administration—equal, writing original draft—equal.
Charles Apprey involved in data curation—equal, formal analysis—lead, supervision— supporting, visualization—lead, writing, review and editing—lead.
Reginald Adjetey Annan involved in conceptualization—lead, formal analysis—lead, investigation—lead, project administration—lead, supervision—lead, writing, review and editing—lead.
Data Availability Statement
Upon reasonable request, data for this study can be made available by writing to the Chairman, Committee on Human Research Publication Ethics, School of Medical Sciences, ethics review board of Kwame Nkrumah University of Science and Technology, Kumasi, Ghana or