
Abstract
The Ghana National Health Insurance Scheme (NHIS) seeks to provide access to quality healthcare to its members regardless of the health facility in which they receive care. However, it is unclear if all members of the Scheme receive quality care. The objective of the study is to examine the equity of perceived healthcare quality received by NHIS members depending on the type of facility in which care was provided. The study purposively sampled 2000 NHIS members who sought malaria treatment in the study areas. Only patients who had visited the health facilities at least twice not more than 12 months, before the data collection, were sampled. The SERVQUAL model was used to examine perceived quality of healthcare services in 5 quality dimensions: Reliability, Assurance, Tangibility, Empathy, and Responsiveness. These quality dimensions were compared in health facilities according to ownership (public, private, and faith-based facilities), capacity (hospital vs health centers), and finally location (urban vs rural health facilities). Instrumental variable estimation method was used to analyze data to address health facility selection bias problem. The results showed that faith-based health facilities scored the highest in all 5 perceived quality dimensions followed by public and private. Hospitals had higher score in perceived quality than health centers just as urban facilities scored higher in quality than rural facilities. These results represent high inequality in the perceived quality of care received by NHIS members.
Introduction
According to the World Health Organization, 1 quality of care refers to the ability of healthcare to provide the desired improved health outcomes to patients. Achievement of quality healthcare requires timeliness, safety, effectiveness, efficiency, equity, and people-centeredness in the provision of healthcare. 1 Quality healthcare then avoids delays, does not expose patients to health risks, follows scientific and evidence-based guidelines, respects patient’s preferences and culture without wasting available limited resources. Provision of such quality of care requires deliberate effort from health facilities to provide the needed management strategies and infrastructure. Equity in quality of healthcare received is important for the improvement in population health, and the achievement of universal health coverage.
The achievement of quality of care in a health system requires equity or no disparity in the quality of care received regardless of patient personal characteristics, geographical location, socio-economic status, 2 or health facility type. The existence of disparities in these areas represents inefficiency in the health system in the form of under-provision of healthcare quality. The inequities or disparities in healthcare across health facilities in a health system suggests that not all people of the same clinical needs are able to access adequate healthcare. High disparities in healthcare across health facilities then could weaken a health systems’ ability to treat basic diseases that affect the population it serves.
Inequity in quality is more likely to be driven by healthcare organizations rather than individual providers. 2 The management principles of healthcare organizations then could be an important determinant of quality of care provided by health facilities. Similarly, quality inequity could also be driven by the levels of capacity of health facilities. Thus, a gap could exist between the level of quality of a health post and a hospital. These imply that quality of care could vary across health facilities according to ownership type and/or levels of operations of health facilities. The purpose of this study is to examine equity in the quality of care received by members of Ghana National Health Insurance Scheme (NHIS), according to the type of accredited health facilities, in the Ashanti region of Ghana. Previous studies have examined equity in the quality of care received by NHIS members and non-members. 3 While any existing disparity in quality driven by NHIS status may be blamed on incentives, such as NHIS contracts with providers, that exist outside the health system, similar disparities among NHIS members must be driven by the inability of the health system itself to provide quality healthcare to the population. This is because the NHIS contract with providers is uniform across facility types. To the authors’ knowledge, no study has examined equity of quality of care received by NHIS members.
The Ghanaian health system was weakened by inequity in access to healthcare due to the introduction of user fee, referred locally as Cash and Carry, in 1985. 4 The “Cash and Carry” system undermined equity as the poor could not access quality healthcare.4,5 In 2003, the NHIS was introduced to provide access to healthcare for all. The introduction of the NHIS is a reform to eliminate the inequality in healthcare financing. Members of the NHIS receive healthcare from any NHIS accredited health facility which includes public, private, and faith-based health facilities which could also be further classified as hospital or health center. 6 However, eliminating financial barrier to accessing healthcare does not necessarily eliminate disparities in healthcare if disparities exist in the quality of care provided by various health facility types.
The question then is how equitable is the quality of care provided by these categories of health facilities. Specifically, are there disparities in the infrastructure, equipment, and human resource in these facilities? How does provider-patient relationship vary according to health facility type? Answers to these questions are important because significant disparities in quality dimensions in these health facility types could represent disparities in the quality of care received by NHIS members, thus weakening the Scheme’s ability to achieve its objective of universal health coverage.
The study was carried out in the Kumasi Metropolis, Ejisu-Juaben District, and Bosomtwe District in the Ashanti Region of Ghana. Ejisu-Juaben Municipality, and Bosomtwe District are rural while Kumasi Metropolis is urban. The Ashanti Region is the most populous of the 16 administrative regions in Ghana. The region has both rural and urban communities as well as the different types of healthcare facilities (public facilities, private for-profit facilities, and faith-based). The results from the study then could be a fair representation of the existence of any disparity in healthcare in the whole economy.
Measurement of Quality of Healthcare
Quality of care as defined above can be evaluated by patients based on their expectation of care to be provided. Patients can determine whether waiting time was long, treatment was effective, equitable, and people centered. If treatment is patient centered, patients would understand what is happening to them and what their rights are. 1 Thus, patients are important in providing input for the measurement of quality of care. Quality is therefore seen as the extent to which the customers or users believe the product or service surpasses their needs and expectations. 7 Quality is judged according to perceived satisfaction. According to Grönroos, 8 perceived quality is determined “by the gap between expected quality and experienced quality.” Grönroos 9 and Parasuraman et al, 10 have proposed that customer’s perception of service quality is based on the comparison of their expectations with their perceptions of the performance of the service provider.
Parasuraman et al, 11 developed the SERVQUAL model to assess customer perceptions of service quality in service and retail businesses. The model has five (5) dimensions of quality, namely Reliability, Assurance, Tangibility, Empathy, and Responsiveness. These are defined as follows:
Reliability: is the company reliable in providing the service? Does it provide as promised? Reliability reflects a company’s consistency and certainty in terms of performance. Reliability is the most important dimension for the consumer of services;
Assurance: knowledge and courtesy of employees and their ability to inspire trust and confidence.
Tangibility: how are the service provider’s physical installations, equipment, people, and communication material? Since there is no physical element to be assessed in services, clients often trust the tangible evidence that surrounds it when making their assessment;
Empathy: this is the capacity a person has to experience another’s feelings. Does the service company provide careful and personalized attention?
Responsiveness: are company employees helpful and capable of providing fast service? It is responsible for measuring company and employee receptiveness toward clients.
Since then, other quality assessment models have been developed and these include SERVPERF model, 12 SERVQUAL-P model. 13 Among the models, SERVQUAL model is extensively used,14-18 indicating its reliability over other models.
SERVEQUAL is the most common model used to measure healthcare service quality. 19 Many studies have shown patient dissatisfaction with health facility services based on the negative score of the difference between patient perception of service and their expectation in the various dimensions of quality. 20 The current study used the SERVQUAL model to examine equity in the quality of care received by malaria patients under the NHIS in Ghana.
Methods and Materials
Data analysis
Data analysis was in two (2) parts, namely descriptive analysis and econometric analysis. The descriptive analysis focused on the computation of the perceived healthcare service quality scores according to health facility types, using SERVQUAL Gap Model. The objective was to find the five (5) perceived quality dimensions as identified by Parasuraman et al, 11 —Reliability, Assurance, Tangibility, Empathy, and Responsiveness—in the NHIS accredited health facilities in the study. This study settled on SERVQUAL Model because, it has extensively been used to study quality of services; either in health facilities or any other service institution, indicating its high degree of validity and reliability over other models.15-18
To determine the perceived service quality gaps, this study followed Teas (1993) formula as shown in [1]:

where:
From the computations, positive score (+) is an indication of high-quality healthcare, while negative score (−) indicates low-quality healthcare. A positive score implies that the perceived quality care of the health facility exceeded the respondent’s expectation, while a negative score represents the opposite.
The second part of the analysis focused on factors, such as health facility types in which healthcare was received, as well as patient characteristics in affecting the perceived quality dimensions using Tobit method for estimation. The Tobit regression method was used because the numbers selected by respondents to represent their ranking of perceived quality dimensions represent their unobserved assessment of those quality dimension. Thus, if two (2) respondents select five (5) the highest score, for example, they may not have the same assessment of the quality dimension. Similarly, two (2) respondents selecting one (1) which is the lowest given score may have different assessments. The data is therefore censored and so Tobit regression is the appropriate method of estimation. The regression equation is as shown in [2].

where yi is a perceived quality dimension: Gap, X1i is a vector of 2 variables on demographic characteristics (age in years and dummy variable for female), X2i is a vector of dummy variables on levels of education: primary, secondary, and tertiary education, with no education as the control group; X3i is a vector of income and 2 dummy variables on marital status: married and previously married, with single as the control group. The variable X4i is a health facility location dummy variable for urban, with rural as the control group. Then, X5i is a dummy variable of facility type by capacity: hospital with health center as the control group. Finally, X6i is a vector of 2 dummy variables on ownership of health facility: faith-based, private, with public as the control group.
Equity in quality between health facility types is measured by comparing the statistical significance of the coefficients of the health facility type variables. Statistical equality of the coefficients represents equity in quality provided by those facility types, while statistical inequality represents the existence of inequity in quality of the facility types.
Endogeneity of Facility Type
The choice of hospital type, by ownership or capacity, is correlated with the severity of illness which also affects the quality ranking of a health facility, and so severity of illness should be in the regression equation. The severely ill are likely to select facilities expected to provide high quality care than the less severely ill. However, since there is no variable for the severity of illness in the regression equation, the health facility type variables: private facility, faith-based facility, urban, and hospital may be correlated with the error term, making them endogenous. The Durbin Wu test for endogeneity was used to test for endogeneity before treatment equations were estimated.
Instrumental Variable Estimation
As a solution to the endogeneity of health facility type in a quality-of-care model, Gowrisankaran and Town, 21 propose using distance from patient’s address to each of the health facility as instrument for health facility type. Since road conditions in Ghana are not uniform, using distance could lead to misleading results because a bad road for a short distance may have a longer travel time than a good road for a long distance. The current study therefore used travel time to replace distance in Gowrisankaran and Town. 21 Travel time was computed between each respondent’s area of residence and each health facility. The rationale is that travel time is a determinant of the choice of health facility and so the two are correlated. Since severity of illness can occur to anybody regardless of the travel time between area of residence and health facility, severity of illness is not likely to be correlated with travel time. Note should be taken that travel time here is not used to measure equity of quality but to correct the problem of endogeneity that exists in facility type variables which are used to measure equity.
The endogeneity of the variables of health facility type by ownership (Private and Faith-based health facilities) and by capacity (hospital) was therefore treated using instrumental variable estimation with travel time as instrument. The treatment equations are shown in [3]:

where j = 1, 2, 3 one for each of the problematic variables: private health facility, faith-based health facility, and hospital. The Zqis are the instruments, with q being equal to the number of instruments in each equation j. Four treatment equations were estimated, 1 for each of the problematic variables. The variable Dk represents all the other independent variables in [2]. Logistic regressions, which are non-linear, were used for the estimation of the treatment equations. As a result of the inclusion of non-linear regressions in the estimation the two-stage substitution approach was used for the estimation as the approach has been shown to produce more consistent results for non-linear cases than the traditional two-stage predictor approach.
Under the two-stage residual substitution approach the residuals from estimating the treatment equations are included in the perceived quality dimension equation as additional regressors. 22 The two-stage predictor approach however replaces the endogenous variables in the perceived quality dimension equation with the predicted variables from the treatment equations. Both approaches were run for comparison but the analysis focused on the residual substitution approach.
Data
The study used primary data in 2018 with a sample size of 2000 which was conveniently chosen in the absence of information of the population of active NHIS membership in the Ashanti region at the time. This sample size far exceeds the 385 that was computed using the population of 2 200 000 for 2019 using G-power with effect size of 0.1, power (1-β error prob.) of 0.95, α error probability of .0015. Given that the population of NHIS membership in the Ashanti region in 2019 exceeds that of 2018, the 2000 sample size used is therefore large enough and powered to answer the research question. The sampling technique was purposive sampling where NHIS members who sought malaria treatment in the study areas were sampled. Only patients who had visited the health facilities at least twice not more than 12 months, before the data collection, were sampled. This study focused on malaria patients because malaria remains the number one disease in Ghana. Malaria accounts for 30% of outpatient attendance and 23% inpatients admissions in all health facilities in Ghana. 23 This clearly shows that malaria patients account for the majority under the NHIS.
The primary data was collected through self-administered questionnaire. The questions for the quality dimensions asked respondents to choose on a scale of 1 to 5 with 1 being lowest score and 5 being the highest score. The questionnaire used was pre-tested on NHIS subscribers seeking malaria treatment in Kwabre East Municipality in the Ashanti Region. The questionnaire was reliable with overall Cronbach’s Alpha of .889 (α = .889) and valid based on content validity. The data collected were cleaned, coded, and entered into SPSS version 15 statistical software. Information collected included age, gender, household monthly consumption expenditure (as a proxy for income), marital status, level of education, type of health facility used, and town and area of residence. Information on travel time were collected by the researchers themselves after the data collection. The researchers traveled between each of the town or area of residence to each of the health facilities where respondents sought care. This was done to ensure accuracy.
Results
Descriptive analysis
The characteristics of respondents and facility visited are summarized in Table 1.
Descriptive statistics of respondents and facilities.
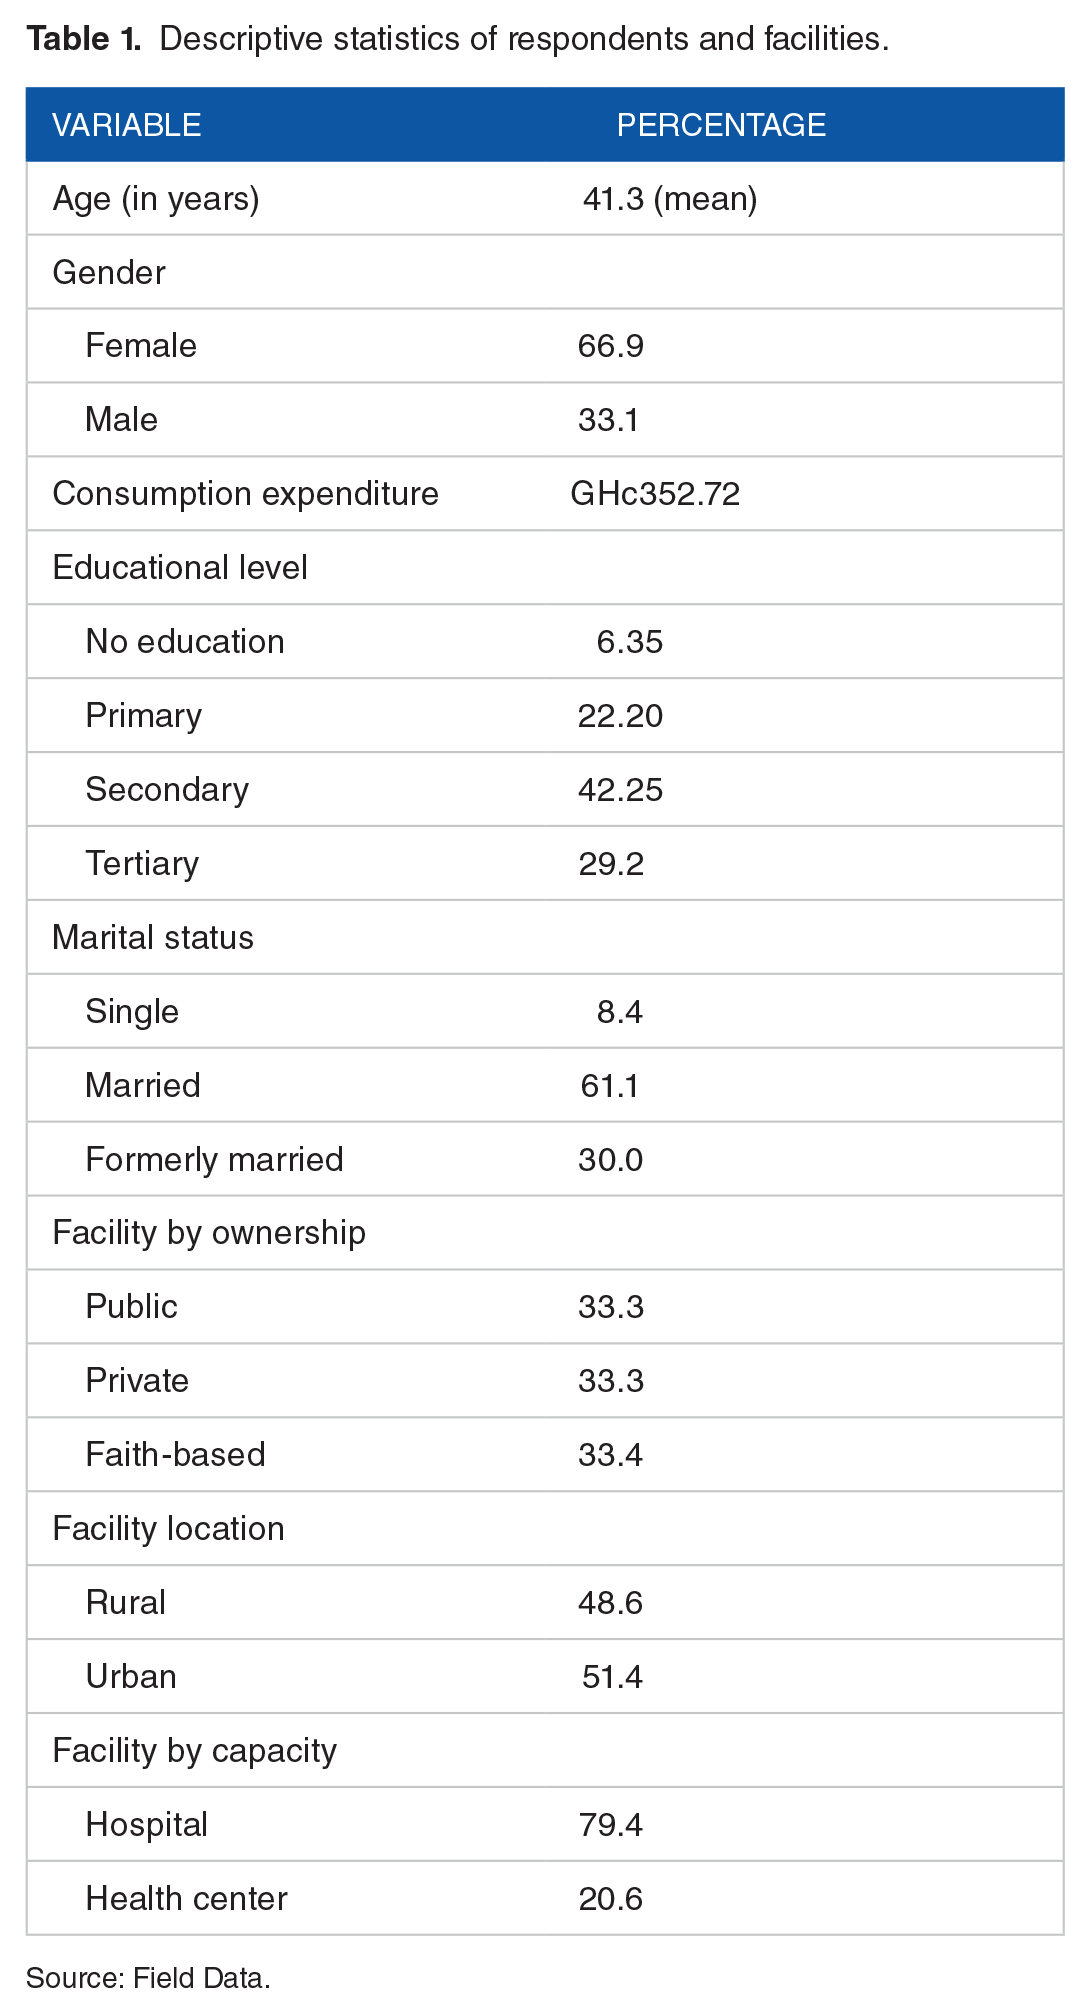
Source: Field Data.
Table 1 shows that females (66.9%) dominated over males seeking malaria treatment in the facilities sampled. The minimum and maximum ages were 16 and 79 years respectively with mean age as 41.3 years. The distribution of educational levels was primary education (22.2%), secondary education (42.3%), and tertiary education (29.2%). This suggests that majority (71.5%) of the respondents had post basic education. The ownership type of healthcare facilities was evenly distributed. However, majority of the facilities had hospital status (79.4%) than health center status (20.6%). The health facilities were almost evenly distributed by location: rural versus urban.
SERVQUAL gap analysis
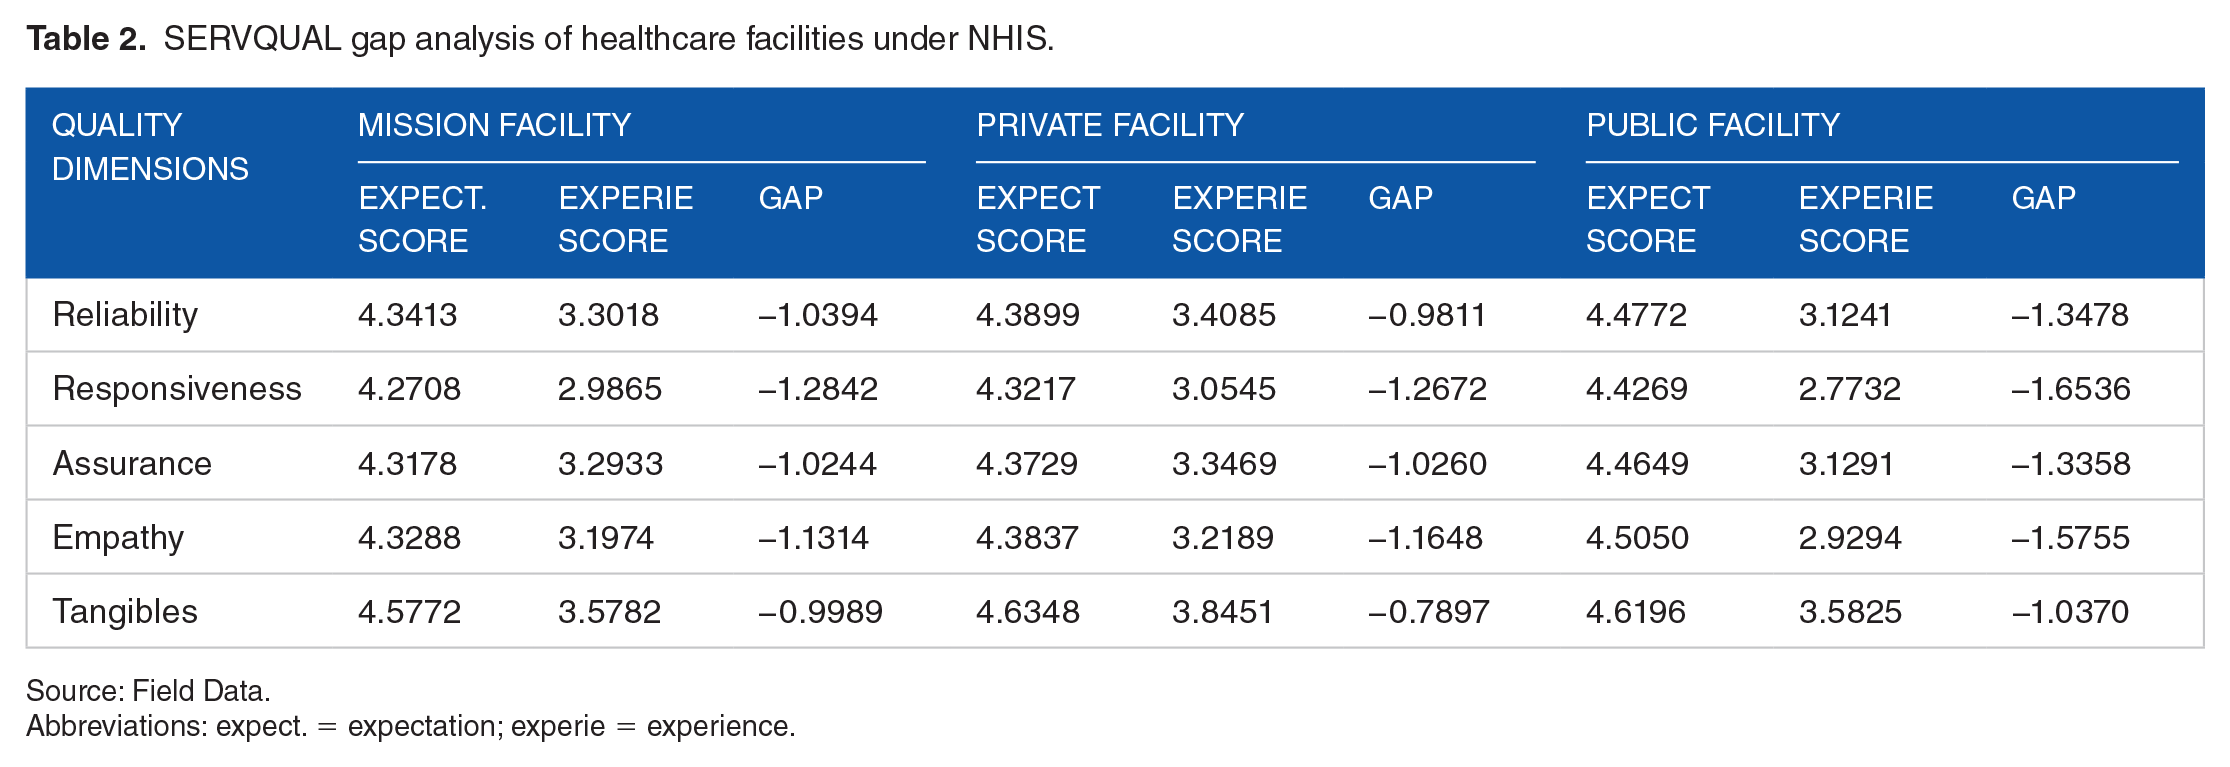
The expected healthcare quality, experienced healthcare quality and perceived quality gaps of faith–based hospitals, private hospitals and public hospitals under NHIS in the study area are summarized in Table 2. All the perceived quality gaps are statistically significant at 1% significance level.
SERVQUAL gap analysis of healthcare facilities under NHIS.
Source: Field Data.
Abbreviations: expect. = expectation; experie = experience.
The results in Table 2 show the average scores for each quality dimension according to facility type. It should be recalled that the scores given by respondents ranged between 1 (lowest) and 5 (highest). Table 2 shows that with the exception of tangibles, public facilities on average had the highest score in expectation in all dimensions of quality. The users of faith-based health facilities had the lowest expectations scores in all five dimensions of quality.
As already explained, the gaps were computed by subtracting the average experience score from the average expectation score. The lower the magnitude of the gap the more the perceived quality meets patients’ expectations. A negative gap means that the level of quality experienced by average patient was below the patient’s expectation, implying a poor performance of the health facility in the quality dimension. The results in Table 2 show negative average gaps for perceived quality in all health facilities types (faith-based, private, and public), suggesting higher expectation scores of perceived healthcare quality, relative to what was experienced, in all quality dimensions. In order to compare the gaps for the various health facility types, t-test was used for each quality dimension, to test for the equality of the gaps for the 3 health facility types. All average gaps for the various quality dimensions were found to be statistically unequal across health facility types, implying inequity in the perceived quality across health facility types. Given that all the average gaps are negative, a wide gap represents a low perceived quality for the health facility. For example, the average gap for reliability was −1.0394, −0.9811, −1.3478 for Mission, Private, and Public health facilities respectively. Even though the negative gaps represent a lower-than-expected quality level for all facility types, private facilities had the lowest magnitude while public facilities had the highest magnitude, implying private facilities scoring the best and public facilities scoring the poorest in reliability. Thus, public health facilities, having the largest magnitude negative gaps, performed poorest in all five perceived quality dimensions, as the high expectations were not well met. Faith-based health facilities scored the highest in assurance and empathy, while private health facilities scored highest in responsiveness, reliability, and tangibles. The variation (or inequality) in the perceived quality among health facilities imply inequity of quality among the health facilities types according to ownership.
Within each facility type, tangibility had the highest quality score while responsiveness had the lowest score. When compared across facility types, however, private facilities had the highest score (lowest average gap magnitude) in tangibility and responsiveness. The high perceived quality of private healthcare relative to public healthcare is consistent with other studies such as Mittal and Lassar, 14 Walker et al, 24 and Aljunid. 25 Nketiah-Amponsah and Hiemenz 26 and Agha and Do 27 also concluded that private facilities were superior to public sector facilities regarding physical infrastructure and availability of services. However, Bazant and Koenig 28 noted that urban dwellers were more satisfied than rural dwellers under private healthcare facilities.
The study further compared the perceived quality of healthcare delivery of rural and urban health facilities as shown in Table 3.
SERVQUAL gap analysis of health facility location and status under NHIS.

Source: Field Data.
The results in Table 3 show the perceived quality gaps which were all statistically significant at 1% significant level, with a t-test showing that they were statistically different from each other. Again, perceived quality gap was negative in all the dimensions and was wider in rural than urban facilities, implying perceived poor quality for all the facilities. This suggests that in a class of poor-quality healthcare delivery in NHIS accredited health facilities, health facility users in urban communities perceived better quality of care than their rural counterparts. Hospitals had higher scores in perceived quality in all five dimensions, despite the negative scores, than health centers. The results thus show that facility status matters in perceived quality delivery of care under NHIS. Again, the inequality of the magnitudes of the perceived quality gaps represent inequity in quality across facility types according to their location and capacity (hospital vs health center).
Results From Tobit Regression
The results of the Durbin Wu test showed that the facility type variables: private health facility, faith-based health facility, and hospital (rather than health center) were endogenous as the T-test showed that the residuals from the treatment equations were statistically significant in the perceived quality dimensions regression equations. Results from the two-stage predictor approach are reported in Table 4 to aid comparison with the residual substitution approach. For each of the regression type, five regressions were run, one for each perceived quality dimension. Both Tables 4 and 5 report the coefficients of the independent variables and the P-values to show the statistical significance at 5% significance level.
Coefficients from the Tobit regressions results for the 2-stage predictor approach.

Coefficients from the Tobit regressions.
Coefficients from the Tobit regression results of the 2-stage residual substitution approach.

Coefficients from the Tobit regressions.
The results from both the two-stage predictor and the two-stage residual substitution (in Tables 4 and 5) show that age is not statistically significant except in Assurance and Reliability (in the case of two-stage predictor) where there is a positive relationship. The coefficients of female were negative and statistically significant for all quality dimensions regardless of regression estimation used implying that females had lower perception of quality than males for all quality dimensions. Education and marital status generally did not affect any of the quality dimensions. However, Table 4 shows that patients with tertiary education had negative and statistically significant coefficients for Responsibility and Empathy implying that patients with tertiary education had higher expectation of the two quality dimensions than what they experienced compared to the uneducated. These variables on gender, age, education, and marital status are all control variables and are not the focus for the study. The variables below are the focus of the study.
The existence of equity in perceived quality was determined by the statistical significance difference among the coefficients of the variables for facility. Statistical insignificance of the difference between 2 coefficients implies equity in perceived quality for the 2 facility types. For both 2-stage estimations, for example, the results showed that there was no statistically significant difference in the perceived quality dimensions between private and public health facility types except for Tangibility. This implies that with the exception of Tangibility, there is equity of perceived quality in public and private health facilities for the various dimensions of quality. However, with the exception of Tangibility, faith-based health facility types had the highest score for all the other quality types. The positive coefficients for faith-based health facilities imply that on average as one moves from public facility (the control facility) to faith-based facilities the perceived quality increases regardless of the quality dimension. This represents inequity in perceived quality between faith-based health facilities on one hand and public and private health facilities on the other hand. Similarly, hospitals scored higher than health centers for all perceived quality dimensions, under the 2 methods of estimations. Again, both methods of estimation show that health facilities in urban areas had a higher score than those in rural areas for all perceived quality dimensions. There is thus inequity in perceived quality between hospitals and health centers, as well as between urban and rural health facilities, after controlling for respondents’ characteristics. Since the results from the 2-stage residual substitution, with 500 replications bootstrap robust standard errors are more consistent than the 2-stage predictor, 22 the rest of the analysis focused on the residual substitution estimation. The results from the 2-stage residual substitution are reported in Table 5.
Table 5 shows that a patient who received care from a private health facility rather than a public health facility perceived a fall in Tangibility by 0.339 (P-value = .00) points, holding all other variables constant. Similarly, a patient who received care from a faith-based facility rather than a public facility perceived a higher Reliability by 0.416 (P-value = .00) points, a higher Assurance by 0.450 (P-value = .00) points, a higher Empathy by 0.655 (P-value = .00) points, and a higher Responsiveness by 0.402 (P-value = .00) points. Patients who sought care from hospital (or urban area) perceived higher quality in all five dimensions than those who sought care from health centers (or rural areas). All these results imply inequity in perceived quality between the various quality dimensions among the health facility types. With the exception of Tangibility, the results showed no statistically significant difference between public and private health facilities for all perceived quality dimensions, implying equity in perceived quality for the 2 facility types in the quality dimensions.
The study further estimated the Tobit model for factors that determine combined perceived quality of care received by the outpatients as shown in Table 6.
Factors that affected perceived quality of care under NHIS in the study areas.

Table 6 shows the results from averaging the scores of the five dimensions of perceived quality as a dependent variable while maintaining the independent variables. The results show that combining all perceived quality dimensions, there is no statistically significant difference between quality in private (coefficient = −.157, P-value = .19) and public health facilities, implying equity in perceived quality in the two facility types. Perceived quality in faith-based health facilities were 0.369 (P-value = .00) points higher than those in public and private health facilities. Similarly, quality in hospital was 0.357 (P-value = .00) points higher than that of health centers; just as quality in health facilities located in urban areas was 0.460 (P-value = .00) points higher than those in rural areas. These results then imply inequity in perceived quality in the relevant health facility types.
Discussion
The results have shown that with the exception of Tangibility, patients had the highest expectations in all the dimensions of perceived quality in public health facilities. This implies that the customers of public facilities had the highest expectations of the facilities ability to provide adequate services within an acceptable time, by caring and empathetic health workers, who are capable of inspiring trust and confidence in their patients even if they are not fully stocked with all needed resources. These results are similar to Campos et al, 29 which showed that patients’ expectations of quality in public health facilities were rated by providers as being exaggerated. Even though the results in the current study may not be rated as an exaggeration, such high expectation could be driven by the populace expectation of the capability of government to provide quality care to patients.
The average difference between expectation and perception was negative for all perceived quality dimensions. The negative gap was referred to in Khamis and Njau 30 as dissatisfaction. This is consistent with Parasuraman et al, 11 that patient’s expectation most often exceed the actual service received and this signifies that there is always the need for improvement in perceived quality of healthcare delivery. However, the gaps differed according to health facility ownership, capacity, and location, representing inequity in the perceived quality of services received by NHIS members from health facilities.
The responses on the performance of health facilities are subjective and hence affected by gender, age, and economic status of the respondents. It is therefore important to control for such variables before using data for perceived quality analysis. Studies such as Campos et al, 29 Yip and Berman, 31 and Anh 32 that used descriptive statistics to analyze data did not purge the effect of patients’ characteristics on the quality scores. Their results then may be correlated with patient characteristics and so are less objective. The current study showed that before controlling for other factors that affect peoples’ response to perceived service quality, private health facilities scored high in Reliability, Responsiveness, and Tangibility. The study would have concluded that patients who visited private health facilities were most satisfied with waiting period, effectiveness of treatment, and availability of inputs for service provision. However, after controlling for demographic and economic status of patients the results showed that there was no statistically significant difference between private and public facilities in Reliability, Responsiveness, Empathy, and Assurance. Private health facilities even scored lowest in Tangibility. The results from the current study can be used to objectively rank the performance of the different health facility types.
An F-test was used to test for the equality of the coefficients in the hospital types of the results in Table 5 and the null hypotheses were rejected. This confirms that faith-based health facilities scored the highest in all perceived quality dimensions except Tangibility. Among the 4 perceived quality dimensions that faith-based scored high in, Empathy was the highest, followed by Assurance, Reliability, and Responsiveness. Thus, faith-based health facilities performed much better than the other facility types in providing careful and personal attention to patients. Health workers in faith-based health facilities were more able to instill trust and confidence in themselves, making patients comfortable in the facility, hence the high score in Assurance. Patients who visited faith-based health facilities also found the facilities reliable in providing the required services to patients. Finally, the high score in Responsiveness, implies that faith-based health facilities were more capable in providing services faster than the other types of health facilities. Faith-based health facilities are mostly founded on religious values such as love, care and sympathy. The managements or administrators transfer these key foundation values from staff to staff and daily administrative activities are guided by these values. Dotsey and Kumi 33 found in Ghana that what makes faith-based health facilities unique and different is that religious beliefs play a key role in faith-based health facilities employees’ daily administrative activities and field operations, with the employees often perceiving healthcare as a religious act. These religious values are implicit in the principles of Empathy, Assurance, Reliability, and Responsiveness. 33 Similarly, Ware et al 34 noted that religious beliefs motivate health professionals and health facilities to engage in provision of healthcare based on ethical ground and a sense of calling to engage in development. These results are similar to Porter and Bresick 35 which found that health workers in faith-based health facilities were respectful, friendly, and sympathetic to patients in facilities in Demographic Republic of Congo and South Africa.
Hospitals also scored higher in all perceived quality dimensions than health centers with the gap being widest for Tangibility and closest for Empathy. The high score in Tangibility implies that patients who visited hospitals found the surroundings to be visually appealing, clean, well equipped, and health workers neatly dressed. There was better availability of health workers to speed up services in hospitals than in health centers, implying a higher score in Responsiveness. Again, the high score in Assurance implies that health workers in hospitals were more knowledgeable and treated patients with respect compared to health centers. The reason for the higher perceived quality of care in a hospital relative to a health center could be due to the difference in the levels of healthcare provision in the two health facility types. Health centers are at a lower level of care provision than hospitals and so a health center is limited with regard to its ability to handle complicated cases. Hospitals are referral facilities to health centers and so are capable of handling cases at the level of health center and beyond. Hospitals are therefore better equipped in terms of personnel and other resources for treatment than health centers. High level care providers may be better trained in handling patients than lower-level healthcare providers.
The results also indicate that location significantly influenced the perceived quality of care received by the outpatients receiving malaria treatment within the study area. The urban dwellers were significantly more likely to receive higher perceived quality malaria treatment in all five quality dimensions than rural dwellers. Such results are driven by the generally deprived conditions in rural areas compared to urban areas in Ghana. Health workers in rural areas are demotivated by lack of basic resources such as potable water and electricity. All these contribute to lowering the perceived quality of care provided by rural health facilities.
Conclusion and Policy Implications
National Health Insurance might have helped to remove inequity in access to care (ie, financial barrier to care) but not inequity in quality of care. The current study used SERVQUAL model to evaluate quality of healthcare services on five perceived quality dimensions—Reliability, Assurance, Tangibility, Empathy, and Responsiveness—for outpatient malaria treatment provided in rural and urban areas in the Ashanti region of Ghana. The study examined variation in quality based on health facility type by ownership, capacity, and location. The results revealed significant inequality in the perceived quality of care received by NHIS patients who sought outpatient treatment for malaria. Patients who received treatment from faith-based hospitals in urban areas were most likely to receive the best quality of care in all five quality dimensions. However, patients who sought care from private health facilities and health centers in rural areas were likely to receive the poorest quality in all five quality dimensions. The study has also shown that patients had the highest expectation in quality of care from public health facilities in all quality dimensions examined. In order to obtain consistent results, the study used instrumental variable estimation to compare the quality differences among facility types. Such an approach is likely to produce consistent and objective comparison of perceived quality of healthcare in the health facilities.
The study recommends that private facilities be given more monitoring to ensure they are properly equipped and appropriately staffed. Both public and private facilities require improvement in patient-provider relationship, and capability in the provision of care at adequate speed to ensure the provision of patient-centered care. Health centers and rural facilities should be equipped with needed equipment and tools, experienced healthcare professionals who have patients at heart to ensure improvement in all the five quality dimensions examined in the study. Both private and public health facilities should learn from faith-based health facilities by integrating sound religious values like love and care for humanity into provision of healthcare services. These religious values should form the basis of care in all private and public health facilities as faith-based health facilities are doing.
This study had one key limitation. The study focused on only malaria patients under NHIS who had visited the health facilities at least twice not more than 12 months. Thus, the outcomes of study may not reflect entire views of patients under NHIS as at the time of data collection. Notwithstanding, malaria patients presents the greater proportion of patients who visit health facilities in Ghana and so high quality of care for malaria patients could imply high quality of care for other patients as well.
Footnotes
Author Contributions
EA was part of the conception of the idea, did the econometric analysis, wrote most of the paper, responded to all reviewers’ comments and proof read the paper. SA conceived the idea with EA. SA collected the data that was used for the analysis, and did the descriptive analysis using the SERVQUAL gap model. PA restructured the article to be consistent with Health Services Insight, SAGE, responded to reviewers’ comments and proof read the paper.
Declaration of Conflicting Interests:
The author(s) declared no potential conflicts of interest with respect to the research, authorship, and/or publication of this article.
Funding:
The author(s) received no financial support for the research, authorship, and/or publication of this article.