
Abstract
The Omo River flows through the town of Omorate, where domestic, municipal, and industrial wastes from the town and its surroundings, including agrochemicals, are discharged into the river. The present study was conducted to determine the levels of heavy metals and associated environmental and human health impacts from the Lower Omo River freshwater ecosystem (water and sediment) of the Lower Omo River. The mean concentrations of heavy metals detected in the river water were 0.439 mg/l for (Mn), 0.1 (Zn), 0.168 (Cu), 0.393 (Cr), 0.318 (Pb), 0.007 (Ni), 8.926 (Fe), and 0.06 (Co).The order for the mean concentrations of the heavy metals in the water was Fe > Mn > Cr > Pb > Cu > Zn > Cu > Co > Ni. The HPI value indicates that all water sampling sites were highly contaminated. Oral and dermal HQs for both children and adults were in the order of Cr > Pb > Mn > Fe > Cu > Co > Ni > Zn. The HQ value greater than 1 was investigated for Cr, Pb, and Mn in both children and adults by ingestion and dermal routes from the river water. The CRs for both children and adults by ingestion of the river water followed the order Cr > Pb. According to the CRI value, the river water could be classified as a very high environmental risk. The EI results for the heavy metals detected in the sediments also followed the order: Fe > Cr > Cu > Pb > Mn > Co > Zn > Ni.
Introduction
Fresh water is a vital resource for all life forms. 1 Heavy metal contamination in surface waters and sediments is currently a global environmental and public health concern. The river ecosystem is the most important factor in sustaining human life. 2 The water quality of rivers is very important because rivers are generally used for domestic water supply, agriculture (irrigation), and other human purposes. 3 However, their quality is threatened by ecological degradation and pollution. 4 Various organic and inorganic pollutants are released into aquatic systems from natural and anthropogenic sources in aquatic systems. 5 Pollution of river water bodies can occur due to the discharge of domestic and industrial wastewater, chemicals used for agriculture, solid waste and drainage from the land surface. 6 The mobilization of these pollutants can alter the physicochemical properties of water, which can be toxic to aquatic organisms and humans through the food chain. 5 Among these pollutants, heavy metals play an important role in environmental pollution due to their toxicity, bioaccumulation and biomagnification in the food chain.5,7
In developing countries, clean and safe water is a major concern. 8 Despite the importance of ensuring the quality of drinking water, little attention has been paid to water quality monitoring in developing countries such as Ethiopia.6,9 The Omo River Basin is a vital resource for the people of southern Ethiopia.10,11 Although the quality and heavy metal contamination levels of this freshwater are not yet reported, it is an important source of water for domestic use, agriculture (irrigation), and livestock.
In recent years, the Omo River has experienced rapid industrial development of industry and intensive agriculture along the river and its catchment, especially upstream in the Omo Delta.10,11 Large-scale irrigation development, industry and land use changes in the upper and middle Omo Basin in recent years have already resulted in environmental changes in the lower Omo River Basin ecosystem. 12 It has been inevitably been altered by the rapid development of industry and agriculture in its catchment. 12
The development of irrigation and agriculture in general in the Omo River Basin has led to increased use of fertilizers and pesticides. More than 30% of the upstream flow of the Upper Omo is diverted for irrigation. 13 Based on evidence from other irrigation projects, large-scale irrigation development in the Lower Omo could have a significant impacts s on aquatic resources and water chemistry due to agrochemicals and increased nutrient levels, leading to the destruction of aquatic biota. 13 Experience from with similar projects has also shown that appropriate amounts of fertilizers and pesticides are not being used, which can lead to excessive chemical runoff. 14 This inappropriate use of agrochemicals can have potential negative impacts, including degradation of downstream water quality, increased ecosystem fragility, and harm to humans and livestock. 12 Human activities may be the source of chemical pollution in the lower Omo. This includes waste discharges from sugar factories, chemicals from construction projects (such as hydroelectric dams), and oil spills.13,14
Basically, studies and research results are important to contribute some valid knowledge for the well being of the society and for the advancement of the society about the quality of water. The aim of this study was to determine the pollution level of heavy metals and the associated environmental and human health risks in the lower Omo River, Southern, Ethiopia. According to review literatures, there were a few studies have been conducted in Omo River, on the level of heavy metal concentration in Omo River; and, that are found on one selected kebele (such as Mahendo) is not used Omo River for drinking purposes because of unpleasant taste, odor, and color. Therefore, all these might also facilitate the researcher to conduct these studies regarding the concentration level of heavy metals in these areas from the point of view of water quality parameters. Also, the researcher believes that this small study will be a stepping stone and contribute its part for those people who are interested in further study of this topic. Inspired by the above motivations, we used flame atomic absorption spectrometer (GFAAS- novAA400p; Germany) to determine the levels of heavy metals and associated environmental and human health impacts from the Lower Omo River freshwater ecosystem (water and sediment) of the Lower Omo River.
Materials and Methods
Description of the study area
The Lower Omo River Basin is located in the southern part of Ethiopia. It flows through the city of Omorate, where domestic, municipal and industrial wastes from the city and its surroundings, including agrochemicals, are discharged into the river. It drains south from Ethiopia’s humid highlands to arid lowlands and terminates in the Omo Delta at Lake Turkana, where its lower reaches lie in the eastern arm of the East African Rift Valley. The study was conducted on the lower reaches of the Omo River near the town of Omorate. It receives an annual rainfall of up to 2000 mm, 15 although the mean annual rainfall in the lower Omo River valley near the lake can reach 350 mm. 11 The geographical coordinates of the sampling sites are shown in Figure 1.

Geographic coordinates of the sampling points in the Omo River.
Sampling and sample collection
Water samples were collected from different locations in the river at fifteen sub-sampling sites, with 3 sampling points at each sub-sampling site, for a total of 45 samples from the river. The water samples were collected in high quality, screw-capped, high-density polypropylene bottles, each with a 2 l capacity. In terms of sampling frequency, samples were collected at three different times from September to June 2022.The water samples were acidified with 5% HNO3 to keep the metals dissolved in solution orto prevent the water’s heavy metals from decaying16,17 and then placed in an ice box. On the same day, the collected samples were transported and stored in the Research Laboratory of Chemistry, Water Supply and Environmental Engineering, Arba Minch University of Water Technology Institute, Arba Minch, Ethiopia.
Sediment samples were collected at the same locations as the water samples. Forty-five sediment samples were collected from 15 sampling locations, which were then combined into 15 samples for analysis. They were collected from the surface using a plastic scoop and immediately transferred to polyethylene bags. The collected samples were placed in an ice box with the plastic bags and then immediately transported to the Soil Laboratory of the University of Arbaminch.
Sample preparation
Water samples were digested with a concentrated acid mixture of 65% HNO3 (1 ml) and 35% HCl (0.5 ml) on a thermostatic hot plate. According to the methods developed by the United States Environmental Protection Agency (USEPA) 3005, a 50 ml aliquot of well mixed water samples was digested in a beaker covered with a watch glass by adding 1 ml of concentrated (65%) HNO3 and 0.5 ml of concentrated (35%) HCl and heated on a hot plate boiled until a clear solution was formed. The beaker was subsequently removed and cooled. After digestion and cooling, the samples were diluted with distilled water and filtered through Whatman filter paper for analysis.18,19 Sediment samples were air dried in the laboratory at room temperature for 5 days. The air dried samples were then grounded using mortar and pestle after being sieved with a 2 mm sieve. The samples were then prepared for digestion. 20 About 0.5 g of finely powdered sediment samples were placed in digestion vials to which 65% HNO3 (3 ml) and 70% HNO4 (2 ml) were added and heated over a steam bath to form a clear solution. The mixture was filtered through Whatman filter paper and stored in the freezer at 4°C.
Sample analysis
The absorbance of heavy metals was analyzed using a flame atomic absorption spectrometer (GFAAS- novAA400p; Germany), and the concentrations of the heavy metals in the water samples were determined from a standard calibration curve. Prior to actual sample analysis, the instrument was calibrated by preparing a series of concentrations of the standard solutions for each analyte. Analysis of each heavy metal was performed in triplicate. Values below the detection limits were reported as “ND” (not detected). The analysis was performed according to the APHA protocol. 21
Water quality evaluation based on water quality indices
The assessment of heavy metal contamination has been an important aspect of water quality assessment programs. The Global Environment Monitoring System (GEMS) program includes metals such as Al, Cd, Cr, Cu, Fe, Hg, Mn, Ni, Pb, and Zn as a high priority metals. 22 In the present study, the 9 heavy metals including Cd, Cr, Cu, Fe, Mn, Ni, Co, Pb and Zn were investigated.
Heavy metal pollution index (HPI)
The Heavy Metal Pollution Index (HPI) is used as an indicator of overall water quality in terms of heavy metal content.22,23 Multiple heavy metals in water and their collective impact on water quality were comprehensively evaluated using HPI 24 and is calculated according to the following equation23,25


Where HPI is the metal pollution index (equation (1)), Wi is the unit weighting of the ith heavy metal (equation (2)), K is the proportionality constant which is inversely proportional to the maximum permissible value (Si) of the heavy metals for drinking, livestock, and irrigation use that is calculated as presented in equation (3), and Qi is the sub-index for the ith heavy metal (the individual quality rating for the ith heavy metal) calculated using equation (4). Mi and Ii represent the monitored and ideal values of the ith parameter, respectively for heavy metals (µg/L). A value of HPI < 100 represents low pollution of heavy metals, HPI value > 100 indicates the water is unsuitable for consumption and HPI = 100 is the threshold value at which harmful health consequences are probable.23,26,27
Metal index (MI)
The MI is a water quality indicator that assesses the overall level of contamination derived from the concentrations of heavy metals compared to their respective Maximum Allowable Concentrations (MACs). It is used to estimate the quality of water for different uses. 28 According to this index, water samples can be divided into 3 groups as: potable (MI < 1), on the threshold of risk of drinking (MI = 1), and non-potable (MI > 1) Table 1 and calculated according to equation (5).29 -31
Water quality classification using MI.


Where MI is the metal index, Ci is the mean concentration of each heavy metal in the water sample, and MAC is the maximum allowable concentration for each heavy metal in the water sample. An MI < 1 indicates that the water is suitable for consumption. An MI > 1 indicates that the water is unsuitable for domestic use.22,32 According to Caerio et al 33 it was also classified as presented in Table 1.
Heavy metal evaluation index (HEI)
The HEI provide information about overall water quality as regards to heavy metals. The HEI is computed as presented in the equation (6) as follows32,34

Where, Hc is monitored concentration of the heavy metals and Hmac is maximum allowable concentration (Mac) of the heavy metals.34,35 HMI value < 1.0 is rated as “Fit” and the value >1.0 is considered as “Unfit” for domestic usage.34,36 According to Edet and Offiong, 32 the water quality is also classified as HEI < 10 for low, 10 < HEI < 20 for moderate, and HEI > 20 high pollution.
Human health risk assessment
The human risk of heavy metal contamination can be increased by direct ingestion and dermal absorption through the skin. The common exposure pathways to water used to determine human health risk include dermal absorption and ingestion, 37 which can be calculated using the following equations:
Exposure assessment
The health risks for the heavy metals from water through oral ingestion and dermal absorption were estimated according United States Environmental Protection Agency (USEPA) risk assessment guideline. 38 To assess noncancer and cancer risks for humans (children and adults), the chronic daily intake (CDI) of HMs, which represents the lifetime average daily dose (LADD) of exposure to a contaminant was used.38,39 The CDI of the HMs in water via oral ingestion and dermal absorption was calculated by using the following equation 40 :

Where: CDI is the chronic daily intake (mg/kg/day); C is mean concentration of heavy metal in the water (mg/L); IR is the ingestion rate per day (1 l/day for a child and 2.2 l/day for adult)39,41; ED is the exposure duration (6 years for a child and 30 years for an adult)31,42; EF is the exposure frequency (365 days/year); ET is exposure time (0.58 h/day for adults; 1 h/day for children 38 ; BW is average body weight (15 kg for a child and 60 kg for adult) 43 over the exposure period; AT is the average time representing the period over which exposure is averaged [(for carcinogens, AT = 65 × 365 = 23 725 days for both children and adults in Ethiopia; for non-carcinogens, AT = ED × 365 which equals 2190 days and 10 950 days for children and adults, respectively)38,44]; SA is exposed skin area available for contact (18 000 cm2 for adults; 6600 cm2 for children) 38 ; KP is dermal permeability coefficient of heavy metal in water (cm/h) [Pb (0.004), Ni (0.001), Co (0.001), Cu (0.001), Zn (0.006), Mn (0.001), Fe (0.001), and Cr (0.001)] 38 ; CF is unit conversion factor (0.001 l/cm3).38 -40
Noncarcinogenic risk assessment (HQ and HI)
The noncancer risks of HMs in water were determined by using the hazard quotient (HQ) and hazard index (HI) according to equation (2). The hazard index (HI) is the overall potential for noncarcinogenic effects posed by multiple pollutants via ingestion or dermal pathways.


Where HI represents the overall potential for noncarcinogenic effects posed by more than one pollutant via ingestion or dermal path way; HQ is the noncancer hazard quotient; CDI is the chronic daily intake (mg metal/kg/day); and RfD represents the chronic oral reference dose which is probably without a significant risk of harmful effects throughout life. 45 The oral reference doses (RfDingestion) of Pb, Ni, Co, Cu, Zn, Mn, Fe, and Cr are 0.0035, 0.02, 0.03, 0.04, 0.3, 0.014, 0.7, and 0.003 mg/kg/day.38,46,47 The dermal reference doses (RfDdermal) of Pb, Ni, Cu, Zn, Co, Mn, Fe, and Cr are 0.000525, 0.0054, 0.012, 0.06, 0.016, 0.00005, 0.14, and 0.00007546,48 -50 mg/kg/day, respectively. The potential risk to human health posed by exposure to multiple HMs was measured by the hazard index (HI), which is the sum of all HQs calculated for each heavy metal. A value of HQ or HI < 1 indicates no significant no cancer risk; a value >1 indicates significant no cancer risk, which increases with increasing HQ or HI. 40
Carcinogenic risk assessment (CR)
Cancer risk was calculated as the quotient of the CDI (mg/kg/day) and cancer slope factor (CSF) measured in mg/kg/day)−1. In the present study, the CR was assessed for elements that are considered to be toxic to humans, Cr, Pb, and Ni.
The carcinogenic risk (CR) associated with the ingestion pathway can be estimated using the following formula:


Where CR ingestion = carcinogenic risk (CR) associated with ingestion; CDI = chronic intake (mg/kg/BW/day); and CSFingestion = the oral carcinogenic slope factor (mg/kg/day), which is 0.0085 for Pb, 0.5 for Cr, and 1.7 for Ni. The total cancer risk as a result of exposure to multiple contaminants due to consumption of a particular type of water was assumed to be the sum of each metal cancer risk (∑CR). The United States Environmental Protection Agency (USEPA) suggested that a CR < 10−6 indicates no carcinogenic risk to human health; a CR > 1 × 10⁻⁴ indicates a high risk of developing cancer; and a risk ranging from 1 × 10⁻⁶ to 1 × 10⁻⁴ represents an acceptable risk to human health. 44
Estimation of environmental (ecological) risks from water
Estimation of environmental risks using the risk index factor (RI)
The risk index factor (RI) resulting from the intake of heavy metals from the Lower Omo River water was used to estimate the potential environmental risk. A risk index factor related to the presence of toxic heavy metals in water was proposed by Hakanson and was calculated according to Hakanson. 51
Where Ri is the risk index factor; Ti is the toxicity coefficient of the metal; OC is the mean concentration of the metal; and NOEC is the maximum allowable concentration. The toxicity coefficients of the metals were 5 for Pb = Ni = Cu = Co, 1 for Zn = Mn, 10 for Fe, and 2 for Cr.51,52
Comprehensive risk index (CRI) of water
The comprehensive risk index (CRI), which is the summation of the risk index factor (Ri), was calculated according to the following equation. 51 The range of the Risk Index Factor (Ri) is shown in Table 2.
Description of Environmental risk of toxic metals in water using the risk index factor.

CRI = ∑RI
where RI is the risk index factor for each metal.
Table 2 Description of Environmental risk of toxic metals in water using the risk index factor. Environmental risk classification by means of comprehensive risk factors is shown in Table 3.
Environmental risk classification by using comprehensive risk factors.

Assessment of ecological risk of heavy metals in the sediments
Contamination Factor (CF) and contamination degree (CD)
Contamination Factor (CF) and Contamination Degree (CD) are primary indicators of metal pollution status of the subjected sediment. Contamination Degree is the summation of all CF values. 20
Where, the Csample and Cbackground are the measured and background concentration respectively. The background concentrations are presented in Table 4. 53 The Contamination factors are graded into 4 classes as: CF < 1, low contamination load; 1 < CF < 3, moderate contamination; 3 < CF < 6, considerable contamination; and CF > 6, very high contamination (Table 4).
Description of contamination factor (CF) and contamination degree (CD).


Pollution load index (PLI)
The PLI was used for evaluating mutual contamination effects of the 8 heavy metals in the sediments of the present study and calculated in equation. . ..

Where CF denotes the contamination factor and n is the considered number of metals. There are 3 discrete categories for pollution measurement with this index. Pollution status is indicative of no pollution when the PLI values are 0; the baseline degree of pollution when the PLI values are equal or less than 1; and the third category (when PLI is greater than 1) designates progressive decline in terms of pollution of the sites. 20
Potential ecological risk index from sediment (RI)
This was formulated by Hakanson 51 to quantify the level of ecological risk of heavy metals in sediment. The RI assesses the combined ecological and environmental toxicity to provide an overall evaluation of the potential risk of heavy metal pollution which is calculated as follow:


Where, EI is the individual potential risk, and Ti is the toxicity effect coefficient, with values for Mn, Zn, Cu, Cr, Pb, Ni, Fe, and Co are 1, 1, 5, 2, 5, 5, 1, and 5. 54 According to Hakanson, 51 and CF is the contamination factor of each metal. The potential ecological risks were classified on the basis of the values of the risk factor as:
Data analysis
Data were analyzed using IBM SPSS Statistics 21 software at a 95% confidence level, and differences were considered statistically significant at P < .05. Heavy metal concentrations at each point are presented as the mean ± standard deviation of the samples analyzed. Variations in the concentrations of metals between the main sites (lotic and lentic) were evaluated using a t-test. The overall differences in the mean concentrations of metals between sampling points were analyzed using ANOVA, whereas the differences among specific points were analyzed by the Tukey method of multiple comparisons (Tukey post hoc test).
Results and Discussion
Heavy metals from water
The mean concentrations of heavy metals in the river water samples are presented in Table 5. The mean concentrations of the heavy metals in the water samples followed the order Fe (8.926 mg/l) > Mn (0.439 mg/l) > Cr (0.393 mg/l) > Pb (0.318 mg/l) > Cu (0.168 mg/l) > Zn (0.1 mg/l) > Co (0.06 mg/l) > Ni (0.007 mg/l). Cadmium was not detected in any of the water samples, which may be due to the lack of significant levels of cadmium-containing pollution sources in the nearby catchment area that drain into the river water. The maximum concentration of heavy metals detected in the river water was Fe (12.85 mg/l) with min level (8.926 mg/l), and the minimum mean concentration was Ni (0.007 mg/l). The mean concentration of Fe in the River water of the present study was larger than that in the study by Gabriela Pérez et al 55 from Atoyac River (0.209 mg/l) in Mexico and Rofhiwa et al 37 from Mutangwi River (0.24 mg/l) in South Africa. The Fe levels in the River water was above the WHO 56 and USEPA 57 permissible limits for drinking. This could be due to the urban wastes and use of steel pipes for irrigation in the River system.
Mean concentration of heavy metals (HMs) from the river water.

The concentration of manganese (Mn) ranged from 0.41 to 0.51 mg/l with mean level of 0.439 mg/l. The Mn level of the water in the present study was larger than that in the study by Emily et al 60 in Kenya from Sosian River. However, lower mean level of Mn was recorded in this study than in the study by Tengku et al 61 from Malaysia (0.497 mg/l) and Yasemin and Yalcin 42 from Akcay River of Turkey (6.48 mg/l). The mean concentration of Mn in the present study was higher than the permissible limit for drinking water according to WHO 56 and USEPA. 57 The various agricultural activities and pollution from cities and villages in the watershed may have contributed to the increase of Mn concentration in the water.
The zinc level ranged from 0.04 to 0.17 mg/l with mean value of 0.1 mg/l. The mean Zn level in the present study was higher than that in the study by Azlini et al 62 from highland River of Malaysia (0.033 mg/l). However, the Zn level river water in the present study was lower than that in the previous study by Flipos et al 63 from Megech River (0.13 mg/l) in Ethiopia and Kluska and Jabłońska 64 from Muchawka River (176 mg/l) in Poland. Its mean concentration in the present study was below the WHO 56 permissible limits for drinking and the FAO 65 for livestock.
The copper level of the water ranged from 0.1 to 0.27 mg/l with the mean level of 0.168 mg/l. The mean Cu level in this study was greater than that in earlier study by Liu et al 66 from Buerhatong River (0.01344 mg/l) in China and Adem et al 67 from Borkena River (0.03 mg/l) in Ethiopia. On the other hand, the mean Cu level of the water in the present study was lower than that in previous studies by Emily et al 60 from Sosian River (0.291 mg/l) in Kenya. Its mean concentration in the present study was below the WHO 56 permissible limits for drinking and the FAO 65 for livestock.
The chromium level of the water ranged from 0.34 to 0.46 mg/l with the mean level of 0.393 mg/l. The concentration of Cr in this study was greater than that in previous studies by Ibukun et al 68 from Southwest Nigeria (0.059 mg/l), Liu et al 66 from Buerhatong River (0.00456 mg/l) in China, and Tengku et al 61 from Tropical River (0.005 mg/l), in Malaysia. However, the Cr level in the present study was lower than that in the study by Yasemin and Yalcin 42 from Ackay River (8.296 mg/l) in Turkey. The mean concentrations of Cr in the present study was above the permissible limits for drinking water quality56,57 but below the FAO permissible limits for livestock. 65
The lead level ranged from 0.25 to 0.38 mg/l with the mean level of 0.318 mg/l. The mean concentration of Pb in the present study was greater than that in previous studies by 60 which was 0.105 mg/l from Kenya, 68 0.019 mg/l from Nigeria, 22 0.0021 mg/l from Albania, and 0.04 mg/l from Ethiopia. 63 The finding of the present study was lower than in previous studies by Kluska and Jabłońska 64 which was 9.3 mg/l. The mean concentrations of Pb in the present study was above the permissible limits for drinking water quality56,57 and FAO for livestock. 65 The Possible sources of Pb in the present study may be due the fact that the source of pollution could be from commercial, vehicle traffic, agricultural runoff, car washing, gas/fuel station and solid wastes which are near the River water from the Omorate town. The lead in the water could also be a result of corrosion of older fittings, combustion of leaded gasoline, corrosion of lead containing materials, irrigation system pipes, burning of building and electronic wastes with residue washed into rivers pipe
The variations in heavy metal concentrations from water at different sampling points are presented in Table 6. Mean Concentration of all HMs at all sample points in River are significantly different at 5% level of significance. To see in which sample point the mean concentration is significantly different; the Tukey test of multiple comparison was used shown in Table 6. The data are the average of triplicate data that the numbers followed by the same superscript letter in the same column are not significantly different according to Duncan’s multiple range tests at (P < .05). The mean concentration of Mn at site 1 was significantly different from the mean concentration at sites 5, 10, and 12. The mean concentration of Zn at site 1 was significantly different from the mean concentrations at sites 4 to 14. Similarly, the mean concentration of Pb at site 1 was significantly different from the mean concentrations at all sites except for sites 7 and 15. This difference might be due to the difference in the pollution sources of the heavy metals and the difference in physicochemical properties of water at different sampling points.
Concentration of heavy metals from water at different sample sites (multiple comparisons).

Heavy metals from sediment
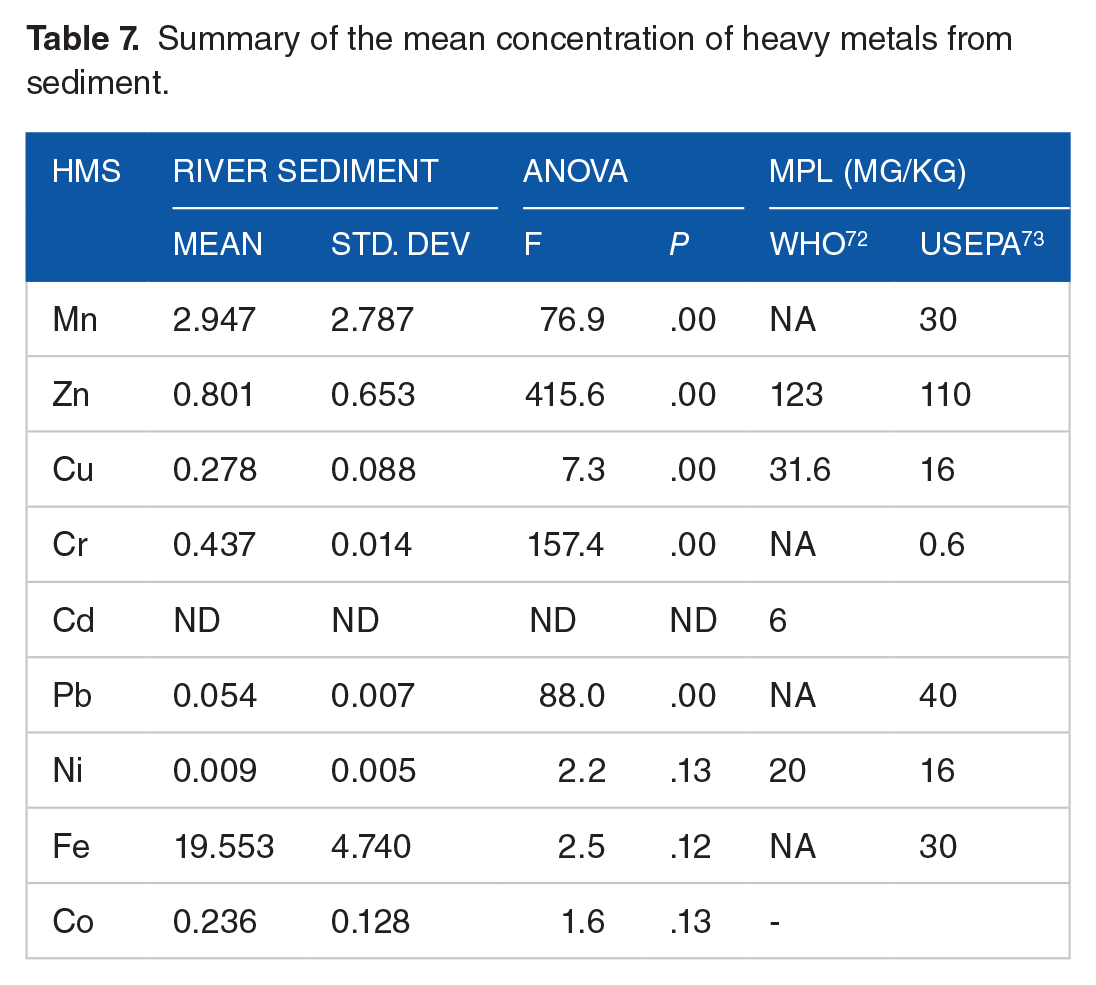
The mean concentrations of heavy metals in the sediment samples are presented in Table 7. The mean concentrations of the heavy metals in the sediment samples followed the order Fe (19.55 mg−1) > Mn (2.947 mg−1) > Zn (0.801 mg kg−1) > Cr (0.437 mg−1) > Cu (0.278 mg−1) > Co (0.236 mg/l) > Pb (0.054 mg−1) > Ni (0.009 mg−1). The maximum mean concentration of heavy metals detected in the sediment was Fe (19.55 mg−1) and the minimum mean concentration was for Ni (0.009 mg−1). The mean concentration of Fe in sediment of the present study was lower than that in the study by Acharjee et al 20 from Surma River (291.1 mg−1) in Bangladesh. A greater concentration of Ni was also reported in the previous study by Kawichai et al 69 from Mae Chaem River (24.0 mg−1) in Thailand and Acharjee et al 20 in Bangladesh (92.34 mg−1) that in the present study. The manganese level ranged from 2.9 to 5.86 mg−1 with mean level of 2.947 mg−1. The Mn level in the present study was lower than that in the study by Acharjee et al. 20 The zinc level of this study ranged from 0.075 to 1.46 mg−1with the mean level of 0.801 mg−1. The chromium level ranged from 0.42 to 0.6 mg−1. Its level in the present study was lower than in the study by Flipos et al 70 from Megech River (1.96 mg−1 in Ethiopia and Kassim et al 71 from Gibe River (23.24 mg−1) in Ethiopia.
Summary of the mean concentration of heavy metals from sediment.
The variations in heavy metal concentrations from sediment at different sampling points are presented in Table 8. Mean concentration of all HMs except for Ni, Fe, and Co at all the sample points in the sediment are significantly different at 5% level of significance. To see in which sample point the mean concentration is significantly different, the Turkeys’ test of multiple comparison was consider as shown in Table 8. The mean concentration of Mn at site 1 was significantly different from the mean concentration at sites 5, 10, and 12. The mean concentration of Zn at site 1 was significantly different from the mean concentrations at sites 4 to 14. Similarly, the mean concentration of Pb at site 1 was significantly different from the mean concentrations at all sites except for sites 7 and 15. This difference could be due to the different sources of pollution of the heavy metals and the different physicochemical properties of the water at different sampling sites.
Concentration of heavy metals from sediment at different sample sites (multiple comparisons).

Remark: Cd not detected (ND), Fe, Ni, and Co are not significant at 5% significance level. The corresponding values of non-significant HMS are removed from the table.
Numbers followed by the same superscripts in the same column do not vary significantly by tukey’s multiple comparisons test at p < 0.05.
Water quality index
The water quality pollution indices were assessed after the concentrations of the heavy metals were determined. The HPI, HEI, MI, and CD were calculated to evaluate the quality of the River water regarding the heavy metal levels for each sampling location and are presented in Table 9.
Drinking and irrigation water quality indices.

Heavy metal pollution index
The Heavy Metal Pollution Index (HPI) indicates the overall quality of the water with respect to heavy metals. The HPI of the river water in terms of heavy metal levels for each sampling site and are presented in Table 9. The HPI of the Lower Omo River ranges from 656.8 to 999.5 with a mean value of 720 (Table 9) for drinking water while the values for irrigation use range from 164.8 to 211.6 with a mean value of 182.01 The HPI value revealed that all sample sites were heavily polluted as the concentration of all exceeded the threshold value of the pollution index which is 100. This indicates that the water is unsafe for drinking and irrigation usage. The mean value of the present study (720) is lower than those reported by Josephine et al 28 in the Mgoua river (1990.64) of South-western Cameroon while it is greater than those reported by Mansour et al 74 in drinking water (HPI = 48.5) from Khorramabad city in Iran.
Heavy metal evaluation index (HEI) and metal index (MI)
The HEI values for drinking water ranged from 18.1 to 40.8 with a mean of 24.01, while the values for irrigation water ranged from 0.66 to 10.4 with a mean of 4.7. The HEI values for both drinking and irrigation water are greater than one, which is unfit for domestic use. According to the classification proposed by Edet and Offiong, 32 11 samples were categorized as “high contamination” and the remaining 4 samples were found under the moderate contamination category for drinking. According to MI, the maximum value of metals in the River was 40.8 and 9.7 for drinking water and irrigation respectively. The minimum amount for drinking water was 15.4 and that of irrigation was 0.612. The mean index for drinking and irrigation was 24.01 and 4.7 respectively. According to classifications proposed by Edet and Offiong, 32 all the sampling stations except 1, 2, 3, 7, and 15 are highly polluted for drinking.
Human health risk assessment
Noncarcinogenic risks (HQ and HI)
The CDI and HQ of the heavy metals Pb, Mn, Fe, Cu, Co, Ni, and Zn for children and adults through oral and dermal routes of drinking water from Lower Omo River are presented in Table 10. The HQs through oral intake (ingestion) for both children and adults were in the order of Cr > Pb > Mn > Fe > Cu > Co > Ni > Zn. Similarly, the HQ via the dermal route follows the order Mn > Cr. In the present study, the HQ greater than 1 was observed for Cr, Pb, and Mn both in children and adults through ingestion and dermal ingestion. As shown in Table 10, the hazard quotient (HQ) values for Cr (8.73), Pb (6.057), and Mn (1.219) in children via ingestion was intolerable risk seeing that HQ > 1. Similarly, the HQs values in adults for Cr (4.67) and Pb (3.030) were greater also unacceptable risk. Regarding the dermal route, the HQs values for Cr (2.306) and Pb (1.066) in children via dermal route was intolerable risk (HQ > 1). The HIs of the heavy metals for children and adults via ingestion route were 17.32 and 8.737 respectively. Likewise, the HI of the heavy metals via dermal route of exposure in children was 3.6 and the value in adult was 1.43 indicating intolerable noncarcinogenic health risk effect. Chromium and lead followed by manganese contributed more to the noncancer risks both via ingestion and dermal route of exposure in children and adults. The HIs value of the present study in children were higher than those for adults indicating that children would experience more noncancer risks and absorb more chemicals than adults.41,45
Chronic daily intake and noncancer hazard quotients for children and adults through oral and dermal routes.

A value of HQ > 1 (bolded values) indicates significant cancer risk, which increases with increasing HQ.
The HQ value in children via ingestion for Cr, Pb, and Mn in the present study was greater than that in the study by Ibukun et al 68 which was 0.48 for (Cr), 0.33 (Pb), and 0.21 (Mn) from Dandaru River in south west Nigeria. The HQ value in children via ingestion for Cr in the present study was also greater than that in the study by Bamuwamye et al 39 from drinking Water (0.002) in Uganda for children. However, the HQ value via ingestion for Pb in children and adult of the present study was lower than that in the study by Bamuwamye et al 39 for Pb in children (46.481) and adult (19.921).Emmanuel et al 41 also reported greater HQ for Pb in children (48.89) and in adult (10.48) than the present study.
Carcinogenic health risks (CR)
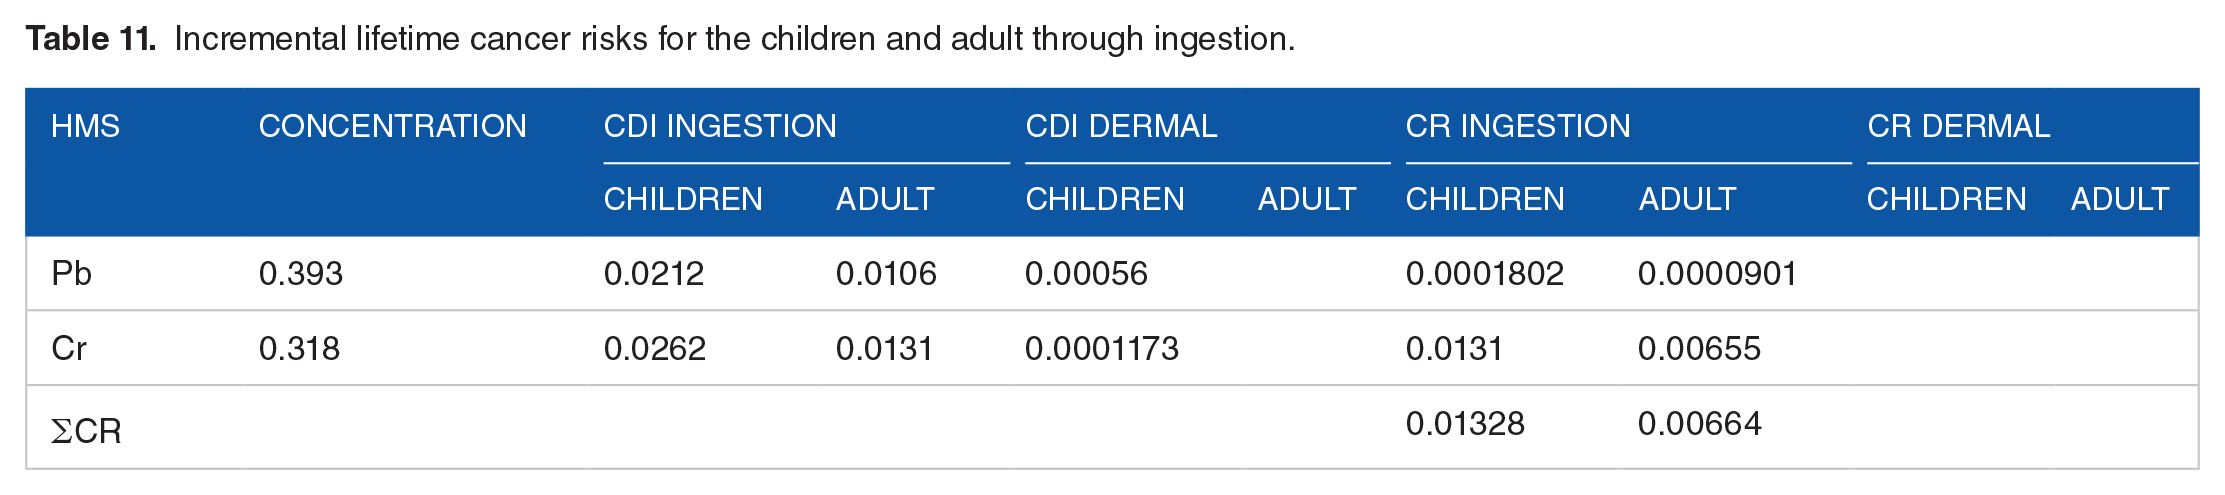
Cancer risks were expressed in terms of incremental lifetime cancer risk (ILCR), which is the possibility that an individual may develop cancer over a 60 year lifetime due to a 24 h exposure to a potential carcinogen. 39 In this study, cancer risk (CR) assessed for Pb, Cr, and Ni are considered to be carcinogenic for humans. The results are presented in Table 11. The CRs for both children and adults followed the order Cr > Pb. The CRs of Pb, Cr, and Ni in children were 0.0001802 and 0.0131, respectively. Similarly, the CRs in adults were 09.911 × 10⁻⁵ and 0.007.205 × 10−3, respectively. Chromium exhibited the higher probability of cancer risks (mean CR = 1.31 × 10⁻²) followed by lead (mean CR = 1.8 × 10⁻⁴) for children. The cumulative effect of the heavy metals for carcinogenic ∑CR) both in children and adults of the present study was above acceptable values (10−6 to 10−4) s which is intolerable cancer risks due to heavy metals in drinking water over a lifetime.
Incremental lifetime cancer risks for the children and adult through ingestion.
Ecological risks from in the river water
The potential ecological risk of the river water was estimated using risk index factor (RI) and comprehensive risk index (CRI) as shown in Table 12. The risk index factor (RI) for the heavy metals in the river water was in the order of Fe > Pb > Co > Cr > Mn > Ni > Cu > Zn. The RI for each heavy metal in the river water showed that Zn (RI = 0.02), Cu (RI = 0.42) and Ni (RI = 0. 5) had no potential environmental hazard, Mn (RI = 1.1), Cr (RI = 15.72), and Co (RI = 30) had low potential environmental hazard, Pb (RI = 159) had considerable potential environmental hazard and, Fe (RI = 297.5) had severe potential environmental hazard (Table 12). The major contribution to the risk factor (RI) was made by iron and lead, which could pose a major pollution risk in the river water. According to the classification of the environmental risk using the Comprehensive Risk Factor (CRI) (Table 12), the lower Omo River water could be classified as very high environmental risk (CRI = 504).
Environmental risk of toxic metals in water using the risk index factor.

Assessment of ecological risk of heavy metals in the sediments
Table 13 presents the values of the contamination factor (CF), contamination degree (CD), pollution load index (PLI), and ecological risk index (RI). The CF values of the present study were arranged in the order as follows: Cr > Fe > Mn > Cu > Pb > Co > Zn > Ni. The EI values for the detected heavy metals in the sediments were also occurred in the order: Fe > Cr > Cu > Pb > Mn > Co > Zn > Ni. The results of CF indicate a low degree of pollution with CF values below 1. The mean PLI values of heavy metals in sediment of Lower Omo river was 0.012 indicating low metal contamination in the sediment (PLI < 1.0). Similar finding was reported by Kawichai et al 69 from Mae Chaem River in Thailand. The mean RI value of the present study was 7.02 that indicate the low potential ecological risk of the sediment by heavy metal (Table 13).
Ecological risk index of sediments.

Conclusion
The present study provides the first baseline information on the contamination levels of the 9 heavy metals in an Ethiopian lowland freshwater body (Lower Omo River). All except cadmium were detected in both water and sediment sample. The HQ value greater than 1 was observed for Cr, Pb, and Mn in both children and adults by ingestion and dermal route from the river water. According to the CRI value, the river water could be classified as a very high environmental risk. While the results of CF and PLI value indicate a low level of contamination for sediment samples. Therefore, monitoring heavy metal levels in fresh water biota such as fish is vital for environmental and public health concerns, and policy makers are trying to take appropriate action at this alarming level to protect the freshwater and people from the threat of heavy metal pollution from the river.
Footnotes
Author Contributions
KAA conceived and designed the experiments, performed the experiments, analyzed the data, prepared figures and/or tables, authored or reviewed drafts of the article, and approved the final draft. YGT conceived and designed the experiments, performed the experiments, prepared figures and/or tables, authored or reviewed drafts of the article, and approved the final draft. SSS conceived and designed the experiments, performed the experiments, prepared figures and/or tables, authored or reviewed drafts of the article, and approved the final draft. BYS conceived and designed the experiments, analyzed the data, prepared figures and/or tables, authored or reviewed drafts of the article, and approved the final draft.
Declaration of conflicting interests:
The author(s) declared no potential conflicts of interest with respect to the research, authorship, and/or publication of this article.
Funding:
The author(s) received no financial support for the research, authorship, and/or publication of this article.