
Abstract
Evaporation from bare soil is a key component of the soil water balance in arid and semi-arid regions, affecting water availability, solute transport, and groundwater recharge. This study aimed to develop and validate hydro-pedotransfer functions (PTFs) and physically based models to estimate bare soil evaporation using readily measurable soil properties. Data were collected over 2 years from 92 micro-lysimeters installed in diverse soil types under a cold semi-arid climate. The models used variables such as soil water content, texture, and bulk density. The PTFs showed moderate performance, with the best empirical model (PTF-3) achieving a mean error of 1.77 mm and a root mean square error (RMSE) of 2.49 mm. In contrast, the best physical model (M1) yielded slightly better accuracy, with a mean error of 1.65 mm and RMSE of 2.24 mm. Overall, physically based models outperformed the empirical PTFs, demonstrating their potential for estimating evaporation in data-scarce environments. These findings support the development of practical tools for water balance modeling and irrigation planning in semi-arid agricultural systems.
Introduction
Evaporation from bare soil is a crucial component of the soil water balance in arid and semi-arid regions. It plays a fundamental role in modeling soil water solute transport and groundwater recharge. Globally, approximately 15.2% of the Earth’s land surface consists of bare soil, which accounts for 50% to 70% of total annual evaporation (Trautz et al., 2015). Additionally, 12.6% of the land comprises croplands that remain fallow for up to half the year (Latham et al., 2014), where up to 50% of precipitation can evaporate directly from the soil (Hillel, 1998).
Although the physical mechanisms of surface water evaporation are well established, empirical data on bare soil evaporation remain scarce (Quinn et al., 2018), limiting the validation of both physically based and semi-empirical models. To address this, a range of modeling approaches has been developed—ranging from simplified empirical equations to detailed physically based models supported by laboratory and field experiments. Among these, models that solve Richards’ equation are regarded as the most robust, as they incorporate key processes such as upward water flux, capillary barriers, and the decoupling of surface and root-zone water dynamics (Pollacco et al., 2013; Pollacco & Mohanty, 2012).
However, physically-based models require detailed soil hydraulic parameters, such as soil water retention and unsaturated hydraulic conductivity functions, which are often unavailable (Abkenar et al., 2019; Pollacco et al., 2023; Rasoulzadeh et al., 2024; Rasoulzadeh & Sepaskhah, 2022). As an alternative, semi-empirical models, often called hydro-pedotransfer functions (PTFs), estimate evaporation using limited meteorological and soil data. These models are designed to translate easily measurable soil properties into more complex hydraulic properties or evaporation rates, which are otherwise difficult and expensive to measure directly (Balland et al., 2008; Pollacco, 2008). Consequently, bare soil evaporation is often modeled using semi-empirical approaches (e.g. Lehmann & Or, 2024; Li et al., 2022; Mathias et al., 2023; Rianna et al., 2018) and mathematical formulations (Alempour Rajabi et al., 2024; Leuther & Diamantopoulos, 2024; Mohammadi et al., 2024; V. P. Tran et al., 2016; D. T. Q. Tran et al., 2016; Trautz et al., 2018).
Despite their usefulness, PTFs often have accuracy limitations. Therefore, this study aims to develop a more generalized approach using widely available soil data (Khari et al., 2023; Malik et al., 1992). Specifically, we test existing PTFs from the literature and develop new regional PTFs tailored to the cold semi-arid conditions of northwestern Iran. These PTFs estimate daily evaporation from bare soil using basic soil hydraulic parameters and climatic data from a network of 92 micro-lysimeters. The novelty of this study lies in creating regional-specific PTFs based on an extensive dataset, offering improved accuracy and applicability in semi-arid environments.
Materials and Methods
Study Area
This research was conducted in Khalkhal County, located in Ardabil Province, northwestern Iran, at the University of Mohaghegh Ardabili (48°18′E longitude and 38°15′N latitude). According to the Köppen climate classification, this region experiences a cold semi-arid steppe climate. Long-term records (1976–2023) indicate an average annual rainfall of 305 mm (Ardabil Meteorological Administration, 2025), with snowfall dominating during the cold season. The mean annual temperature is 9.6°C, with extremes ranging from 3.2°C to 15.6°C. Humidity varies between 51% and 90%, while monthly sunshine hours range from 83 hr in October to 356 hr in June.
Lysimeter Setup
Over two successive years (2019 and 2020), soil evaporation was indirectly measured using 92 PVC micro-lysimeters, each with a diameter of 10 cm, a height of 30 cm, and a thickness of 2 mm. To minimize temperature effects on the PVC material, each micro-lysimeter was enclosed within a larger PVC column (12 cm diameter, 30 cm height; Figure 1).

Schematic of the micro-lysimeters.
The soil columns inside the micro-lysimeters were repacked to ensure uniformity. The soil was air-dried, sieved through a 2 mm mesh, and repacked to create a homogeneous profile. A two-layer sand filter (coarse and fine) was installed at the base of each lysimeter to enhance water movement, and a net was placed at the bottom to facilitate drainage. To allow soil consolidation, the lysimeters were saturated twice from the bottom and drained for 4 months before evaporation measurements.
Drainage water was collected after irrigation or rainfall events using a hose attached to the bottom of each lysimeter, leading into collection bottles. The mass of the lysimeters was recorded daily using an electronic balance with a 10 kg capacity and 0.1 g accuracy. Soil water content was also measured daily using a Time Domain Reflectometer (TDR; Model-150 Spectrum), calibrated with oven-dried samples. The R2 values for the TDR calibration curves ranged from .95 to .96.
Before measurements, the grass in the micro-lysimeters was removed, and the soil was first saturated from the bottom. Irrigation was applied when the soil water content approached the residual soil water content.
Evaporation was computed as the daily change in mass, corrected for irrigation and drainage, following Riedl et al. (2022):

where Es (mm) represents daily evaporation derived from the micro-lysimeter, WSn (g) and WSn−1 (g) denote the mass of the micro-lysimeter on consecutive days (the nth and n−1th days), WWin (g) refers to irrigation or rainfall input, WWout (g) represents drainage water, and A (cm2) is the micro-lysimeter cross-section area. Water density was assumed to be 1 g cm−3, and a conversion factor of 10 was applied to convert cm to mm.
Soil Physical Properties
Soil bulk density (ρ b ) was measured on undisturbed cores (100 cm3 stainless steel cylinders, 5 cm internal diameter, and 5.1 cm height). Samples were oven-dried at 105°C for 24 hr, and ρ b was calculated by dividing the oven dry mass of the soil by its volume (Grossman & Reinsch, 2002). Additionally, soil texture was measured on disturbed, air-dried samples sieved through a 2 mm mesh. Particle size distribution (sand, silt, and clay) was determined using the sieving method (Gee & Or, 2002), and soil particle density (ρ p ) was measured via a glass pycnometer. Soil porosity (ϕ) was calculated using ρ b and ρ p in units of g cm−3 via the following expression: ϕ = 1 − ρ b /ρ p . The volumetric saturated water content (θ s ) was assumed to be equal to the porosity. The air-dried residual soil water content (θ r ) was measured by drying the soil at the micro-lysimeter station. Soil samples were placed in an open area and considered air-dried when their weight remained unchanged over several consecutive days. Their water content was then determined by oven drying.
The 92 micro-lysimeters covered a wide range of textures, ranging from clay loam to sandy loam, representing 8 out of 12 texture classes. Figure 2 shows that the predominant soil types were loam (34.8%) and sandy loam (28.3%). Table 1 provides the mean, minimum, maximum, and standard deviation values for the selected soil properties.

Soil texture for the selected 92 soil samples.
Mean, minimum (Min), maximum (Max), and standard deviation (SD) of selected soil properties for the 92 soils.

Hydro-Pedotransfer Functions for Estimating Evaporation
One common method of estimating Es is by using the reference evapotranspiration (ET0) and the K ratio approach (Yan et al., 2012):

where K1 (-) is a parameter that represent the ratio of Es (mm day−1) to ET0 (mm day−1); ET0 can be estimated using the Penman-Monteith equation (Allen et al., 1998):

where Rn (MJ m−2 day−1) is the net radiation, G (MJ m−2 day−1) is the soil heat flux density, T (°C) is the mean daily air temperature at 2 m height, u2 (m s−1) is the wind speed at 2 m height, es (kPa) and ea (kPa) are the saturation and actual vapor pressure, Δ (kPa °C−1) is the slope vapor pressure curve, and γ (kPa °C−1) is the psychrometric constant. In this study, ET0is calculated using Cropwat 8 (FAO). The desired meteorological data for Cropwat 8 were obtained from the Ardabil Meteorological Administration (2025).
For areas without meteorological data, Es can also be estimated using Class A pan evaporation, Epan (Yan et al., 2012):

where K2 (-) is a parameter representing the ratio of Es (mm day−1) to Epan (mm day−1) which accounts for the reduction in Es due to attractive forces retaining water within the soil pore system.
Values of K1 and K2 depend on the soil water content and can be estimated using the following equations (Yan et al., 2012):


where θ is the volumetric soil water content at a depth of 5 cm.
The values of K1 and K2 were derived from the ratios Es (measured with a lysimeter) to ET0 and Es (measured with a lysimeter) to Epan, respectively. Our research will improve the predictions of evaporation by deriving K1 and K2 as functions of soil properties outlined in Table 1.
Physical Models for Estimating Evaporation From Bare Soil
The physical models were divided into three categories. The first category had four fitting parameters including P1, P2, P3, and P4. The second and third categories had three and two fitting parameters, respectively (Equations 7–9).


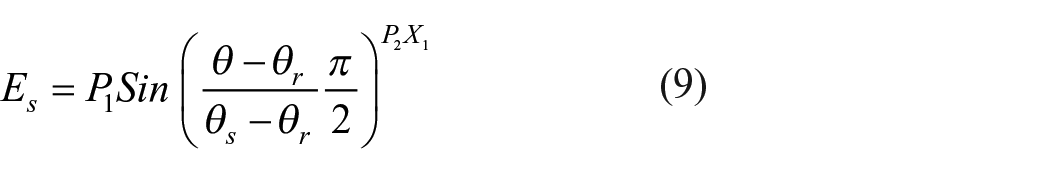
where Es is evaporation from bare soil (mm day−1), θ is measured soil water content, θ s and θ r are saturated and air-dried residual soil water content, respectively, P1, P2, P3, and P4 are fitting parameters, and X1, X2, and X3 are selected soil properties.
Data Analysis
PTFs were evaluated using 2019 data (from August 17th to October 25th, 2019) and validated with 2020 data (from July 21st to August 10th, 2020).
To assess the accuracy and reliability of the PTFs, the difference between measured and estimated values was analyzed. Data used to develop the PTFs are referred to as ‘seen’ data, while data not involved in the PTFs development are ‘unseen’. The following statistical metrics were employed for evaluating both the accuracy (seen data) and reliability (unseen data). Let, Emi represents the measured evaporation from bare soil, and Eei the estimated value for the ith observation, with n being the total number of observations. The mean estimation error is determined by the root mean squared error, RMSE:
The size and sign of the estimation error bias are given by the mean error, ME:

The RMSE and ME quantify the overall differences between measured and estimated bare soil evaporation. Both metrics reach zero when the predicted values perfectly match the observations. Lower RMSE and ME values indicate better model performance and greater predictive accuracy.
The relative improvement, RI, is used to evaluate the relative improvement of the outcome over another outcome and can be defined by the RMSE as:

The coefficient of residual mass, CRM, serves as an objective measure of the consistency of error in the distribution of estimated values across all measurements, without considering the order in which measurements are taken. A CRM value of zero indicates that the estimated values are not biased with respect to the measured values. Conversely, positive or negative CRM values indicate that PTFs either underestimate or overestimate measurements, respectively (Noshadi & Jamshidi, 2014).
DataFit software (version 4.1.19) was used to generate the PTFs, whereas SPSS software (version 16.0) was used to compute correlation coefficients, standard errors, and significance levels of the developed PTFs.
Results
The daily values of ET0 and Epan for the two study periods (August 17th to October 25th, 2019, and July 21st to August 10th, 2020) are presented in Figure 3. Both ET0 and Epan followed similar trends, although ET0 values were lower than Epan. The similarity in overall patterns suggests that, despite differences in magnitude, the underlying process dynamics remained consistent across both years. However, the 2020 data showed a closer alignment between the two metrics, likely due to more stable atmospheric conditions during this period. Variations in cloud cover and other atmospheric factors between the 2 years likely contributed to the observed discrepancies in evaporation trends.

Measured evaporation from the Class A evaporation pan (Epan) and calculated reference evapotranspiration (
The daily values of Es measured from the 92 micro-lysimeters over the 2 years are shown in Figure 4, ranging from 0.05 to 25 mm. Daily evaporation variations among the micro-lysimeters fluctuated significantly. On some days, the differences were minimal, while on others, they were more pronounced. These fluctuations were primarily driven by soil water content.
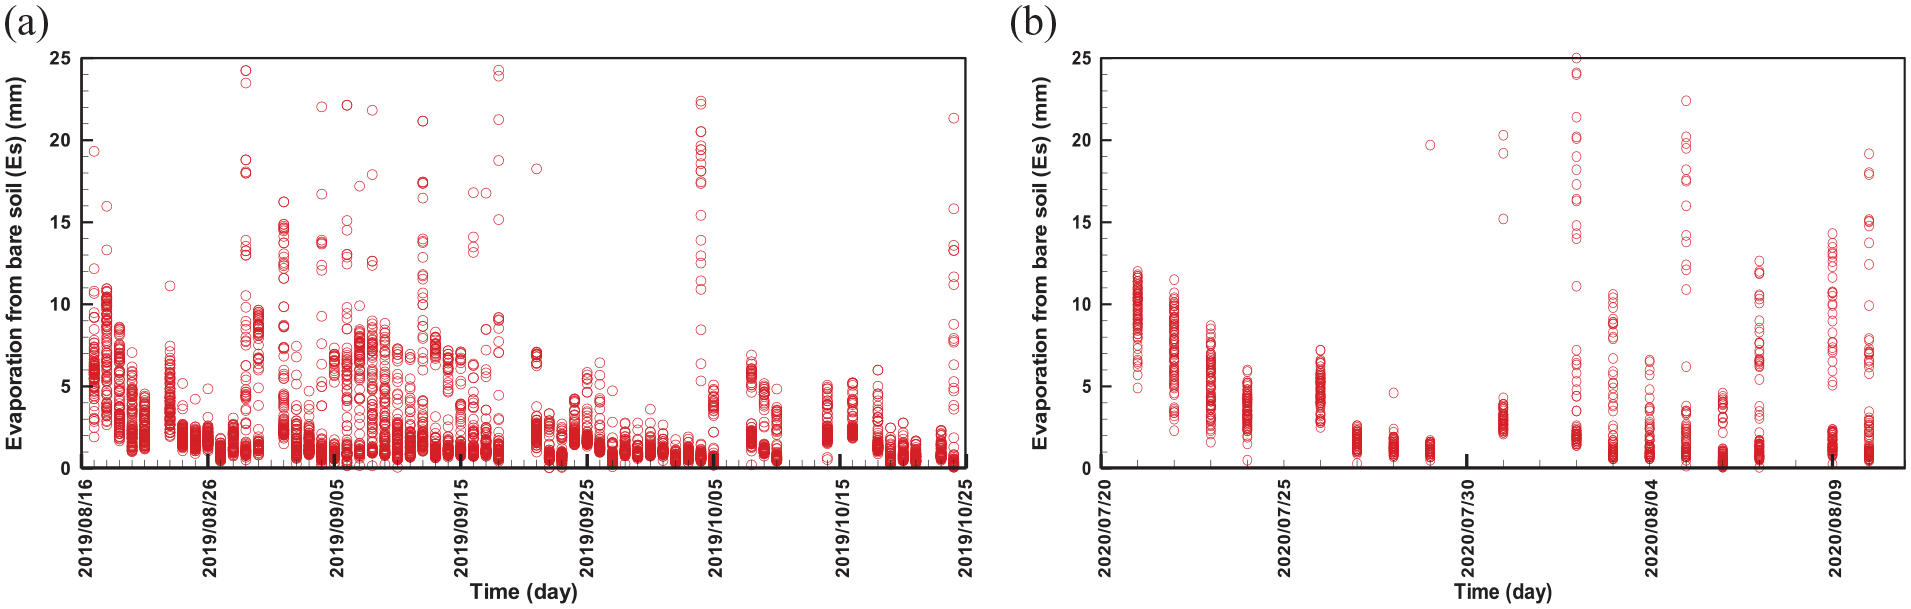
Measured daily evaporation from bare soil for the 92 micro-lysimeters during the: (a) first year and (b) second year.
When soil water content is high, atmospheric conditions dominate the evaporation process, reducing the influence of soil type. Conversely, when soil water content is low, soil type exerts a greater influence on evaporation, overshadowing atmospheric effects. As a result, on days with high soil water content, evaporation rates tend to be more uniform across the micro-lysimeters, as atmospheric conditions remain consistent, and variation is mainly due to soil properties. However, on days with low soil water content, despite uniform atmospheric conditions, differences in soil type led to greater variability in evaporation rates between the micro-lysimeters.
Evaluation of Pedotransfer Functions
The values of K1 and K2 were calculated using Equations 5 and 6, respectively, based on soil water content measurements obtained via TDR. These values were then used in Equations 2 and 4 to estimate Es. Figure 5 compares the estimated and measured Es values, revealing some discrepancies between the predicted results and the experimental data.

Measured bare soil evaporation using micro-lysimeters versus estimated values using the PTFs from Yan et al. (2012): (a) with K1 estimated using Equation 5 and (b) with K2 estimated using Equation 6.
When soil water content fell below 12%, Equations 5 and 6 produce negative values, which lack physical meaning. This anomaly suggests that the predictive capability of the PTFs is limited under specific soil water content conditions, emphasizing the need for refining the corresponding equations. Additionally, the findings highlight the role of soil water retention and suction in evaporation, particularly when atmospheric water demand is high and soil water availability is low.
Development and Validation of the Novel Pedotransfer Functions
Values of K1 and K2 were derived from Es measurements collected during the first year of the experiment (2019) using micro-lysimeters, with Equation 1 serving as the reference. Meteorological data were used to compute ET0 (Equation 3) and Epan (Equation 4), and both were correlated with soil water content measurements obtained via TDR sensors (Figure 6).

Correlation between soil water content and (a) K1 and (b) K2 for the first year of the experiment (2019).
The correlation coefficients of .46 and .50 were obtained using a significance level of less than 0.1% (p < .001). The results indicate a stronger relationship between K2 and soil water content, consistent with the results of Yan et al. (2012)
The PTFs developed for estimating K1 and K2 were tested using water content and other selected soil properties listed in Table 1. The PTFs with the highest correlation coefficient are listed in Table 2. Although the mathematical expressions for K1 and K2 are similar, the coefficients differ due to varying degrees of correlation between the parameters.
Derived pedotransfer functions (PTFs) for estimating K1 and K2..
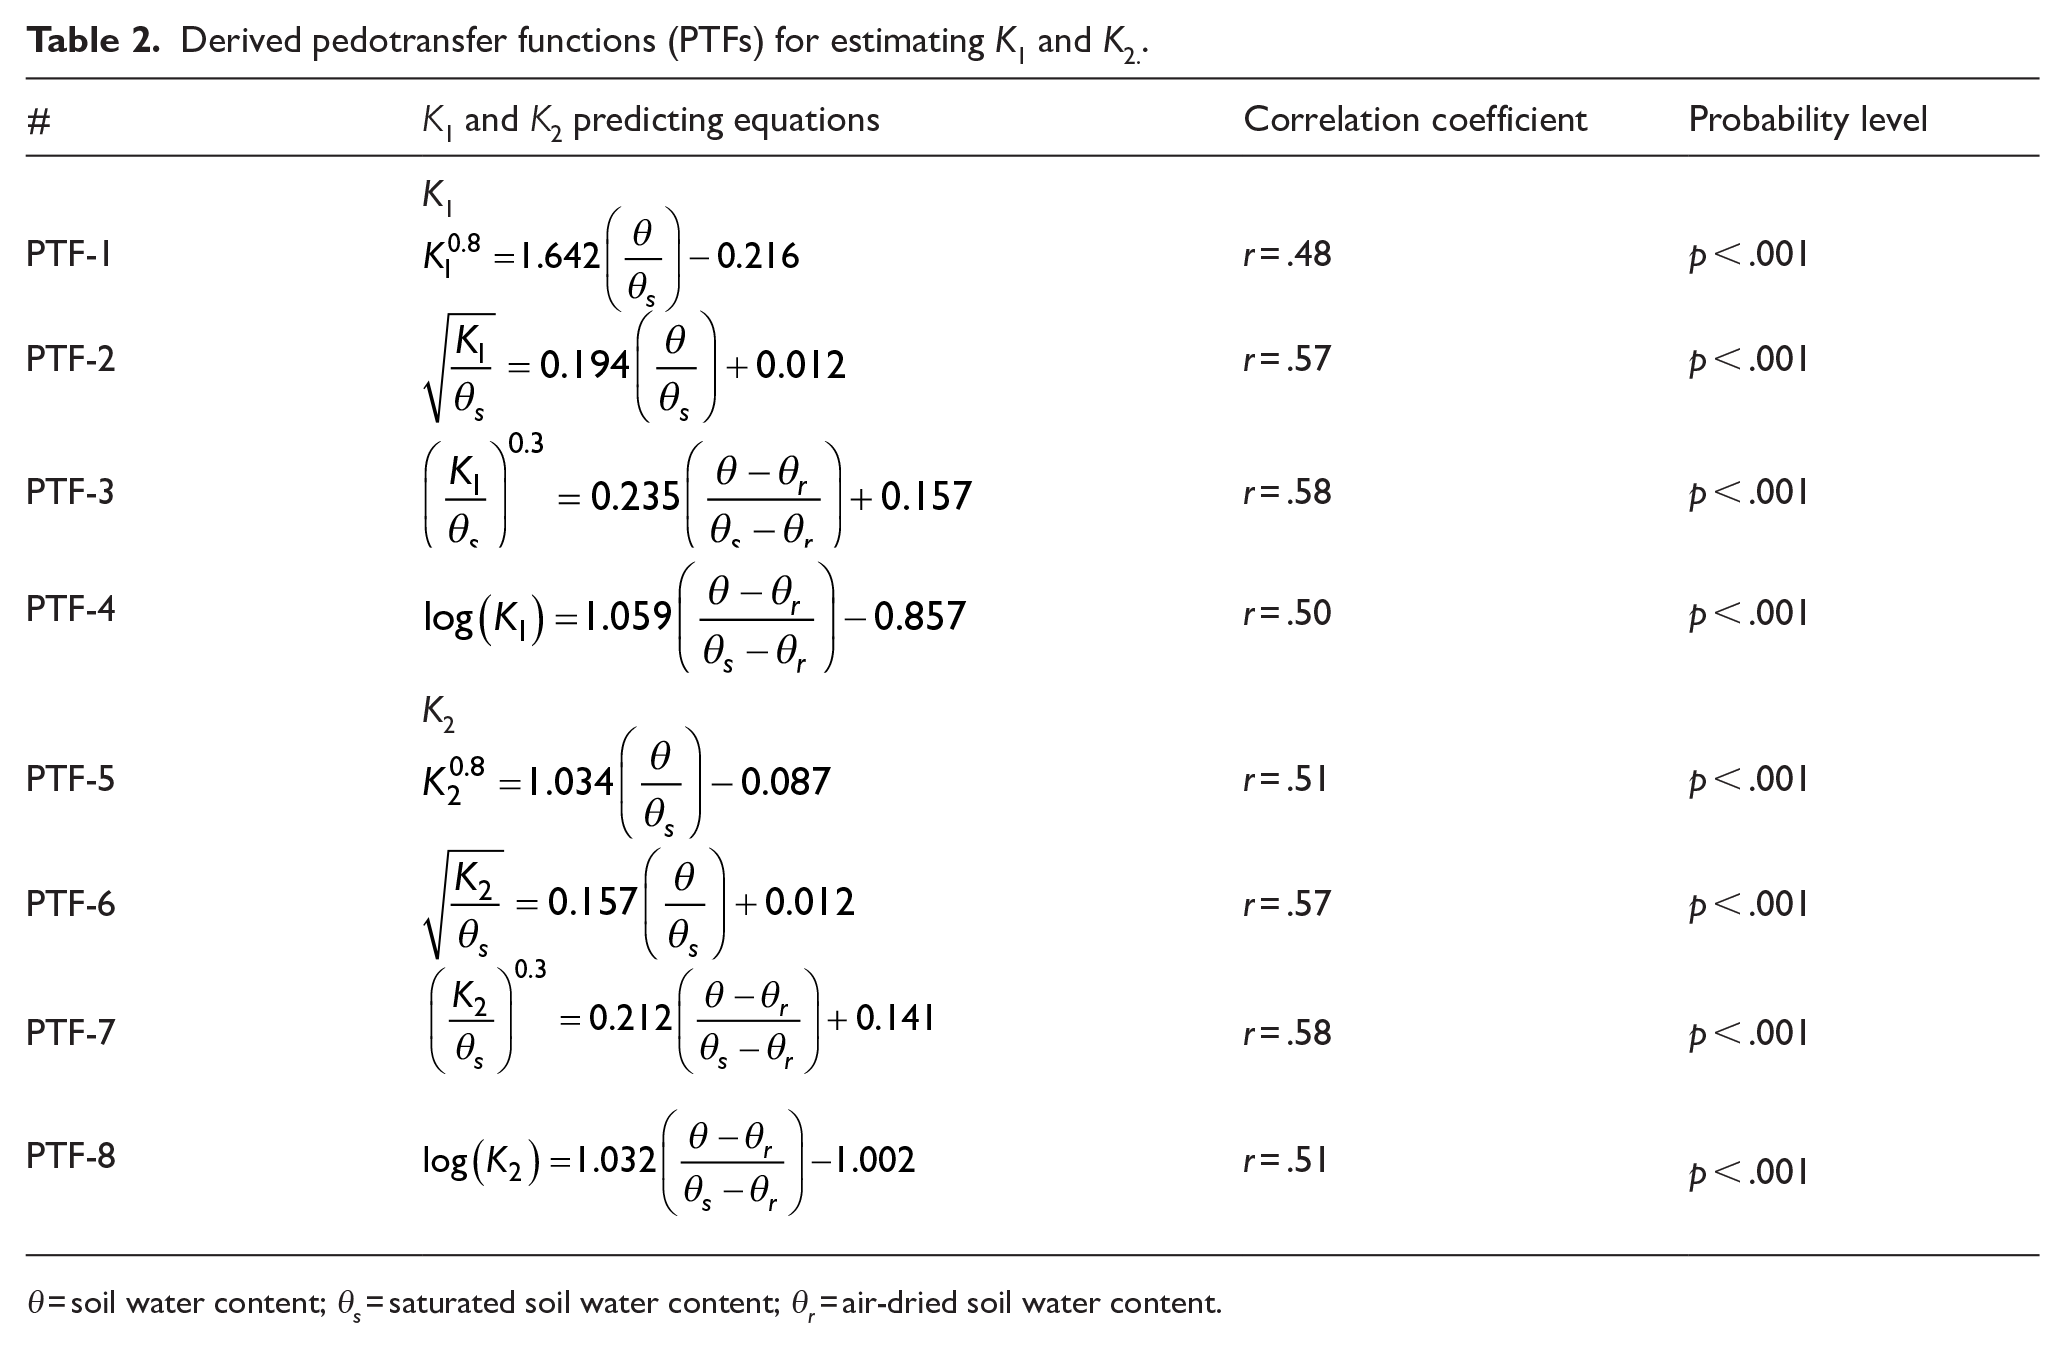
θ = soil water content; θ s = saturated soil water content; θ r = air-dried soil water content.
The estimates of K1 and K2 derived from the selected PTFs were used to calculate bare soil evaporation during the first year (between August 17th and October 25th, 2019) across all soil types. Figure 7 compares the measured and estimated evaporation values for micro-lysimeters 6 and 15, with similar trends observed in the other lysimeters. The figure demonstrates that the estimated evaporation, based on the predicted K1 and K2 values, closely aligns with the measured data, indicating good agreement between the model estimates and the observed evaporation rates.

Measured and estimated evaporation from bare soil using the derived pedotransfer function for the first year (2019): (a) micro-lysimeter #6 and (b) micro-lysimeter #15.
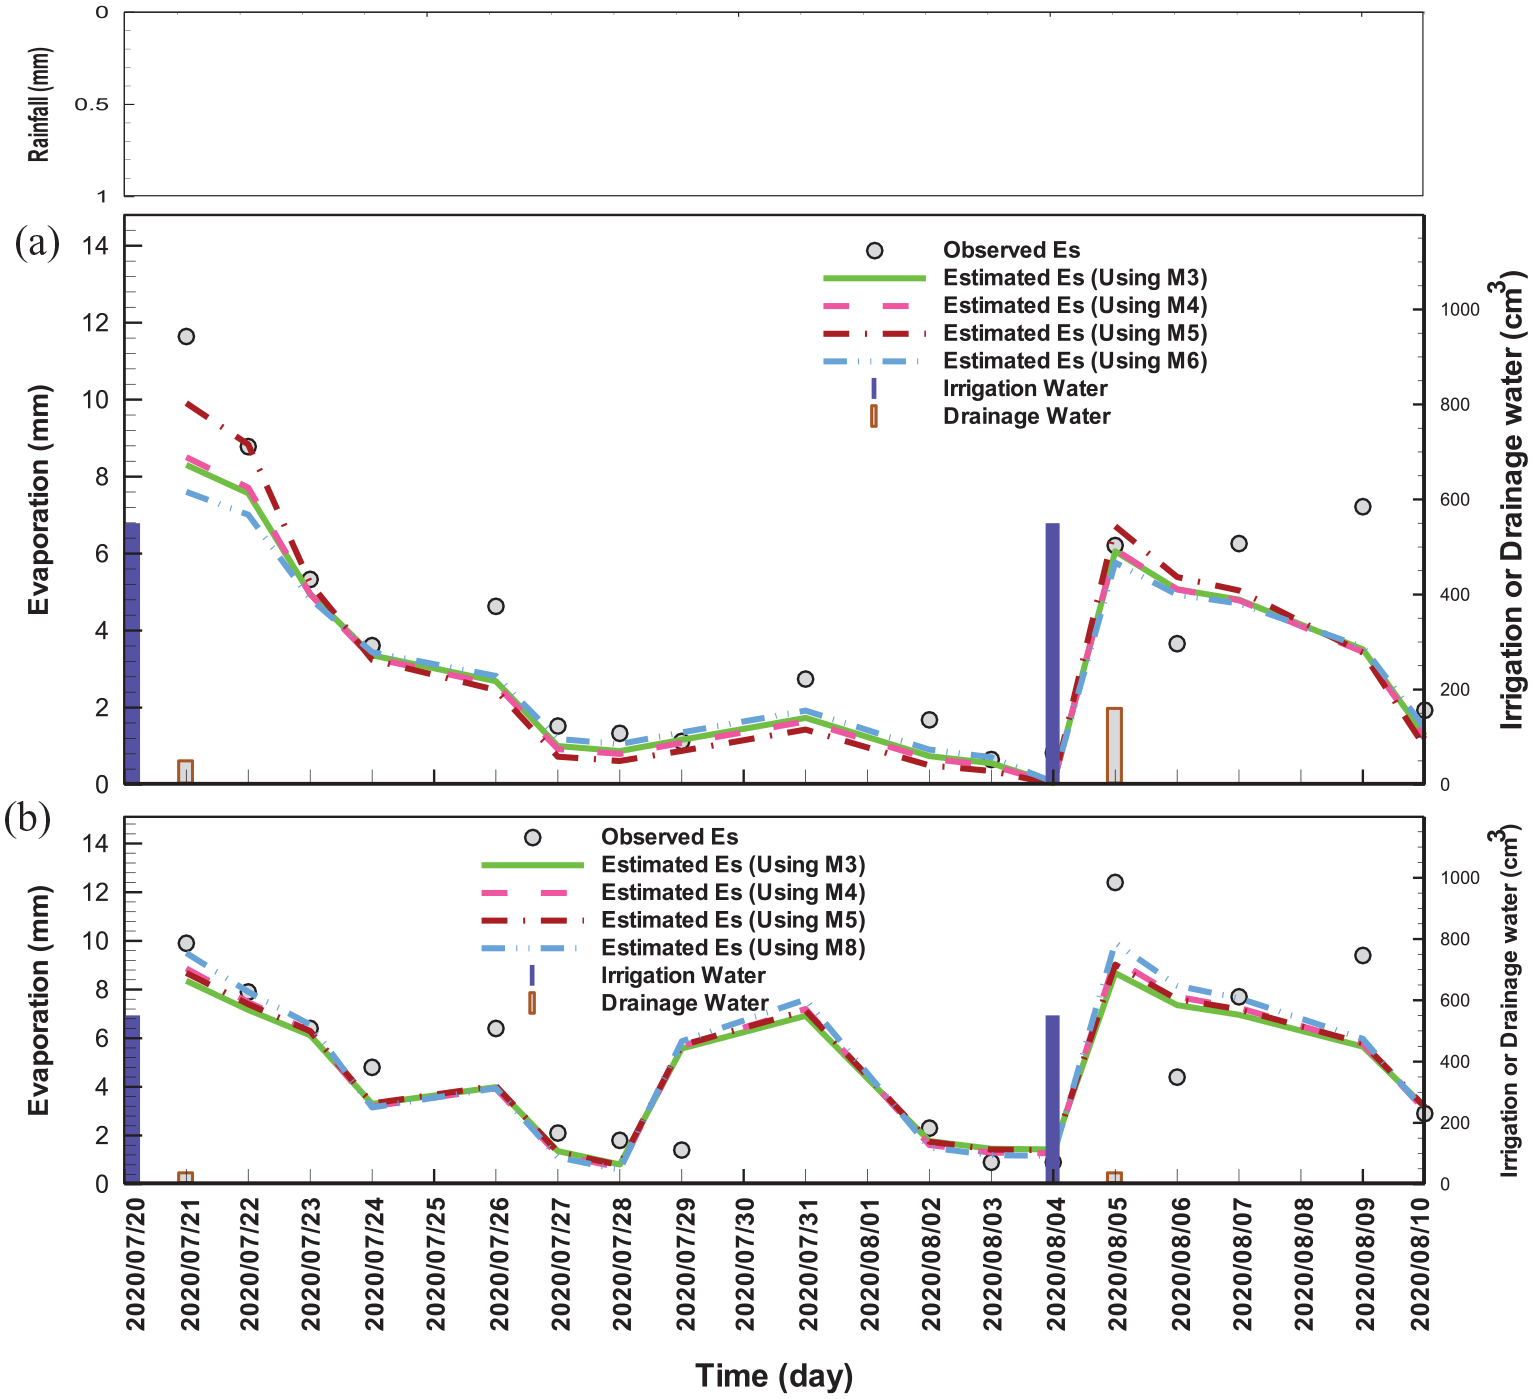
The performance of the selected PTFs for estimating K1 and K2 was evaluated using data from the second year of the experiment (from July 21st to August 10th, 2020). Figure 8 illustrates the agreement between observed and estimated evaporation for micro-lysimeters #6 and #15, while similar trends observed for other soil types. There results indicate that the PTFs successfully describe evaporation from bare soils.

Measured and estimated evaporation from bare soil using the derived pedotransfer function for the second year (2020): (a) micro-lysimeter #6 and (b) micro-lysimeter #15.
To evaluate the accuracy of the derived PTFs across all micro-lysimeters, Figure 9 presents the measured Es values alongside the corresponding estimates from the second year (2020), using the PTFs with the highest correlation coefficients: PTF-2 and PTF-3 for K₁, and PTF-6 and PTF-7 for K₂. The results indicate that most estimated values closely align with the 1:1 line, with over 91% falling within the 95% confidence interval.

Measured and estimated evaporation from bare soil for all micro-lysimeters using: (a) PTF-2, (b) PTF-3, (c) PTF-6, and (d) PTF-7 (dashed line represents 95% confidence limit).
The accuracy of these PTFs was evaluated using statistical measures such as ME, RMSE, and CRM, with results summarized in Table 3. PTF-2 had the lowest accuracy, while PTF- 3 had the highest, although the difference was minor. The RI of PTF-3 over PTF-2 was 5%, with the highest RI being approximately 5% (PTF-3 compared to PTF-2) and the lowest being around 0.4% (PTF-3 compared to PTF-6). Based on the CRM, 87% of micro-lysimeters exhibited overestimation, while 23% showed underestimation.
Statistical indexes comparing estimates of evaporation from bare soil using derived pedotransfer functions for the validation period (2020).

Development and Validation of Novel Physical Models
The physical models developed for estimating evaporation from bare soils during the first year (2019) were tested using soil water content and other selected physical properties listed in Table 4. The models with the highest correlation coefficients are presented in Table 4.
Derived Physical Models for Estimating Evaporation from Bare Soils (Es).

Note. θ = soil water content; θ s = saturated soil water content; θ r = air-dried soil water content; ρ b = bulk density (g cm−3).
Clay + Silt + Sand = 1.
Correlation coefficients of .52 and .56 were obtained at a significance level of p < .001. The results indicate that all physical models produced similar outcomes. However, among them, the M5 model exhibited a slightly higher correlation coefficient.
The derived physical models (Table 4) were used to calculate bare soil evaporation during the first year (August 17–October 25, 2019) across all soil types. Figures 10 and 11 compare the measured and estimated evaporation values for micro-lysimeters 6 and 15, with similar trends observed in other lysimeters. These figures demonstrate that the estimated evaporation closely aligns with the measured data, indicating strong agreement between the model estimates and observed evaporation rates.

Measured and estimated evaporation from bare soil using the derived four parameters physical models for the first year (2019): (a) micro-lysimeter #6 and (b) micro-lysimeter #15.

Measured and estimated evaporation from bare soil using the derived three parameters physical models for the first year (2019): (a) micro-lysimeter #6 and (b) micro-lysimeter #15.
The performance of the physical models was evaluated using data from the second year (2020). Figures 12 and 13 illustrate the agreement between observed and estimated evaporation for micro-lysimeters #6 and #15, with similar trends observed for other soil types. These results indicate that the derived physical models successfully describe evaporation from bare soils.

Measured and estimated evaporation from bare soil using the derived four parameters physical models for the second year (2020): (a) micro-lysimeter #6 and (b) micro-lysimeter #15.
Measured and estimated evaporation from bare soil using the derived three parameters physical models for the second year (2020): (a) micro-lysimeter #6 and (b) micro-lysimeter #15.
The accuracy of the derived physical models was similarly evaluated using ME, RMSE, and CRM, with results summarized in Table 5. Models M2 and M4 had the lowest accuracy, while M1, M3, and M5 had the highest, although the difference was minor. The CRM values indicate that PTFs generally overestimated evaporation, while physical models tended to underestimate it.
Statistical Indexes Comparing Estimates of Evaporation from Bare Soil Using Derived Physical Models for the Validation Period (second Year).

A comparison of PTFs and physical models (Tables 3 and 5) shows that overall, physical models performed better. One advantage of physical models over PTFs is that they do not require ET0 and Epan measurements. Although physical models rely on soil properties such as clay and silt content, these characteristics are typically known for most soils.
Discussion
The estimation of evaporation from bare soil surfaces in semi-arid environments remains a significant challenge due to the complex interactions between soil physical properties, climatic variables, and micro-scale processes (Mathias et al., 2023; Unkovich et al., 2018). The hydro-pedotransfer functions (PTFs) proposed in this study aimed to simplify the estimation process by integrating easily measurable soil parameters. Despite the moderate correlation values (r ranging from .52 to .58), the models provided statistically significant results (p < .001), indicating their potential applicability in field conditions.
Several studies report similar or even lower r-values when modeling evaporation under semi-arid or variable field conditions (Leuther & Diamantopoulos, 2024; V. P. Tran et al., 2016; D. T. Q. Tran et al., 2016). For instance, V. P. Tran et al. (2016, D. T. Q. Tran et al. 2016) reported r-values of .45 to .60 using lysimeter data in sandy loam soils, citing high spatial variability and atmospheric interactions as limiting factors. Similarly, Leuther and Diamantopoulos (2024) found that r-values rarely exceed 0.65 when modeling daily evaporation in Mediterranean climates. This highlights the difficulty of achieving high correlations in evaporation prediction models due to the transient nature of evaporation and its sensitivity to microclimatic changes.
The variations in model performance across soil types in our study are consistent with findings by Balland et al. (2008), who emphasized the influence of texture and structure on soil hydraulic properties. Our models performed slightly better in loamy soils than in sandy ones, likely due to the higher water retention and more stable evaporative behavior in the former. This agrees with Malik et al. (1992), who noted that evaporation from loamy soils exhibits smoother trends due to greater capillary continuity.
While more complex modeling approaches, such as PCA or machine learning, may offer improved precision, the goal of this study was to create a practical and field-applicable set of equations that require minimal inputs. Our approach aligns with the concept of pragmatic hydropedology described by Lin (2012), which emphasizes models that are grounded in observable field data and accessible parameters. Nevertheless, future work should include more advanced multivariate approaches to further interpret the interaction among variables and improve the robustness of the predictions.
The temporal inconsistency in data collection (2019 vs. 2020) could have influenced the lower model fit in some cases. Cloud cover, wind speed, and radiation differed slightly across the years, affecting evaporation rates. Similar inconsistencies were observed by Quinn et al. (2018), who documented daily evaporation variations up to 30% under nominally similar weather due to subtle changes in radiation and vapor pressure deficit.
Furthermore, the simplicity of the water balance method used (Equation 1) may not fully capture deep drainage or dew formation, both of which can introduce errors in daily evaporation estimation (Riedl et al., 2022). Despite these limitations, the method remains a widely accepted approach in field-scale studies (Shokri et al., 2019).
Our findings contribute to the development of regionally calibrated hydro-PTFs, which are critical for improving water management in semi-arid agricultural systems. These tools can support irrigation scheduling and soil water prediction in contexts where full hydrological modeling is not feasible. The moderate r-values should not obscure the utility of the models, especially when viewed as part of a broader soil monitoring strategy that incorporates field observations and remote sensing (Lukumbuzya et al., 2021).
Conclusions
This study proposed and evaluated a set of hydro-pedotransfer functions (PTFs) and physical models for estimating evaporation from bare soil surfaces in semi-arid environments, using basic soil physical properties. Despite the moderate correlation coefficients (r = 0.52–0.58), the models were statistically significant and offer a practical tool for rapid estimation of evaporation in data-scarce regions.
The findings revealed that soil texture plays a key role in model performance, with loamy soils yielding more stable estimates due to higher water retention. The analysis also highlighted the value of simple, field-applicable approaches in contrast to complex simulation models, especially in low-resource settings.
Although the models present some limitations in terms of accuracy under varying climatic conditions, their simplicity and reliance on easily obtainable data make them useful for initial assessments in agricultural water management.
In summary, the models developed in this study offer a valuable step toward more accessible evaporation estimation in semi-arid regions, especially for researchers and practitioners working with limited data or resources. Future research should aim to refine these models by expanding the dataset to include additional seasons and soil types, incorporating more robust multivariate techniques, and exploring hybrid modeling strategies that integrate both statistical and process-based components.
Footnotes
Author Contribution
Mina Amini: Data Curation, Formal analysis, Writing -review and editing. Ali Rasoulzadeh: Conceptualization, Investigation, Methodology, Formal analysis, review, and editing. Javanshir Azizi Mobaser: Conceptualization, Investigation, Methodology, Formal analysis, review, and editing. Yaser Hamdi Ahmadabad: Conceptualization, Validation, Methodology, review, and editing. Joseph A. P. Pollacco: Methodology, Visualization, Writing -review and editing. Jesús Fernández-Gálvez: Methodology, Visualization, Writing -review and editing.
Funding
The author(s) disclosed receipt of the following financial support for the research, authorship, and/or publication of this article: The authors would like to appreciate the financial support from the University of Mohaghegh Ardabili for this study (Grant No. 51-111134).
Declaration of conflicting interests
The author(s) declared no potential conflicts of interest with respect to the research, authorship, and/or publication of this article.