
Abstract
Root zone soil moisture (RZSM) is critical for irrigation management, as it directly affects plant water availability, crop growth, and irrigation scheduling. However, modeling RZSM is challenging due to the high variability and nonlinearity of soil moisture patterns. Physically based models, such as those solving Richards’ equation, offer detailed soil dynamics but require extensive hydrological parameters and significant computational resources. In contrast, statistical approaches are more efficient but lack physical interpretability. This study proposes an event-based framework that models soil moisture increases following individual water input events (e.g., precipitation, irrigation). Water balance models are designed to simulate moisture changes within each soil layer, while an XGBoost ensemble captures interlayer interactions. By embedding the machine learning model within physically structured equations, the approach ensures both accuracy and interpretability. The model was applied using soil moisture sensor data collected from weather stations with and without crops in Florida. Results show strong accuracy in event-pattern identification and the modelling of event-scale duration and magnitude behavior across locations.
Introduction
Ensuring sustainable agricultural production is a critical global challenge, intensified by environmental pressures and the severe limitation of natural resources, especially water. Efficient water management has become paramount, fundamentally transforming traditional practices. For instance, in regions of the southeastern United States, particularly Florida, urbanization and diverse water demands have led to increasing agricultural water scarcity, necessitating advanced water use prediction models (Qi et al., 2020). Current irrigation often wastes water due to a lack of information on subsurface moisture conditions, which rely on surface ground moisture (Orloff et al., 2003). Soil moisture governs the exchange of water movement and redistribution within the root zone, serving as a key parameter for agricultural processes. Root zone soil moisture (RZSM) directly represents the water availability for plants. Both deficits and excesses significantly impact crop growth and yield. Therefore, accurate RZSM prediction is important for optimizing irrigation scheduling, maximizing water use efficiency, and enabling proactive water resource allocation. These efforts directly support agricultural sustainability. However, RZSM is complex to predict. This is due to its dramatic spatial variability and nonlinear dynamics, influenced by external water input, internal soil properties, topography, and crop water absorption. These multi-scale impact behaviors make the modeling of RZSM a challenge in agricultural science and practice.
The vertical heterogeneity of soil adds more complexity to RZSM prediction. For example, a low permeability intermediate layer (e.g. coarse sand beneath finer soil) can be a capillary or barrier that blocks moisture retention and redistribution. Recently, a study has shown that when modeling soil moisture in a layered model, vertical water movement is highly dependent on depth, texture, and initial moisture status (Z. Zhang & Huang, 2021). Soil in different depths typically consists of layers, each possessing distinct texture, porosity, and hydraulic conductivity. For instance, a middle layer (around 4–6 in underground) with low permeability can act as a capillary barrier. This slows down the infiltration rate and results in a different moisture retention level for both the layers above and below it (Y. Wang et al., 2025). These interlayer connections make traditional statistical approaches, which often treat the root zone as one bucket, and fail to accurately model the layered RZSM due to their inherent lack of depth-dependent dynamics. While high-resolution simulations of soil physics by physics-based models (e.g. solving Richards’ equation) can capture core short soil interlayer connectivity, they require detailed discretization and environmental parameters. These requirements are impractical for many agricultural stakeholders, particularly small-scale farmers, who often lack the budget and equipment to collect environmental parameters such as soil hydraulic functions (e.g. water retention and conductivity), physical soil layer structures, and detailed boundary conditions. Obtaining such data requires laboratory analysis and specialized field equipment, which small-scale farmers often cannot afford or access.
This reveals a fundamental trade-off. Physically based models (e.g. Richards’ or Hydrus) ensure physical realism but are computationally intensive and sensitive to uncertain inputs. In contrast, data-driven models (e.g. statistical methods, machine learning algorithms) do not require detailed environment parameters and can capture complex patterns but lack physical grounding and interpretability due to those models learning from data without a physical rule guide. This leaves a gap in current RZSM modeling for practical agricultural applications. Therefore, a hybrid approach capable of preserving physical dependence while effectively learning complex data correlations is needed.
Previous studies have applied data-driven models to multi-layer soil moisture for irrigation scheduling. For example, a study (Adeyemi et al., 2018) used dynamic neural networks to predict multi-depths soil moisture dynamics for control of irrigation, and another study (Gu et al., 2021) developed a soil moisture neural network model to support irrigation scheduling decisions. These approaches demonstrate the performance on multi-layer soil moisture modeling, but without explicitly define physical rules or water balance between layers. In contrast, our framework adopted XGBoost models within layered water balance structure, so that interlayer water flow and soil moisture interlayer changes remain mass-conserving while still allowing flexible, nonlinear responses. An event-based modeling strategy is proposed to embed physical constraints directly into a machine learning framework. Within this structure, a series of XGBoost models is aligned with multilayer water balance equations, where each model handles a distinct layer while remaining intrinsically linked through the water balance equation. This hybrid architecture enables interpretable, physically consistent, and computationally efficient RZSM prediction.
Data and Methodology
Scope of Study
This study is part of a broader project (2021–2026) to develop high-resolution RZSM maps that inform precise irrigation decisions and water conservation practices in vegetable farms in Florida, US. The crop of interest is sweet corn in a breed (Sweet Corn Hybrid: se/sh2) that roots down to approximately 11 in based on on-site observation. Data collected in this project is in hourly time series for weather data and 15 min timestep for soil moisture data gaged for the entire root zone, obtained from 31 observation sites in the Florida Automated Weather Network (FAWN; naturally impacted condition) and three sweet corn farms in Florida (farming operation impacted condition). Figure 1 shows the geographical distribution of the FAWN and farm sites along with a brief illustration of the precipitation events (see section 2.4.5) that will be used for modeling in this study.
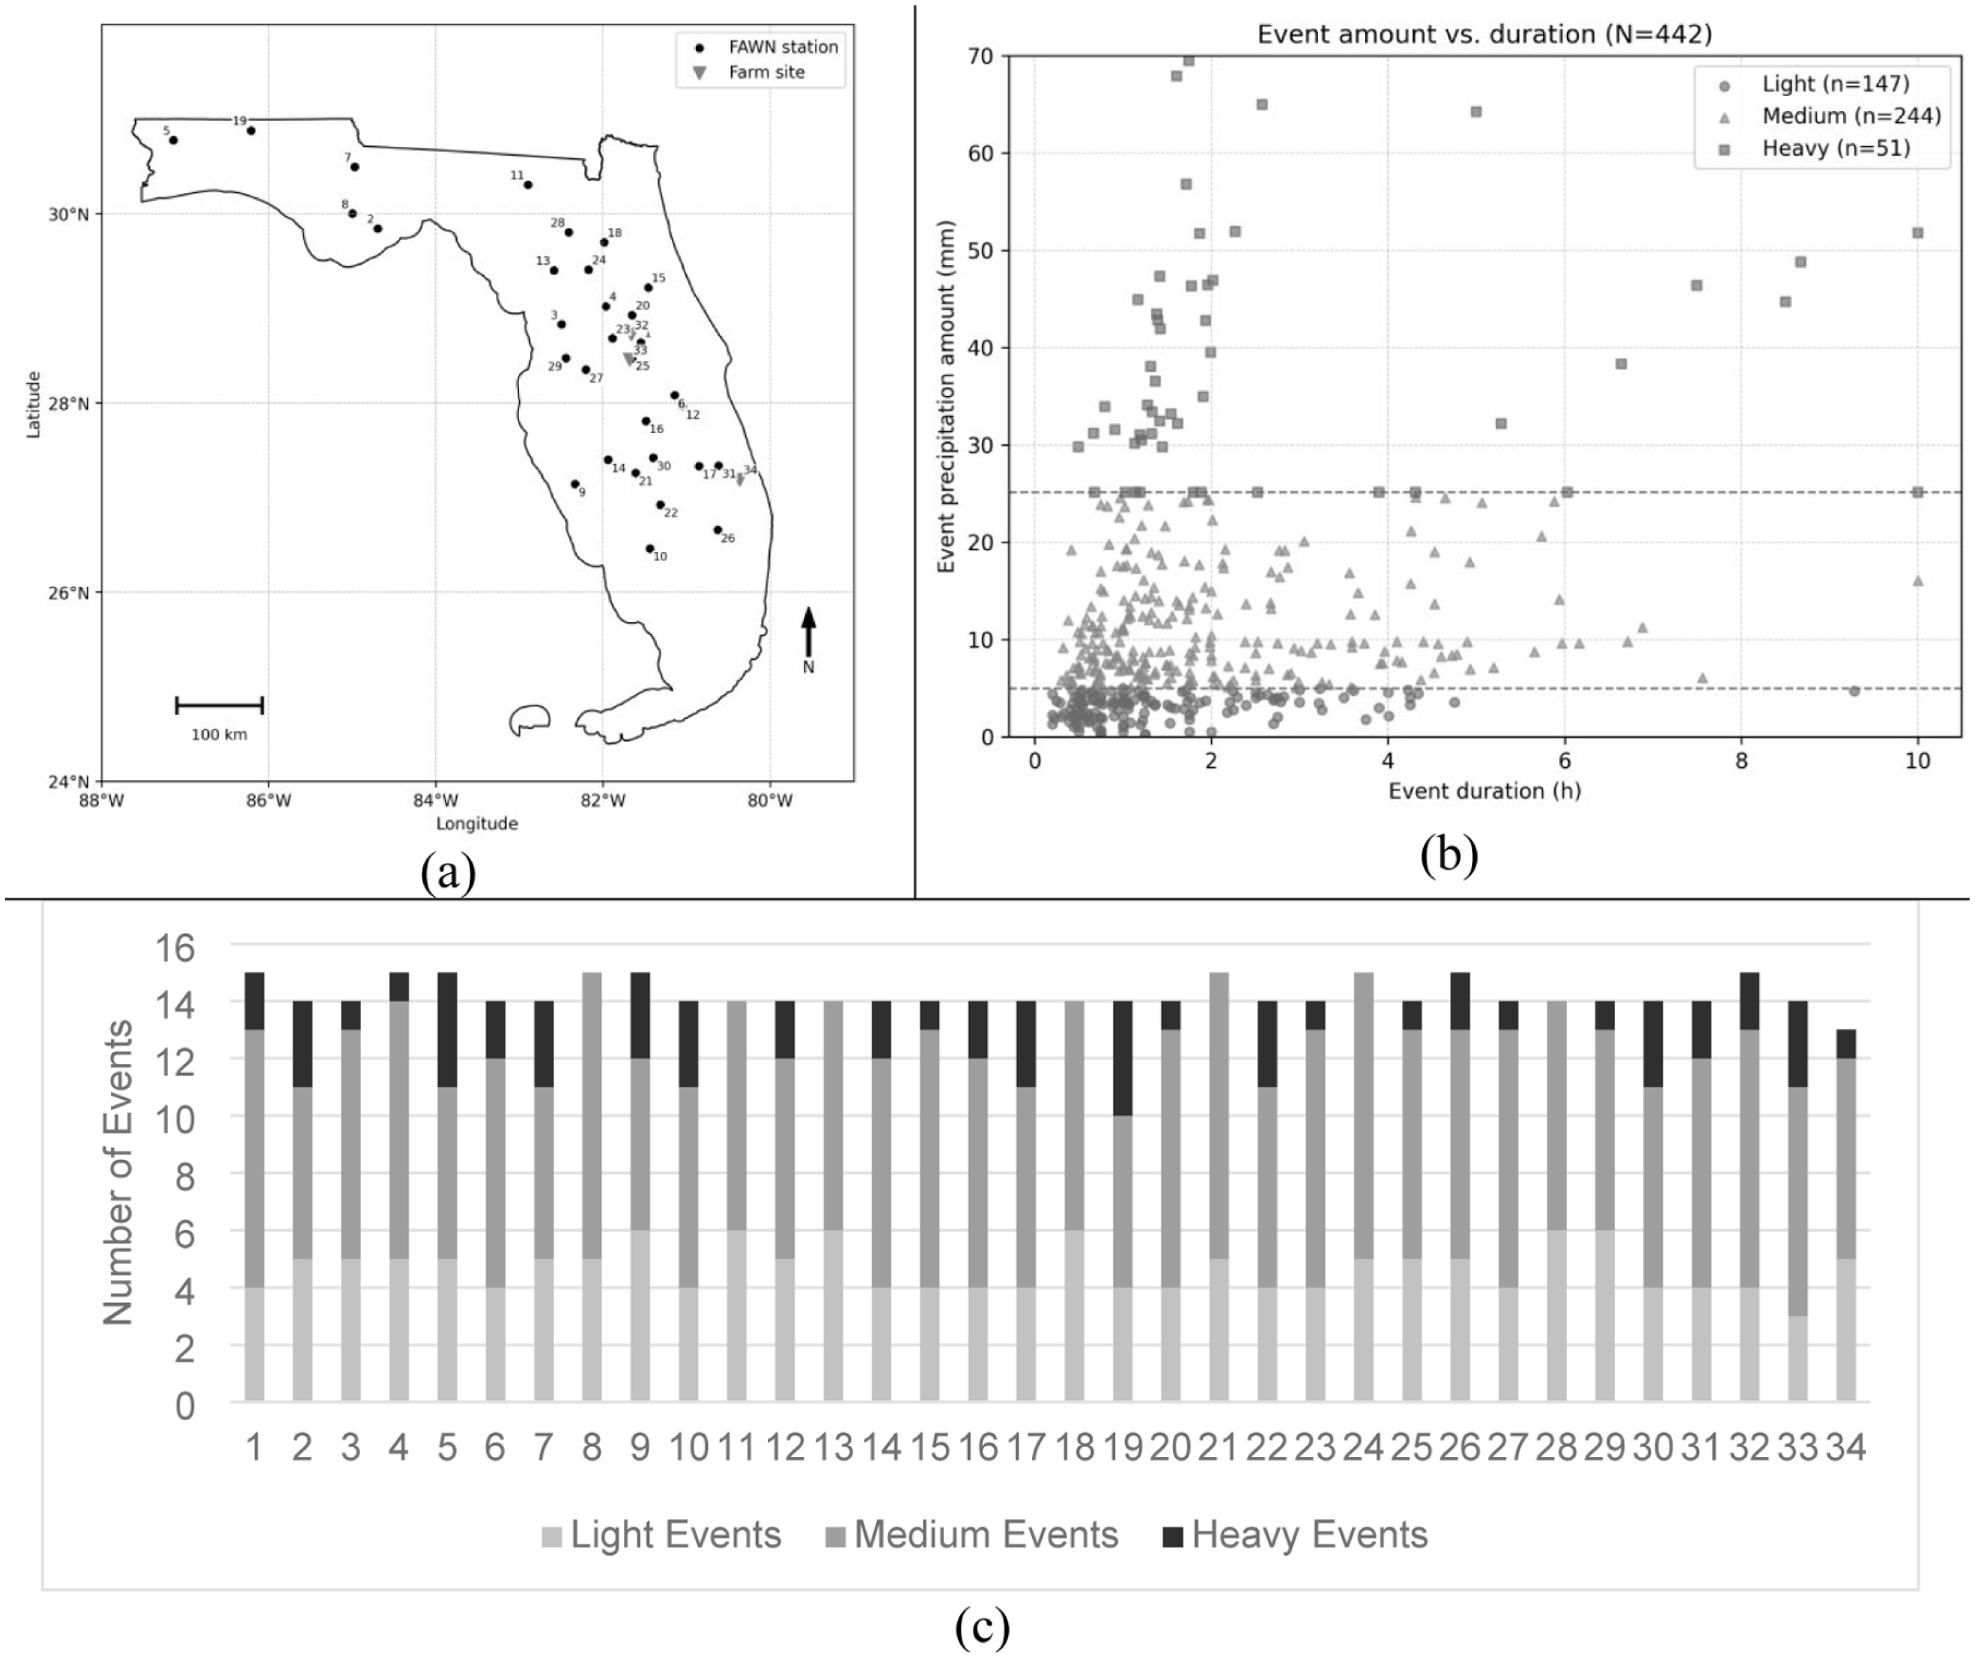
(a) Study area in Florida, USA, showing the geographic distribution of selected FAWN stations (black circles) and farm sites (gray triangles) with in-situ soil moisture sensors used in this study. The numbers of precipitation events are labeled to the corresponding sites, (b) scatter plot of event precipitation amount (mm) versus event duration (h) for all events (N = 442). Points are grouped into light, medium, and heavy classes using the dashed threshold lines, and (c) the distribution of different precipitation events (see definition in section 2.4.5) for each sites.
The focused area is characterized by its sub-tropical climate and sandy soil, influencing the design of the methodologies. The local weather is characterized by short-term, intensive late afternoon convections and strong solar radiation. The soil type is associated with high infiltration and percolation capacity. Both characters indicate prompt soil moisture responses to surface water input, leading to relatively prompt interactions across soil layers and high alignments of change phases across root zone soil compared to other loamy or clay soils. Thus, the RZSM dynamics are divided into two phases, increase and decrease, for individual modeling. This study focused on modeling increase phases of soil moisture using machine learning methods directed by physically based water balance models. The decrease phase will be modeled using data-driven pattern fitting methods to determine the profile of the specific drying process in a companion paper (Zhang & Yu, in progress).
Data
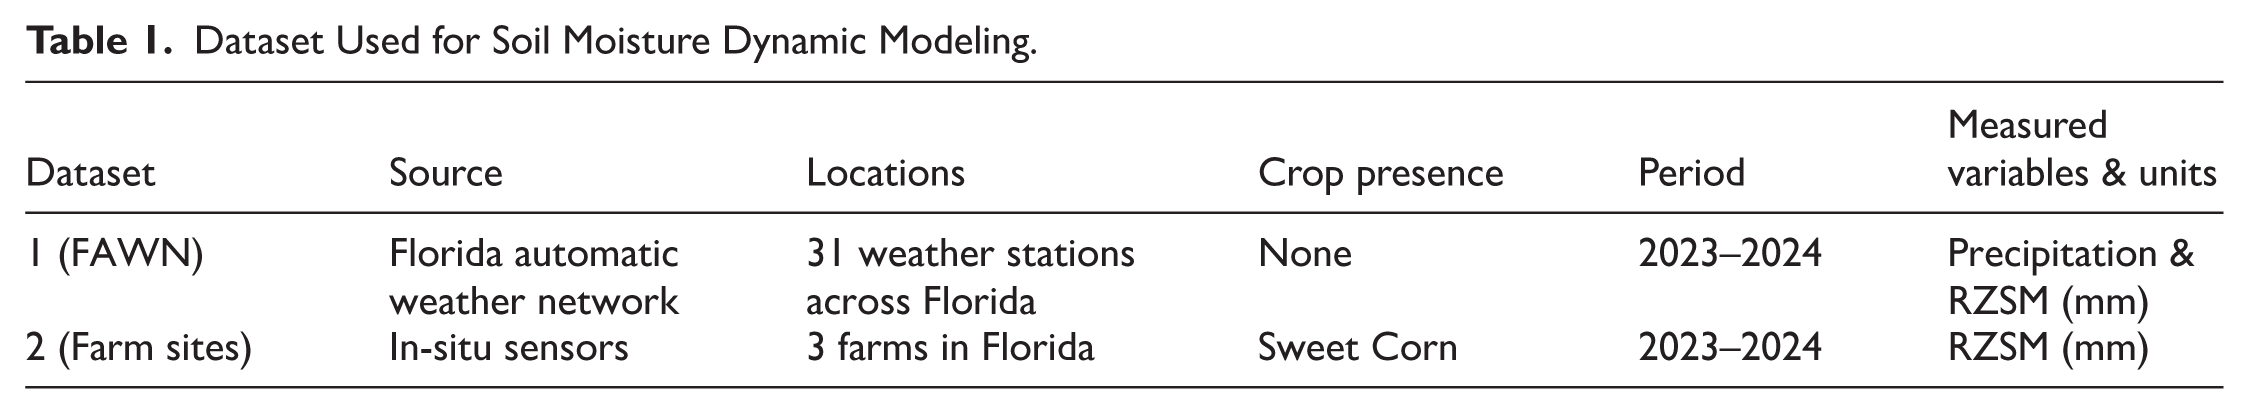
This study utilizes two distinct datasets. Dataset 1 comprises weather and soil moisture data collected from 31 locations within the FAWN. This dataset originates from weather stations without planted crops. Dataset 2 includes weather and soil moisture data from three farms planted with sweet corn situated within Florida. The weather data for those farms is acquired from the nearest weather station of FAWN. Soil moisture was measured in soil water amount (equivalent water depth (mm)) at 2, 6, and 10 in below the ground using soil moisture probes (Sentek Drill & Drop™, Sentek Technologies, Adelaide, Australia; See Appendix for details). To facilitate the water-balance modeling, the key measurements for water balance model, precipitation and soil moisture values, are converted to an equivalent water depth (mm). The dataset structure is shown in Table 1.
Dataset Used for Soil Moisture Dynamic Modeling.
All soil moisture and precipitation data were subjected to a quality control procedure before event extraction. The quality control procedure removed low quality data that is caused by sensor malfunctions or show unrealistic values (e.g. negative volumetric water content, persistently saturated readings under clear weather) with multiple data quality check procedures (e.g. outlier detection, pattern misalignment, correlation across different measurements, etc.).
Determining Soil Moisture Increase Event
Soil moisture increases are driven by external water input events (e.g. precipitation or irrigation). Modeling soil moisture increases dynamics on an event basis makes it possible to isolate and analyze the fast infiltration and water redistribution, avoiding interference from soil moisture drying (e.g. evaporation). We define soil moisture increase events based on precipitation events determined by a 3-hr interevent dry period (see Appendix for details). The start of a precipitation event triggers a soil moisture event. The soil moisture event concludes when moisture levels peak, not necessarily when the precipitation ends. Figure 2 shows the workflow for identifying soil moisture increase events corresponding to water input events. Each detected event is characterized by three components: the start timestamp, end timestamp, and the accumulated water input amount during the event. The start timestamp is defined as the first upward deviation in soil moisture after the water input begins. The end timestamp is set when soil moisture reaches its peak or begins to decrease. This structured data format prepares data for subsequent model establishment.
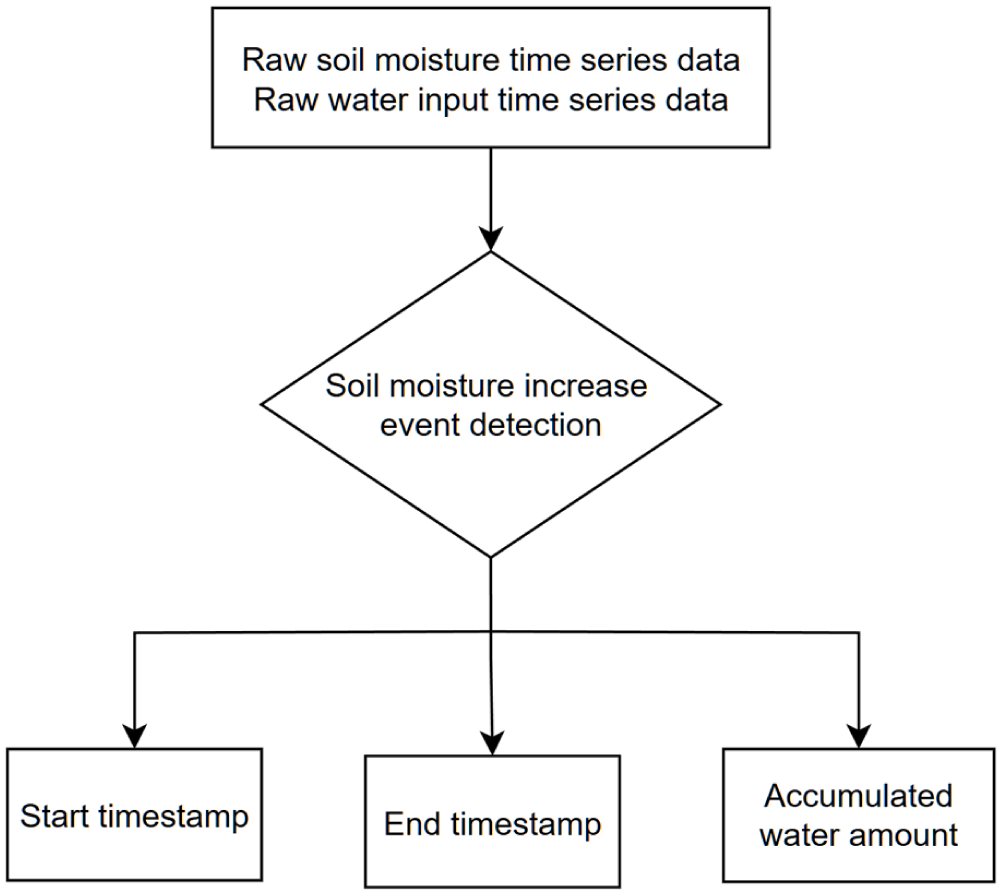
Soil moisture increases the event preparation workflow.
For modeling purposes, the event characteristics will be used to extract key features, including initial soil moisture (corresponding to start timestamp), water input amount and duration (associated with water input events), soil moisture increased amount (based on end timestamp), and soil moisture increased duration (difference between end and start timestamps), for building a RZSM model. Before training, the combined event data are randomly split into training and validation subsets using an 80% to 20% ratio.
Modeling Framework
This section presents a modeling approach that integrates the physical water balance equation with a machine learning algorithm to estimate soil moisture increase due to surface water input. The model simulates how surface input redistributes vertically across soil layers during short infiltration events. Layered water balance equations provide structural inputs to the XGBoost model, where soil moisture change in each layer is estimated as a function of incoming water, antecedent moisture, and interlayer connectivity.
According to Florida weather pattern and collected weather data, the precipitation durations are typically range from half to 3 h (Figure 1), and daily reference evapotranspiration are 3.5 to 4.5 mm/day under humidity Florida environment (Irmak et al., 2003; Martinez & Thepadia, 2010). Thus, two key assumptions underline this model framework. First, vertical flow dominates during the short increase phase in sandy soils (Porporato et al., 2002; Western et al., 2004), so that horizontal water movements can be neglected. Second, evaporation, crop water uptake, and drainage are negligible during this period since the duration of infiltration is too short for evaporation to significantly affect the water balance (Vereecken et al., 2008; Zreda et al., 2012). Additionally, since this study is for irrigation management, which does not require fine temporal resolution, we assume that the detailed fluctuations of soil moisture during a precipitation event period are generally not critical for irrigation scheduling and can be ignored for modeling. Instead, the study should emphasize simulating the initial and end soil moistures corresponding to a water input process. This approach is consistent with Singh’s soil moisture event study (Singh et al., 2021) that quantify rainfall driven responses using change magnitude and response time rather than the complex non-linear soil moisture characteristics.
Water Balance Model
The water balance model in this project is designed by soil layers. Figure 3 shows how water redistributes when the water is input into the soil surface (Layer 1: Topsoil, 2 in). Under the assumption of negligible horizontal water movements, evaporation, crop water uptake and drainage, water is directly input into the soil and redistributed in two ways, either being retained in Layer 1 based on its soil water holding capacity or percolating downward into the subsoil layer (Layer 2) as Downward 1.
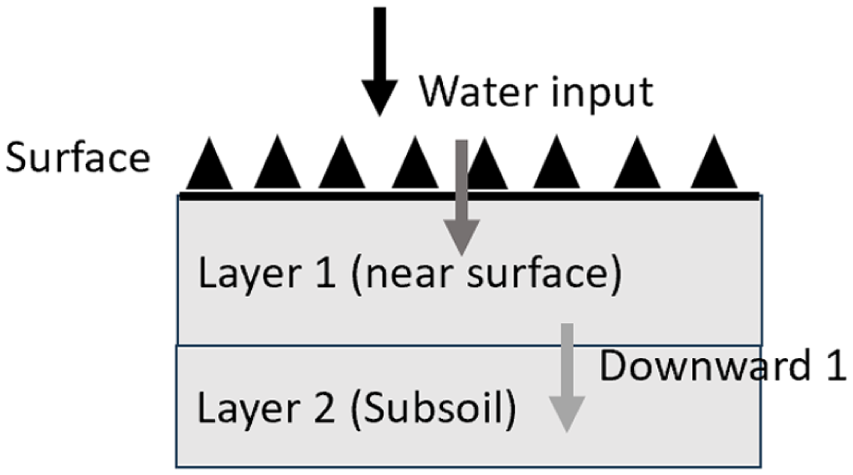
Conceptual diagram of soil moisture infiltration.
These two ways of water redistribution are represented by water balance equation (1).

From equation (1), the total amount of water is conserved, which indicates that the water input into the soil on the left side of the equation and the right side of the equation represents the water transferred from layer 1 to layer 2 (
In practice,
Now based on the information we have, the variables can be used as input parameters are:

Where
Based on the input parameters
The model predicts two outputs:

Where
Then the
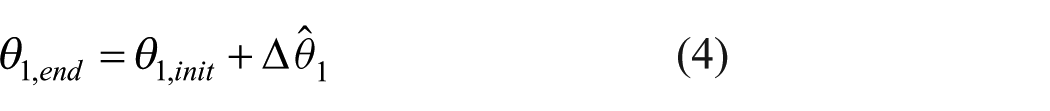
Submitted equation (4) into equation (1) gets:

Equation (5) shows the water flow intuitively, the downward out water from layer 1 equals to total external water input minus the moisture remaining in layer 1.
The specific water balance models for Layers 2&3 are similar to Layer 1 and provided in detail in the Appendix.
The Interconnection of the Three Water Balance Equations
The interconnection of water balance equations for three soil layers are shown in Figure 4 in terms of parametrization for modeling soil moisture dynamics. The surface layer (2 in) is the layer directly accepting the external water input and antecedent moisture. The model returns the surface layer soil moisture increase (amount and duration) and, by water balance, the downward outflow from Layer 1 to Layer 2. Layer 2 (6 in) is then driven by this downward water and Layer 2 antecedent moisture, the model for Layer 2 then outputs its soil moisture increase and the residual downward water to Layer 3. The deepest layer (10 in) responds to the water downward from Layer 2 and its antecedent moisture, producing its soil moisture increase and the residual percolation beneath the root zone. This top-down structure enforces water mass conservation and encodes the physical dependence on the retention and percolation behavior of overlying layers.
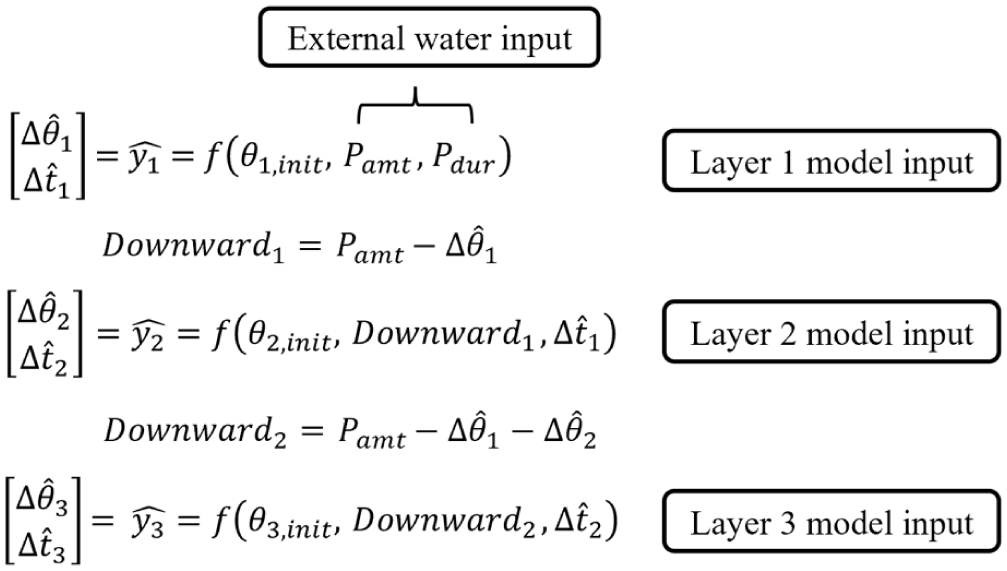
Schematic representation of the hierarchical interconnection of soil moisture responses across three soil layers (2 in, 6 in, 10 in).
Modeling Approach
This project employs XGBoost to simulate the soil moisture dynamics based on the framework described in 2.4.2. The detailed methodology selection is provided in the Appendix.
XGBoost is a scalable implementation of gradient-boosted decision trees. In gradient boosting, an ensemble of shallow regression trees is built in sequence, where each new tree “learns” to correct the errors (residuals) of the previous ensemble. The predictions are additive: the model starts with an initial estimate (e.g. average value) and sequentially adds trees that predict the remaining error. This technique allows the model to gradually refine its predictions, capturing complex patterns in the data. In addition, XGBoost includes a regularized objective function that penalizes model complexity, which helps to prevent overfitting even as many trees are added. XGBoost objective for regression can be written as:

Where
Decentralized XGBoost Model Ensemble
Most of hydrological modeling employes centralized modeling that provide a single robust model to simulate systems across different sites by using all data for training neglecting the representativeness of each site. Some researchers pointed out that in hydrology and environmental prediction, cross-site transfer depends strongly on hydrologic similarity and site characteristics, and it can be risky when the key controlling attributes (e.g. soil storage, aridity, or other watershed/soil properties) are missing or not represented in the inputs (Chang & Rubin, 2019; Song et al., 2019). Our event dataset is not evenly distributed across locations and the event allocation is very site specific, so a centralized model can be biased toward data-rich sites and conditions, which is a known challenge in hydrologic ML when training data are imbalanced.
Therefore, rather than lumping all data to train a single centralized model for all locations and soil layers, this project adopts a decentralized approach that develops independent models for each location and each soil layer. Such process may reduce the risk of overfitting that a single location’s poor or superior data quality or amount influence the model’s performance. This logic is consistent with the guidance that performance in multi-site environmental prediction often improves when model explicitly account for site characteristics and process context (Willard et al., 2025).
In this study, there are 31 locations equipped with soil moisture and weather sensors provided by FAWN and on-farm sites. The distribution of these events shows obvious non-uniformity in terms of scattered location of events in Figure 1b, and the segment of event types across locations in Figure 1c. It is more obvious in heavy events, which are distributed in two separated clusters over the duration in Figure 1b, and show noticeable discrepancies across locations Figure 1c. If using centralized model, the heavy events in the left cluster (<4 hr) will overfit the model making long heavy events not represented. In addition, the locations without observed heavy locations may receive an average guess from other locations’ events without knowing the confidence of its representative to the location conditions. Therefore, a decentralized modeling framework is used in this study to provide a conservative modeling for every individual location using the corresponding data. In this way, the uncertainties of varying soil properties, weather, and farming operations across different locations will not be counted as factors of bias attributed to overfitting. Instead, the impact of inaccuracy is restricted within very single location due to limited data size. However, this project is expected to serve for a long period of time during which observations could be continuously collected to enrich the data and update the models, improving the accuracy overtime.
At each location, a separate ensemble of three XGBoost models is developed, one for each soil layer (e.g. 2, 6, and 10 in). This gives a total of 93 XGBoost models (31 locations × 3 layers). By designing models in this decentralized way, each XGBoost model ensemble focuses on the unique soil and weather dynamics at its specific location. In a single location, the three-layer-specified XGBoost models are designed according to the connected water balance equations in Section 2.4.2.
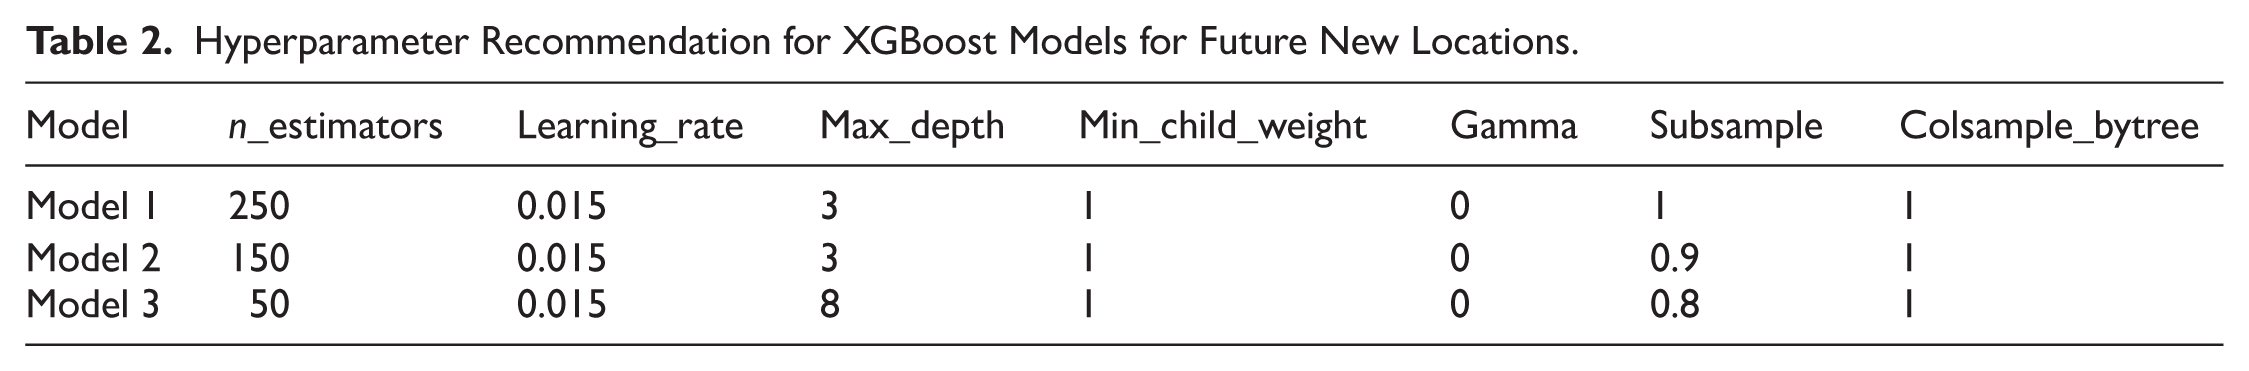
But due to the limited data volume and the decentralized design, to mitigate the potential problem of accuracy, each model has been individually tuned using Bayesian optimization to find the localized suitable XGBoost hyperparameters to improve the robustness of the model (see Appendix). However, manually tuning each model becomes a challenge once there are new locations included in the system. To simplify the further implementation of the system, recommendation values for hyperparameters are generated by identifying the most statistically representative value for each hyperparameter based on all existing locations. The recommended hyperparameters are presented in Table 2, and the detailed tuning procedure is provided in the Appendix. The development of the model employs a train-test split approach with 80% of water input events (442 events) from all locations to train location-specific XGBoost model ensembles, and the remaining 20% (99 events) are used for prediction and validation.
Hyperparameter Recommendation for XGBoost Models for Future New Locations.
Evaluation Strategy
To evaluate the performance of the XGBoost model ensemble, this study uses both qualitative and quantitative metrics. Qualitative metric checks the XGBoost model ensemble’s ability to detect soil interlayer connectivity. For example, if a light event showing soil moisture increases in layer 1 may not be qualitatively modeled if it also shows soil moisture increases in layer 3. The quantitative metric focuses on the accuracy of the predicted change in soil moisture amount and duration. Three representative types of precipitation events, determined by the depth of water percolation, have been selected to show the evaluation process. If soil moisture increases are observed in all three layers, this event will be defined as a heavy precipitation event, while medium and light events trigger soil moisture increases in layer 1&2 and layer 1, respectively.
The XGBoost model’s overall performance is examined by summarizing both qualitative and quantitative metrics for all precipitation types in all locations. The correct detection of whether the soil moisture in each soil layer increases is defined as the qualitative measure of the performance of this model, as the pre-condition to investigate the magnitude of change. The overall quantitative metrics are represented by three evaluation errors: the differences of duration (delta duration), the increased soil moisture (delta increased soil moisture) between predictions and observations, and their product, delta duration × delta increased soil moisture.
Results
Interlayer Soil Moisture Response (Heavy Precipitation Event)
Figure 5 illustrates the soil moisture response across three layers during a heavy precipitation event on June 21, 2023, that randomly selected from FAWN, with a total rainfall of 56.9 mm and an intensity of 37.9 mm/h, causing moisture increases in all three layers. From a qualitative perspective, the XGBoost model ensemble correctly captures these increases across all layers. Quantitatively, in the surface layer (moisture_1), the predicted soil moisture increase was 0.45 mm lower than observed, with the modeled value reaching peak 1 min earlier. In the subsoil layer (moisture_2), the predicted increase exceeded the observed value by 0.04 mm, with a 9-min delay in reaching the peak. In the bottom layer (moisture_3), the model underestimated the increase by 0.44 mm and predicted the peak 5 min earlier. The observed curves confirm that all three layers responded to the precipitation event, and the model reproduced these patterns with close agreement in both timing and magnitude.
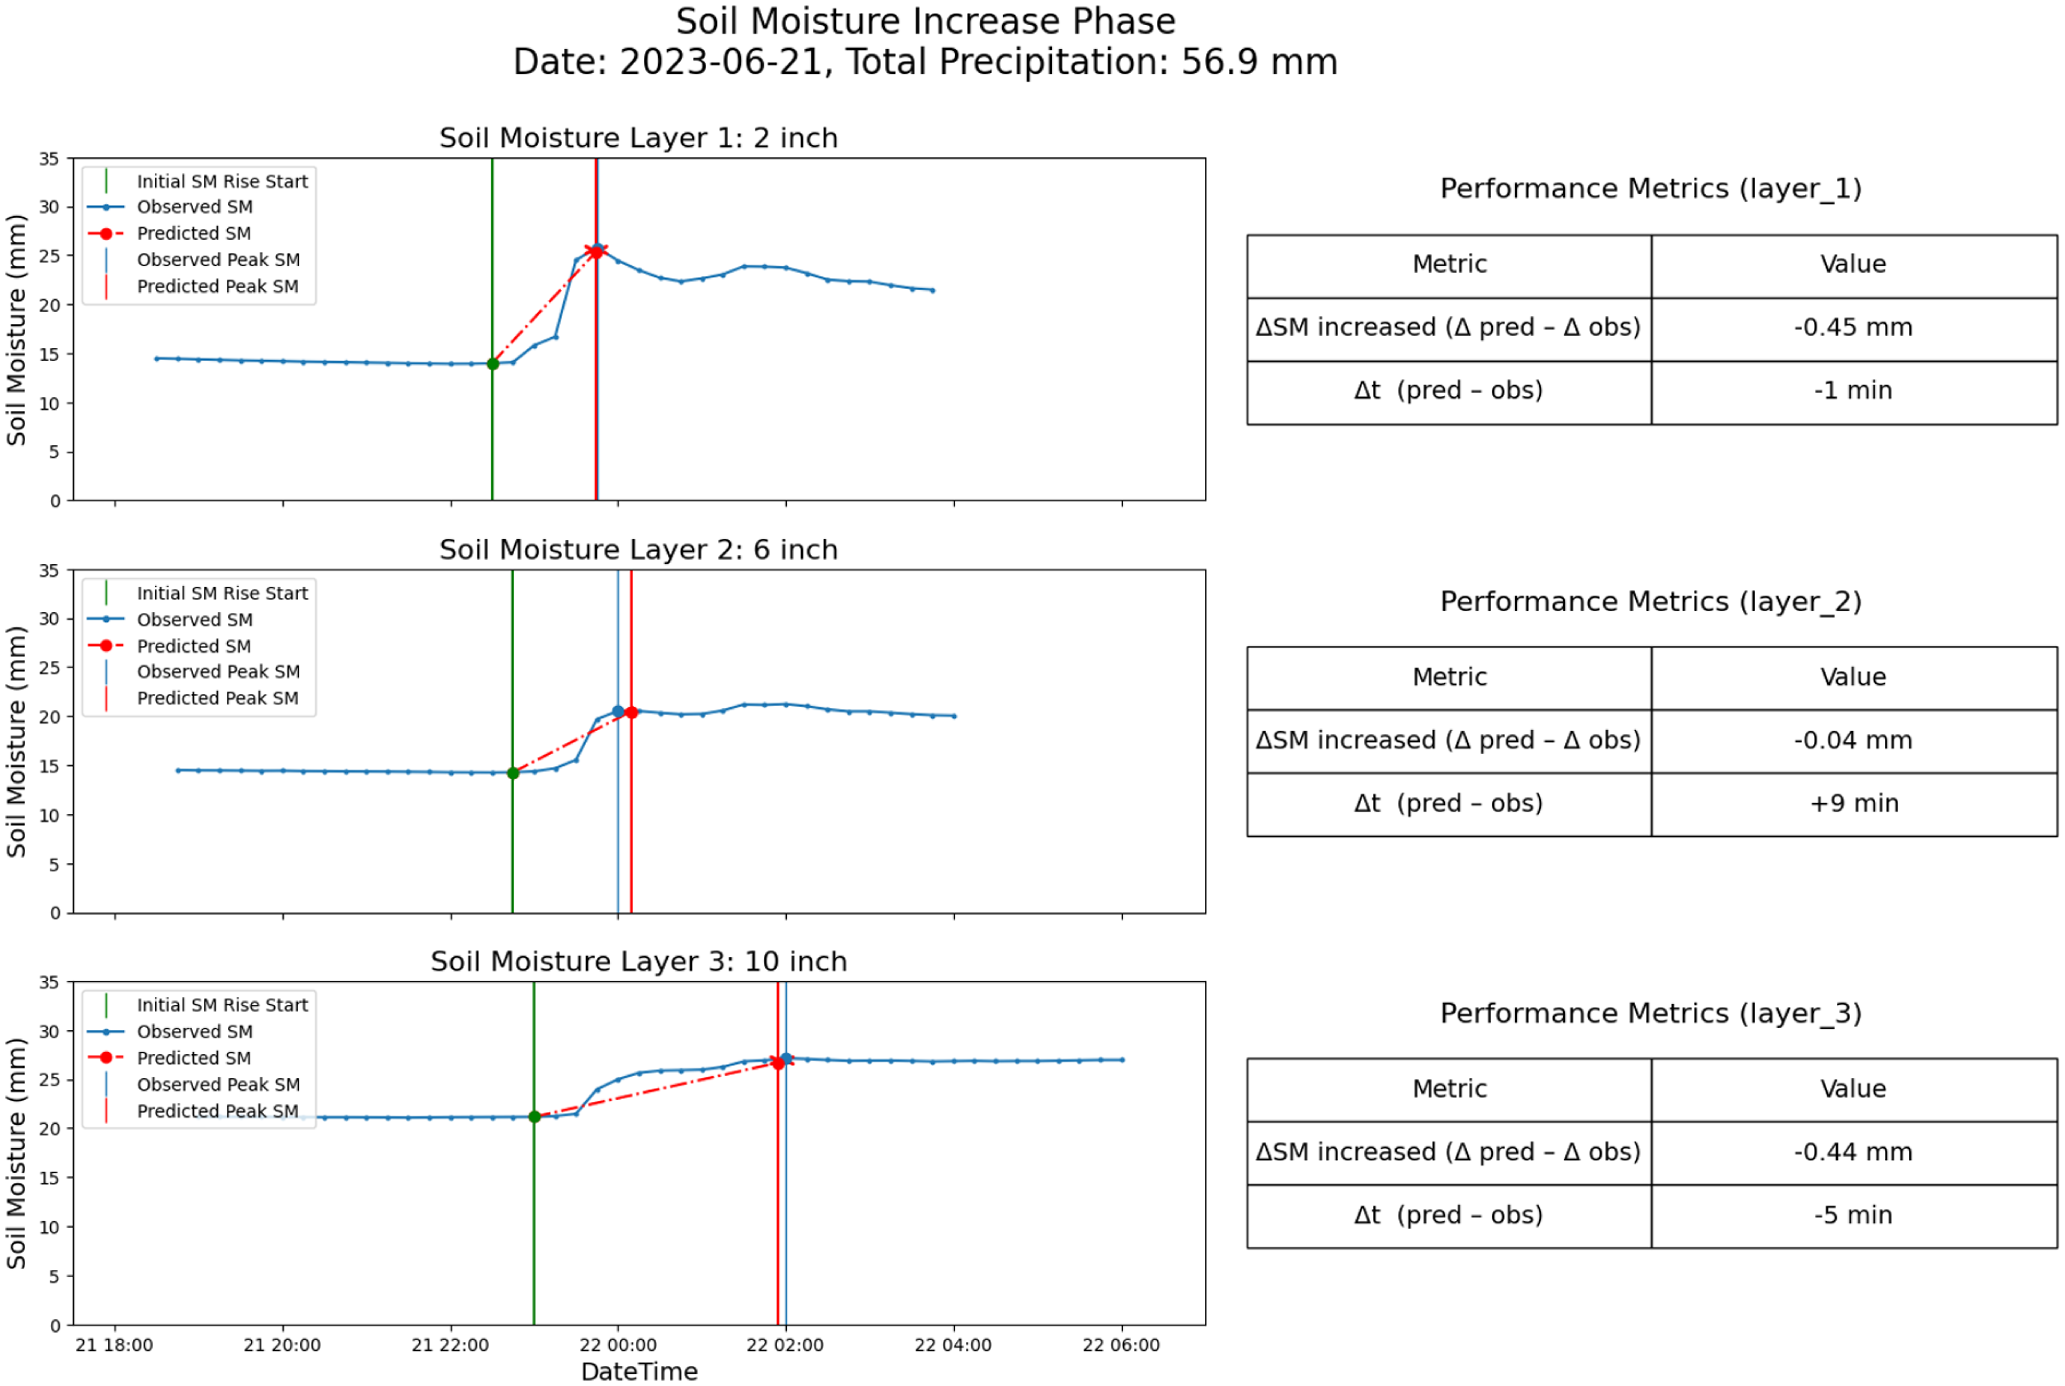
Soil moisture response and prediction performance for a heavy rainfall, 56.9 mm, 37.9 mm/h.
Interlayer Soil Moisture Response (Medium Precipitation Event)
Figure 6 presents the results of a medium precipitation event on June 21, 2023, that randomly selected from FAWN, with a total rainfall of 11.9 mm and an intensity of 7.2 mm/h, showing noticeable increases in the surface (moisture_1) and subsoil (moisture_2) layers. From a qualitative perspective, the modeled results correctly captured the increasing trends in all layers, indicating an appropriate response. Quantitatively, in the surface layer (moisture_1), the predicted soil moisture increases differed from the observed value by +0.02 mm, with the peak occurring 1 min earlier. The differences in the subsoil layer (moisture_2) were 0.08 mm lower in soil moisture increase and a 21-min delay in reaching peak moisture. While the deep subsoil layer (moisture_3) also shows slightly increased soil moisture, it is not as noticeable as the other two layers. Despite the relatively medium magnitude of precipitation, the model closely reproduced both the timing and magnitude of the noticeable soil moisture response in the first two layers.
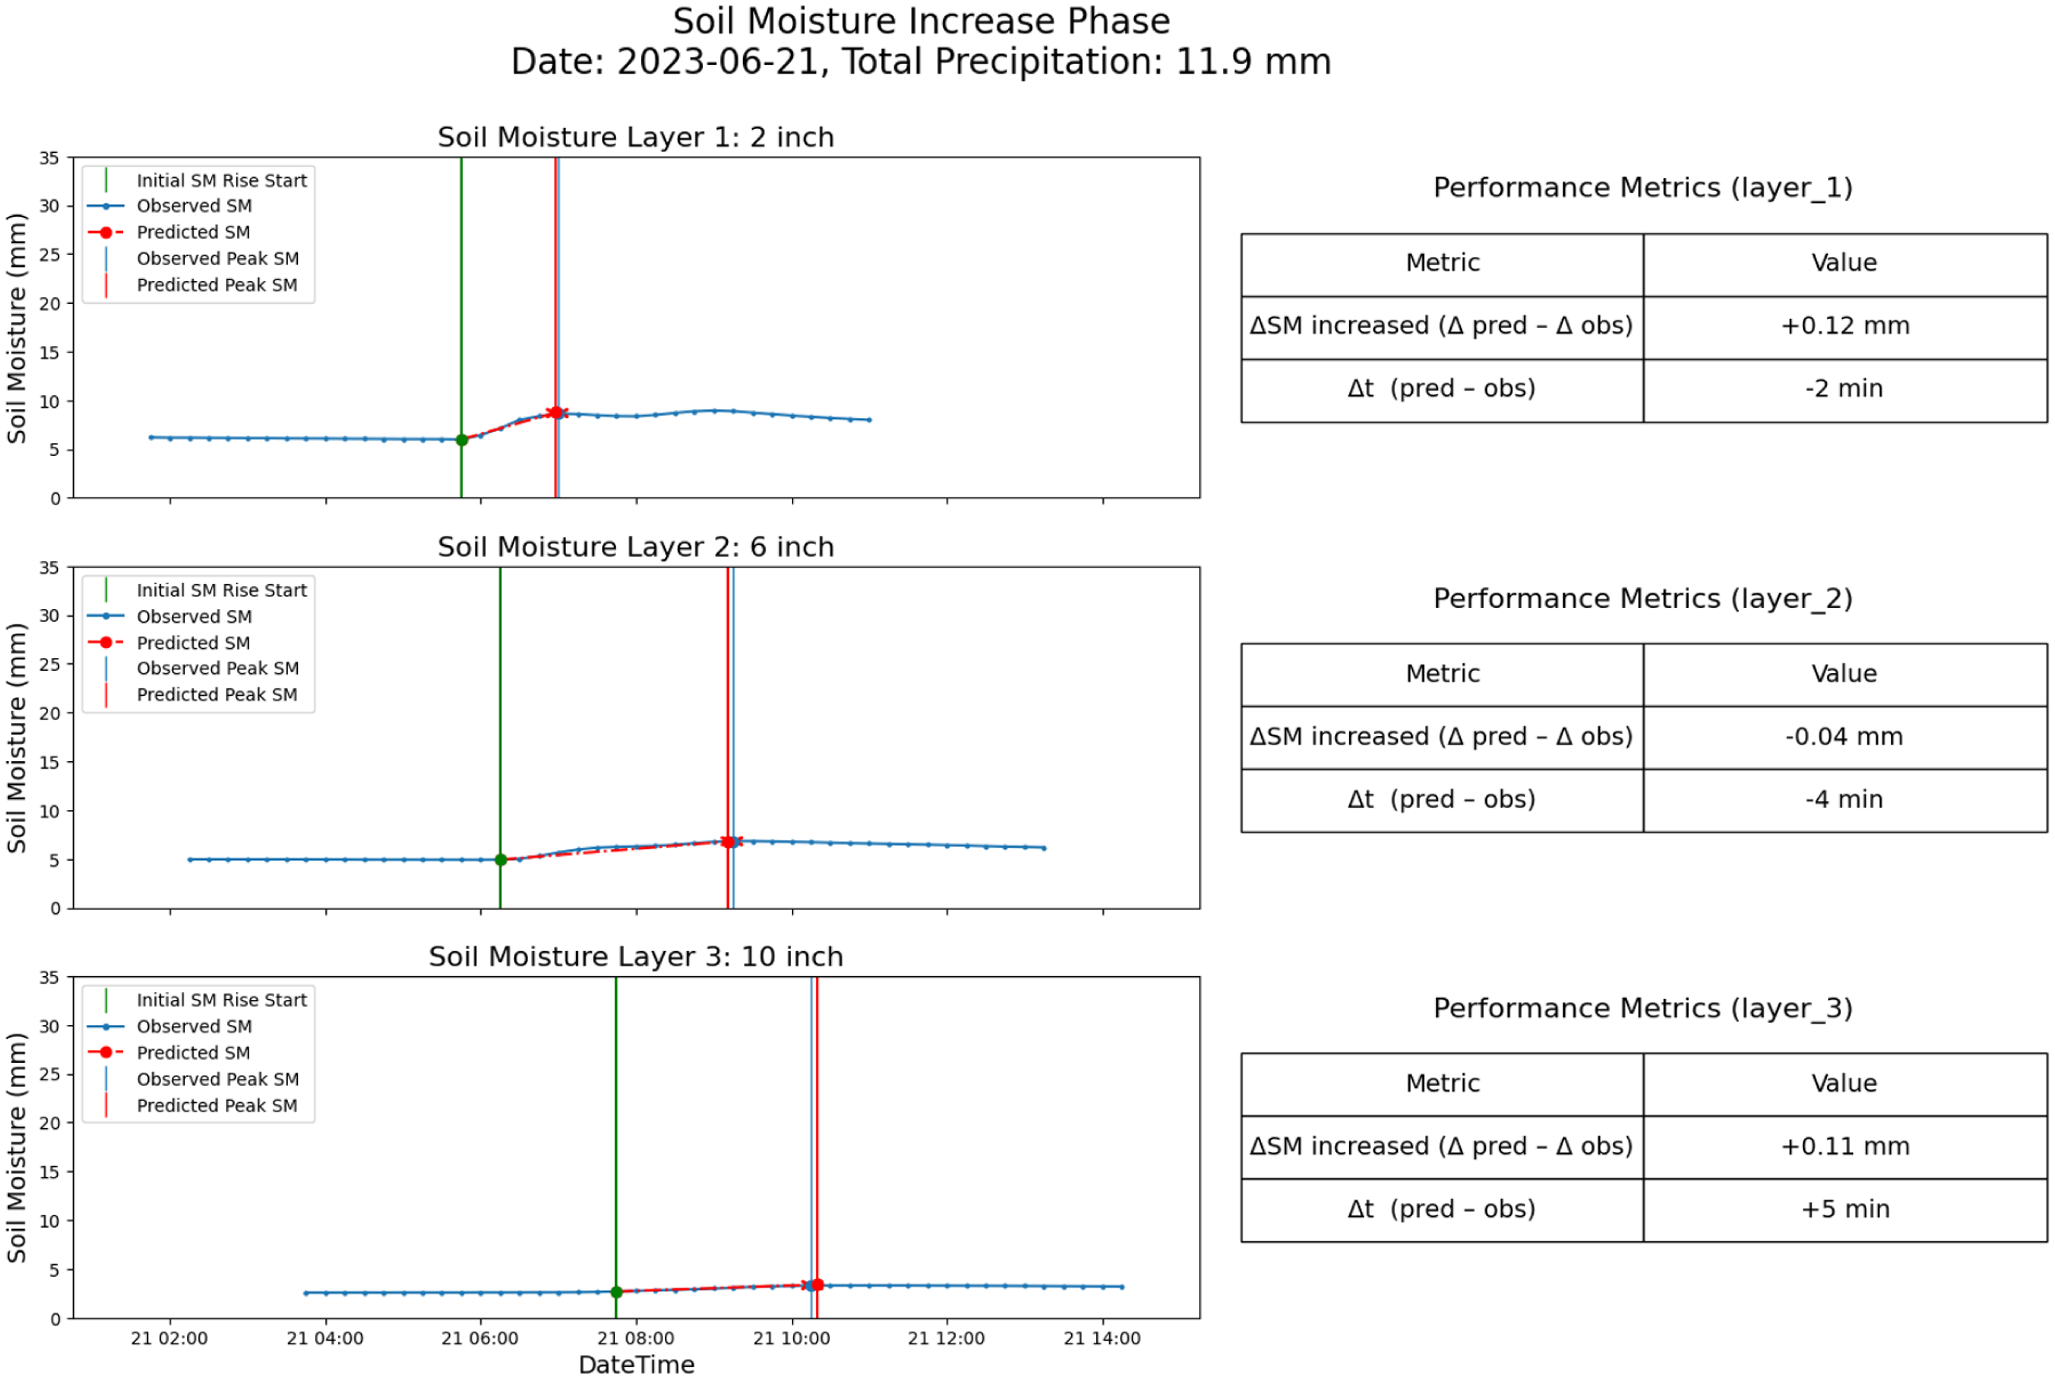
Soil moisture response and prediction performance for medium rainfall, 11.9 mm, intensity 7.2 mm/h.
Interlayer Soil Moisture Response (Light Precipitation Event)
Figure 7 shows the soil moisture response across three layers during a light precipitation event on April 29, 2023, that randomly selected from FAWN, with a total rainfall of 5.7 mm and an intensity of 5.2 mm/h, resulting in a clear increase in the surface layer (moisture_1). Qualitatively, the model ensemble showed a soil moisture increase in the surface layer and negligible changes in the deeper layers. From a quantitative perspective, the differences in soil moisture increase and change duration are 0.06 mm and 2 min in the surface layer (moisture_1). These values are 0.25 mm and 6 min in the subsoil layer (moisture_2), 0.00 mm and 18 min in the bottom layer (moisture_3). Across Figures 5 to 7, the model predictions align well with observations under heavy, medium, and light precipitation events. This consistency reflects expected hydrological behavior, where light rainfall predominantly affects the upper soil layers.
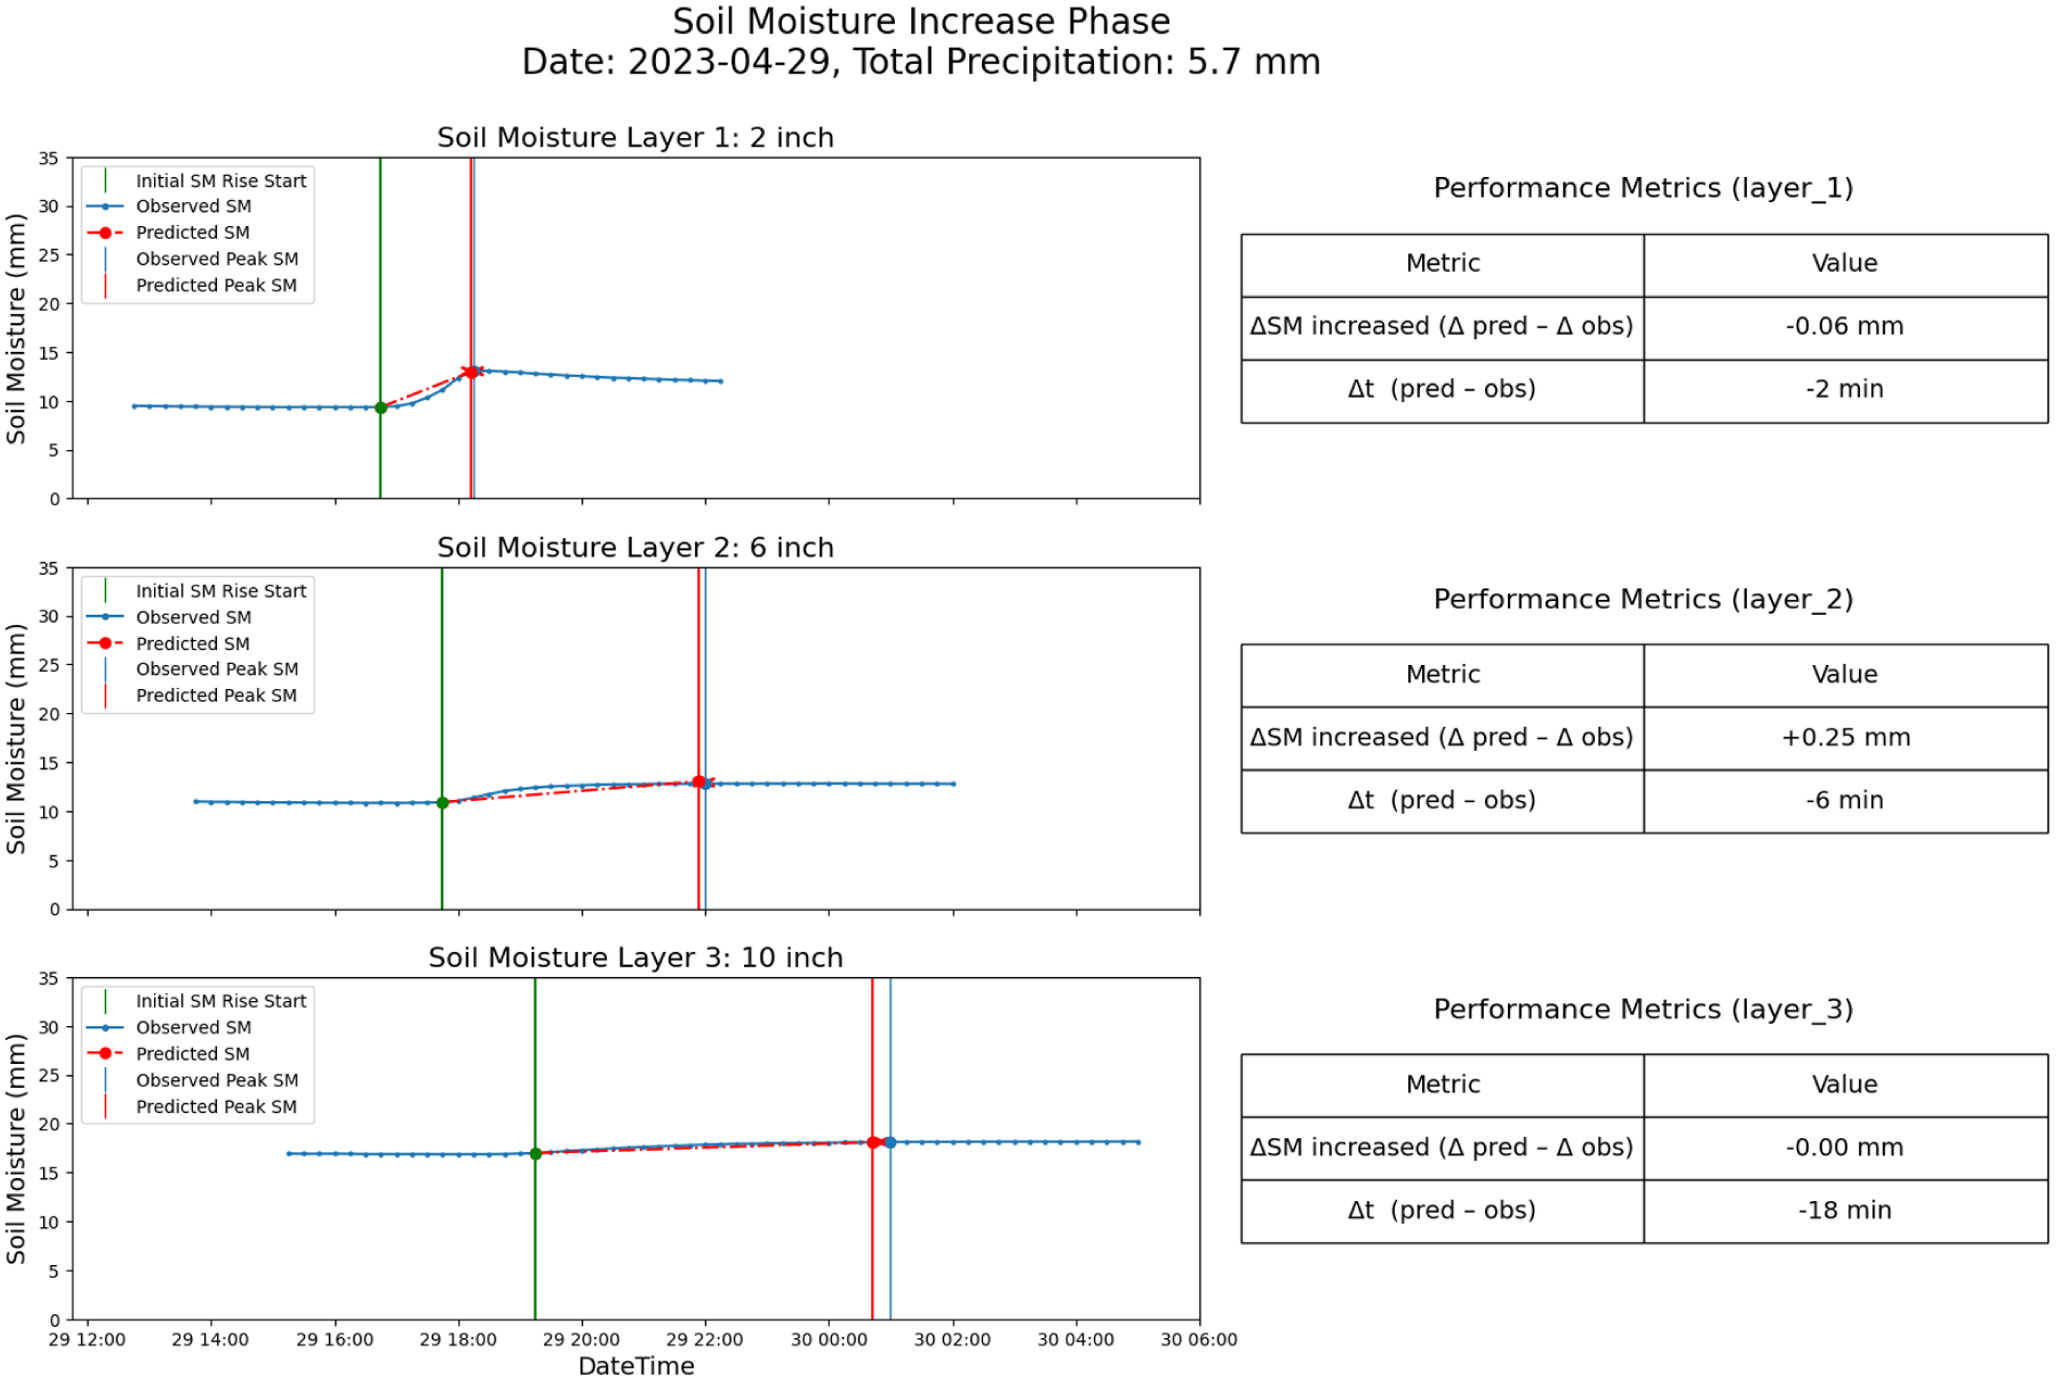
Soil moisture response and prediction performance for light rainfall, 5.7 mm, intensity 5.2 mm/hr.
XGBoost Model Performance (All Events)
Table 3 presents the performance of the XGBoost model ensemble from both event-based and layer-based perspectives. Soil moisture in a layer will be considered as active if its change exceeds the threshold ∆SM ⩾ 0.5 mm. This threshold is used only for binary pattern identification (active/inactive) and avoids counting small sensor fluctuations as true layer responses.
Comparison of observed and model predicted soil moisture increase responses for heavy, medium, and light precipitation events across three soil layers.
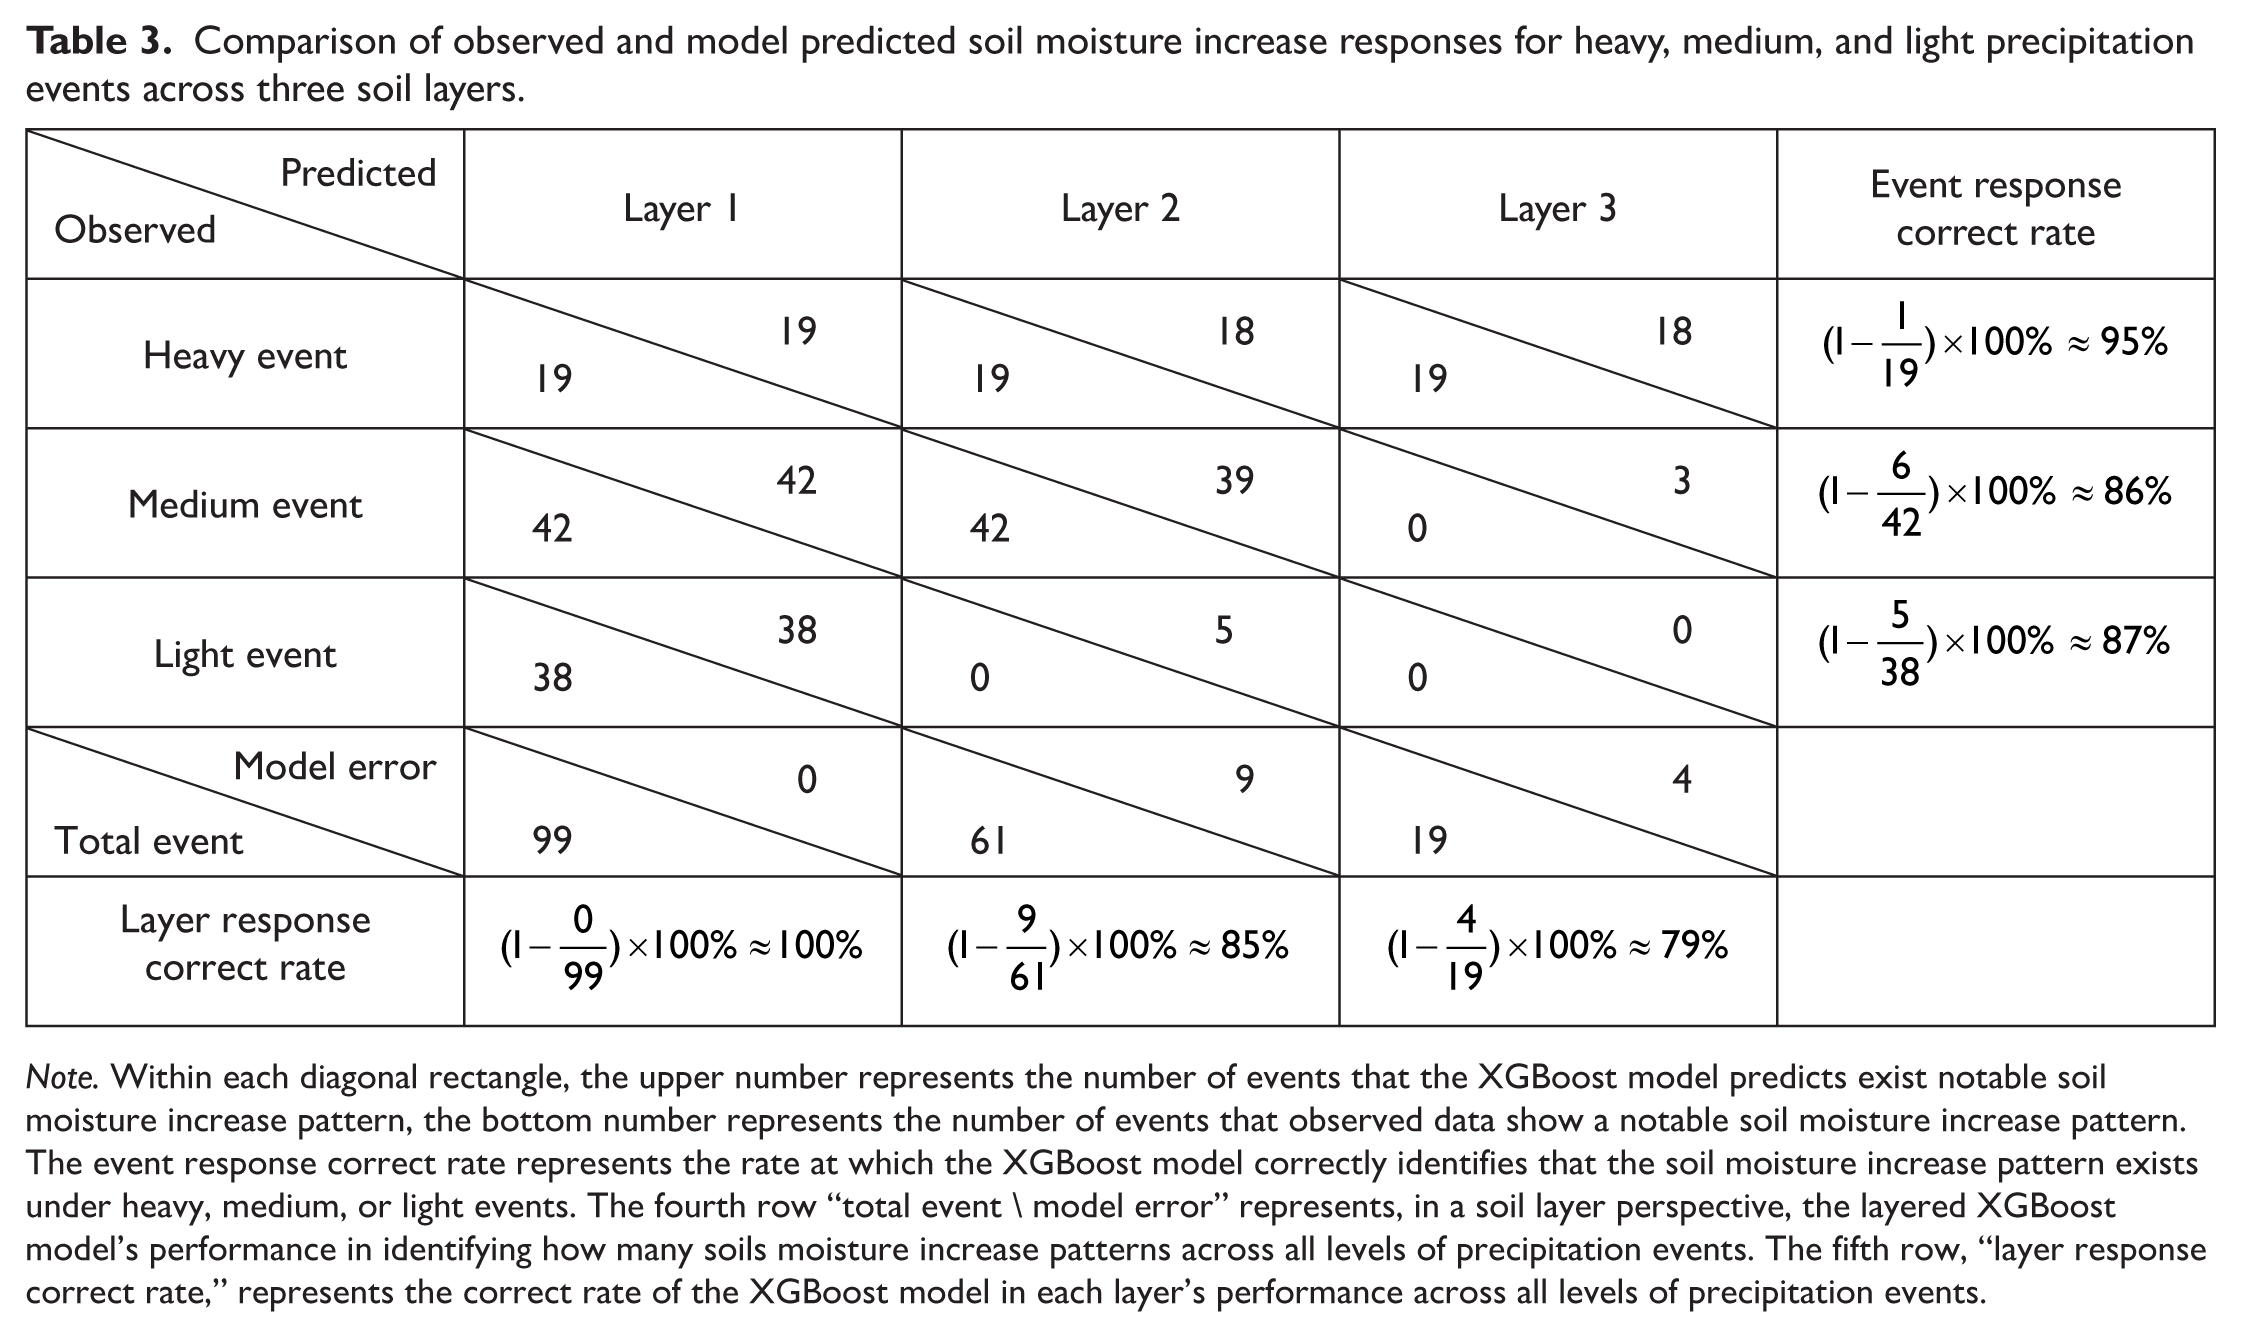
Note. Within each diagonal rectangle, the upper number represents the number of events that the XGBoost model predicts exist notable soil moisture increase pattern, the bottom number represents the number of events that observed data show a notable soil moisture increase pattern. The event response correct rate represents the rate at which the XGBoost model correctly identifies that the soil moisture increase pattern exists under heavy, medium, or light events. The fourth row “total event \ model error” represents, in a soil layer perspective, the layered XGBoost model’s performance in identifying how many soils moisture increase patterns across all levels of precipitation events. The fifth row, “layer response correct rate,” represents the correct rate of the XGBoost model in each layer’s performance across all levels of precipitation events.
Based on events (horizontally), interlayer responses in 18 out of 19 heavy precipitation events are accurately modeled, yielding a 95% accuracy rate. In medium precipitation events, 6 out of 42 events were misclassified, resulting in an 86% accuracy. In light precipitation events, the accuracy drops slightly to 87%, with 5 out of 38 events showing unintended moisture increases in layer 2.
Based on soil layers (vertically), the layer 1 model achieved perfect performance, correctly predicting all observed moisture increases (100%). In layer 2, the model identified 52 out of 61 events with increases, corresponding to an 85% accuracy. The layer 3 model had the lowest performance, detecting 15 out of 19 increases, or 79% accuracy. These results indicate a decreasing trend in model accuracy with increasing soil depth, particularly under lower-intensity precipitation.
We interpret Table 3’s results with widely cited thematic classification accuracy guidance: an overall identification accuracy larger than 85% is commonly target as satisfactory/high accuracy, while ~80% is often considered acceptable (Anderson, 1976; Foody, 2008; Olson, 2008). Accordingly, the accuracy of the model performance in identifying increase is high for all summarized conditions except layer 3, which is impacted by the undetected medium events. This is also seen in layer 2 for light events as the increase of soil moisture in such layers are the farthest reach of the corresponding water inputs (layer 2 for light events, layer 3 for medium events) and show a different pattern to the increases under other stronger water input conditions.
Figure 8 illustrates the model’s overall performance through histograms of three error metrics: duration error (Δ duration), soil moisture increase error (Δ SM), and their product (Δ duration × Δ SM). All three error types are clustering around zero, indicating minimal systematic bias. While the mean error (μ) remain small for all models, the standard deviations (σ) are relatively large, suggesting that performance is generally consistent but with some outliers under extreme conditions.
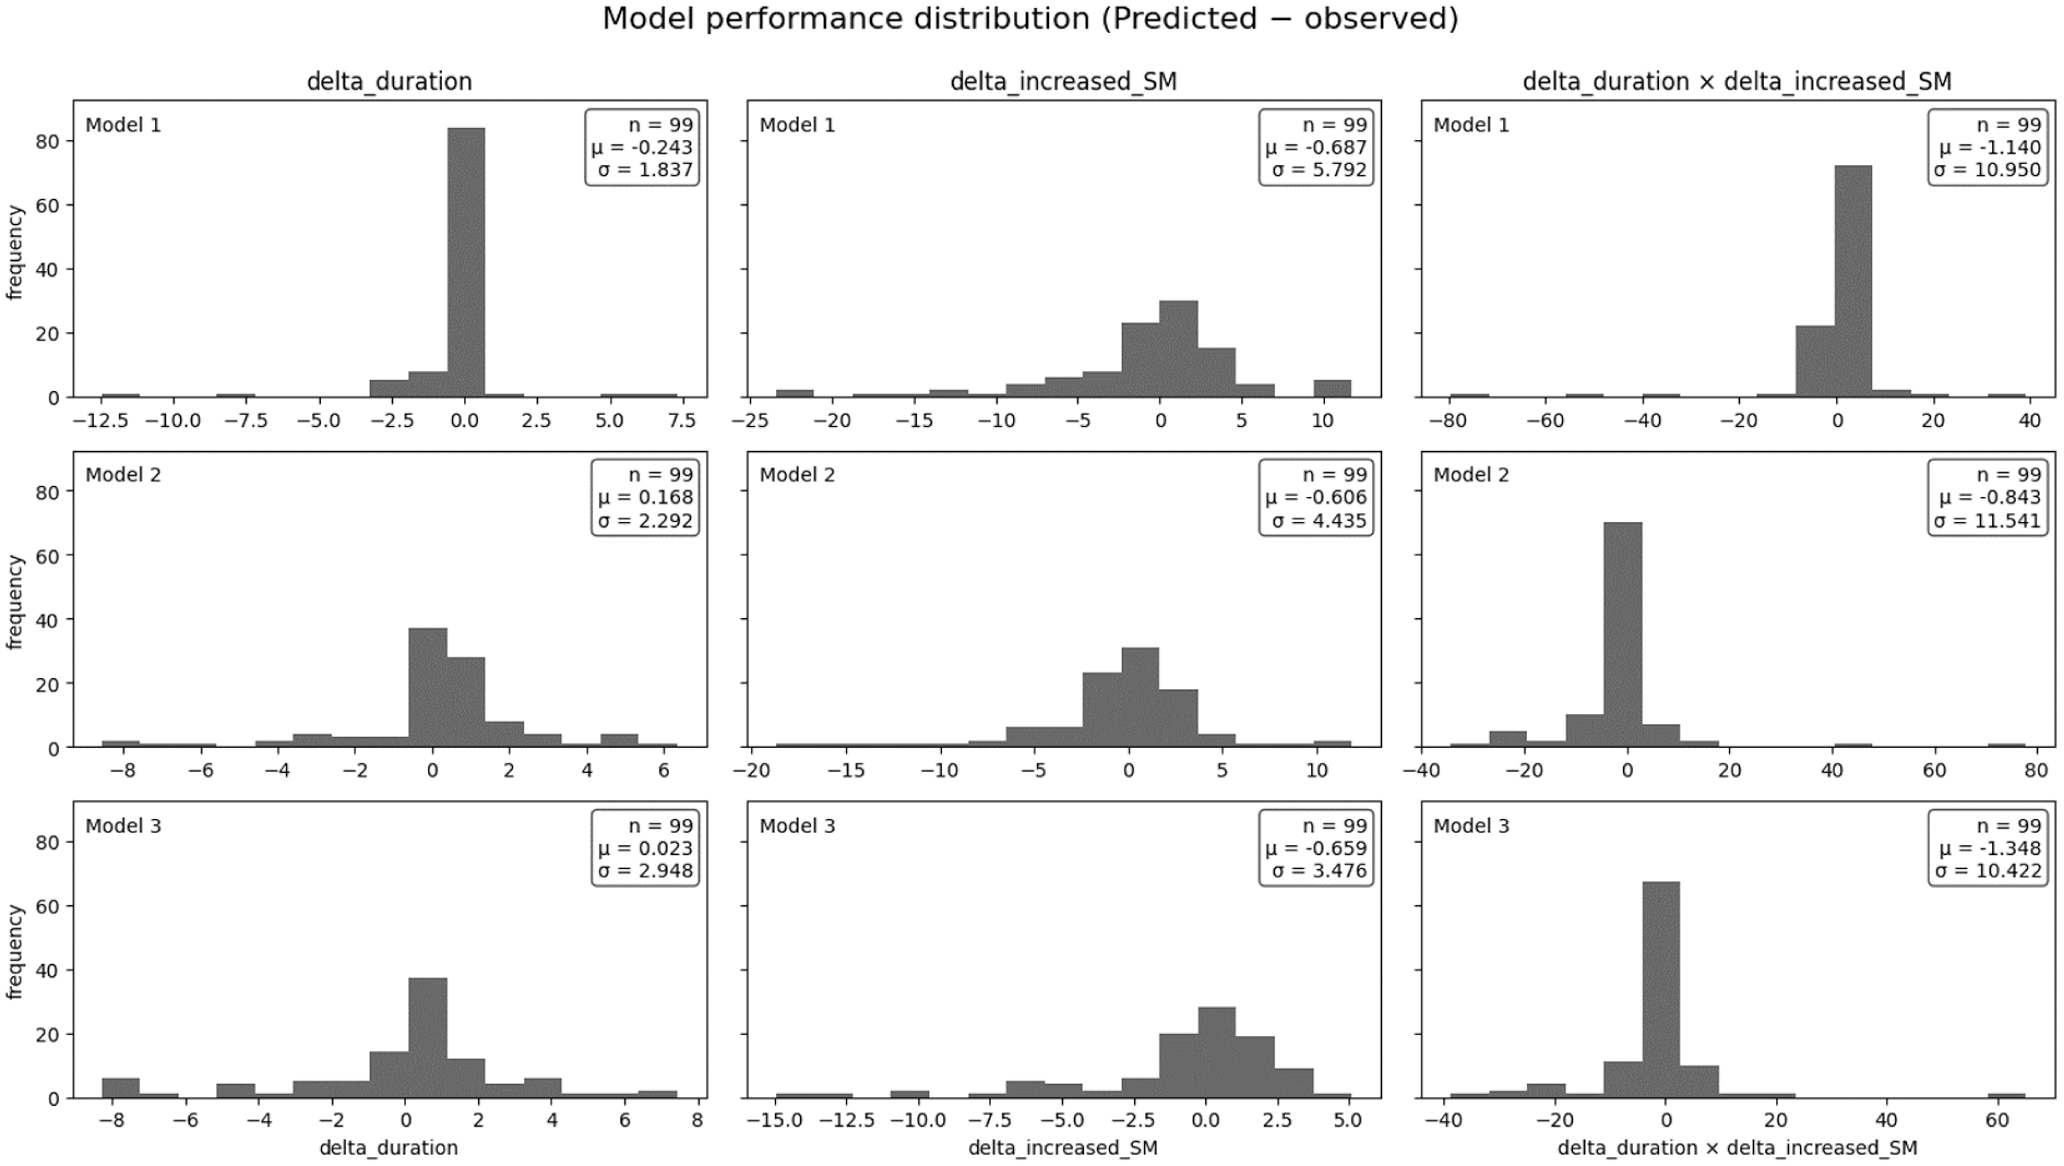
Distribution of XGBoost model ensemble’s prediction errors across 99 test events for the three soil layers.
The layer 1 model has the smallest standard deviation in duration error (
Discussion
Model Performance
For individual events illustrated in results, the XGBoost ensemble effectively captures soil moisture increase dynamics with alignment to known physical patterns. Heavy precipitation events tend to drive water deeper into the soil profile, while light events affect only the surface layer. This response is consistent with hydrological principles: “light rainfall can effectively replenish moisture in shallow soil layers, whereas heavy rainfall can accelerate the soil moisture response” (Ji et al., 2025).
These physical processes explain stratified prediction behaviors. Under heavy rainfall, the steep infiltration gradient and intensive input generate a clear wetting front that moves sequentially through the soil profile (Dai et al., 2022). This makes infiltration and percolation processes more predictable, improving model tractability (Sinha, 2016). As illustrated in Figure 5, these yields pronounce responses that are easier to model. The sharp change mitigates in medium and light events, showing weaker and shallower responses in the deep layer (Figure 6) and the sub-surface layer (Figure 7). Thus, the model performs best under heavy events, and its learning capacity is increasingly challenged as the event intensity decreases.
This vertical pattern is also evident in the model’s layer-wise accuracy. As shown in Table 3, prediction accuracy declines with depth. The surface layer (2 in) shows nearly perfect performance due to immediate hydrologic response to rainfall. The sub-surface layer (6 in) shows lower accuracy (~85%) due to delayed percolation, introducing temporal complexity. This impact was amplified in the deep layer (10 in), exhibiting the lowest accuracy (~79%) and weaker moisture signals. These trends align with soil physics: deeper layers are denser and less permeable, slowing infiltration and enhancing retention. This can also be demonstrated by the increased variance of event durations from surface layers to the deep layer (Figure 8). However, the soil dynamics are also getting more stable in deep layers, which benefits the modeling of the soil moisture increase, with variances decreased from the surface layer to the deep layer (Figure 8). Indicated by the joint error, combining these two dimensions, the modeling performance of the model is relatively similar across all layers. These patterns reflect known physical responses in sandy soils of the region (Y. Zhang et al., 2024).
Quantitative metrics in Figure 8 further confirm this depth-dependent behavior. RMSE results in Figures 5 to 7 show that the surface model (Model 1) achieves the lowest timing error (1.85 min) but has the highest moisture amount error (5.83 mm), likely due to high surface variability. In contrast, the deep layer model (Model 3) shows greater timing error (2.95 min) but lower moisture error (3.54 mm), suggesting slower but more stable infiltration. These contrasting gradients are consistent with the model’s design and physical layering.
Decentralized Model
Decentralized modeling is an important feature of this study. Previous data-driven methods usually develop a universal model through a machine learning algorithm, followed by fine-tuning hyperparameters that apply in various locations, assuming soil conditions can be represented by the training data and inferred from the developed model. While such applications have the benefit of wide implementation using a single model, they may have the risk of over-fitting to certain locations and conditions due to the various representativeness of every location in the training data. Oftentimes, a location contributes more quantity, and better quality of data can be modeled better over other places and may override local performances, impairing the inference accuracy. On the other hand, underperformance may exist if a high volume of low-quality data in a place pollutes the training data. Additionally, once new data is obtained, retraining and recalibration must be conducted to replace the entire model, causing uncertainties in maintaining the consistent performance in places where data was not updated. In this study, we propose decentralized models that individually develop a model for every single location and every soil layer using their specific data, so that the risk of overfitting can be minimized. This may also simplify the updates of the model since only the locations having new data need to be retrained and recalibrated, not affecting the entire system and reducing the risks of inconsistent system performance.
Limits and Solutions
The limitations for this study span from the conditions for assumption-making, application cases, and the decentralized model design. The algorithm made several assumptions in designing the calculation model, such as no horizontal water movement, only modeling initial and end points of an increase event, isolated calculation for each soil layer, increase event division, etc. These are based on the sandy soil type in the specific location where the study is focused. With a high infiltration capacity in sandy soil, the soil moisture increase process is usually fast and short, which makes the impacts from the environment of a limited magnitude that can be ignored and narrows the concentration of the calculation on soil moisture increase and percolation. As soil sensors are placed at certain depths, continuous simulation of soil moisture over the depth is not easy to realize, so that every single soil layer needs to be modeled individually with the percolation parameters specifying interlayer connections. Event-based modeling design divides time series soil moisture records into increasing and decreasing sequences since their different hydrological processes (e.g. percolation) may require different calculation methods. Separate modeling upon the direction of soil moisture change allows simple and accurate representations of underlying hydrological processes. Such simplification also resulted in soil moisture fluctuations within an increase event not being important, as the irrigation decision-making will not respond at that detailed level. However, if soil types change or the infiltration capacity of the soil decreases so that the consideration of vertical movement of water cannot well embody the actual soil moisture response, all these assumptions could be void. In addition, ET is neglected during the relatively short soil moisture wetting phase, this assumption is reasonable for Florida weather pattern, but when adopted this model into another states with different weather patterns, this assumption will be void.
Additionally, this model is designed for irrigation decision-making. Many simplifications applied in modeling rely on the specific needs of irrigation, such as modeling linear change of soil moisture, ignoring the soil moisture fluctuations in fine temporal scales, validating only the alignments of event duration and soil moisture change amount, and data from one weather station representing a relatively large surrounding area. This makes the model not suitable for detailed requirements of soil moisture, such as urban stormwater management.
The decentralized model mechanism also has its limitations. Having a single model for every location and every soil layer, the management of these models could be complex when there are many locations included with a higher spatial resolution applied. An additional layer of identifying the proper model to be used is needed to facilitate various users’ requests. While a model may represent the surrounding areas in similar soil and environment conditions, isolated locations with no previous data may not be well modeled since such a mechanism was not designed for high capability of inference capability. Yet, once applied over time and more locations are included in the system, the enhanced coverage of models may offset the limited inference capacity.
Impact on Future Development
For future development impact, this decentralized modeling approach enables future modeling approaches to use federated learning or edge computing to train local soil moisture models at their localized field with in-situ sensors and then update shared model parameters with a central server (Wen et al., 2023). This preserves privacy and allows the global model to benefit from diverse, location-specific data. For irrigation, this means each farm could adapt the predictive model to its soils and microclimate, while still learning from regional data resources (Ahmadi & Mahashabde, 2024). This decentralization design allows the future model to be more scalable and responsive to heterogeneity across different soil types in different landscapes.
In addition, this approach merges the physical rules into data-driven modeling. While “blackbox” data-driven models are easy to develop and can provide good performance, future agriculture may require higher explainability of data-driven models for trust and responsibility. By embedding known hydrologic principles, such as mass conservation and vertical water redistribution, into the XGBoost model ensemble through layered water balance equations, this study is not only learning from data correlations but is instead guided by tailored hydrological modeling to inject physically meaningful pathways. This constraint-driven learning path narrows the model solution space and enables it to find relationships that are consistent with soil physics rather than purely algorithmically finding patterns from data. As a result, the model not only becomes more interpretable but also provides relatively consistent performance across various soil and weather conditions, even when data is limited.
Combining these two features, future development of this system will focus on enhancing the coverage of the system by obtaining data of heterogeneous conditions of soil, weather, ecosystem, cropping operations, etc. Integrated with the component study of soil drying pattern profiling (Zhang & Yu, in progress), a service can be provided to customers to build their localized models to better inform their irrigation practices.
Conclusion
This study addressed the challenges in modeling RZSM, particularly the soil moisture increase phase as water is input into the soil. By developing an interpretable, event-based modeling framework that integrates layered water balance equations with an ensemble of XGBoost models, this study provides a robust and physically consistent approach that bridges the gap between purely data-driven and physically based mechanistic models. The proposed model simulates water redistribution across multiple soil layers, capturing nonlinear soil dynamics during different water input intensities (heavy, medium, and light).
Results demonstrate the XGBoost model ensemble’s ability to simulate the soil interlayer connection, particularly under heavy and medium event conditions. However, accuracy slightly decreased for light events, especially in deep soil layers, reflecting the inherent complexities of modeling deep-layer soil moisture dynamics. The model ensemble has a gradient decrease in performance as soil depth increases, which is consistent with known hydrological principles that moisture infiltration signals become increasingly variable and challenging to predict deeper soil layers. The error distribution further analysis of this depth-dependent performance indicates better performance at soil moisture increase duration predictions at the surface, but more stable moisture increased amount predictions at the deep soil layer, which matches physical soil moisture behaviors as validated by recent literature.
This paper provides a practical, interpretable, and physically informed solution to model the RZSM increase phase. The results underscore the effectiveness of using an XGBoost model ensemble within a layered water balance framework, using hydrological rules to guide the data-driven model learning path. This approach is suitable for agriculture applications, particularly in irrigation scheduling, for future integration of event-based machine learning models in soil moisture prediction across different agricultural contexts.
Footnotes
Appendix
Acknowledgements
The authors acknowledge the Florida Automated Weather Network for supporting data collection and thank the participating farmers for granting access to their land for experimental activities.
Ethical Considerations
This article does not contain any studies with human or animal participants.
Consent to Participate
There are no human participants in this article and informed consent is not required.
Author Contributions
All authors significantly contributed to the study’s design, data collection, or analysis; drafted or critically revised the article; and approved the final version. All authors agree to be responsible for all aspects of the work to address any issues regarding its accuracy or integrity. All contributors who do not meet the criteria for authorship has been included in the Acknowledgments section.
Funding
The authors disclosed receipt of the following financial support for the research, authorship, and/or publication of this article: This work was supported by USDA CIG under Grant No. NR213A750013G018.
Declaration of Conflicting Interests
The authors declared no potential conflicts of interest with respect to the research, authorship, and/or publication of this article.
Data Availability Statement
The data that support the findings of this study are available from the corresponding author upon reasonable request.