
Abstract
Sorghum has an enormous role in the economy of sorghum-growing nations. Supplying a precise amount of water to a crop based on crop needs is the main agenda in implementing water-saving agriculture. Non-weighing type lysimeters were used to determine actual crop evapotranspiration and crop coefficient of sorghum at the experimental farm of Melkassa Agricultural Research Center situated in the semi-arid area of Ethiopia. Soil-water balance approaches were applied to obtain actual crop evapotranspiration, while the Penman-Monteith technique was used to determine reference evapotranspiration. Growth stages-wise crop coefficient was computed as a ratio of actual crop evapotranspiration to reference evapotranspiration. The total seasonal sorghum actual crop evapotranspiration during the 2017 and 2018 experimental years was 358.6 and 377.54 mm, respectively. The 2 years average sorghum actual crop evapotranspiration was 368.07 mm. The mean locally developed actual crop coefficient values of 0.55, 1.15, and 0.59 were observed for the initial, mid, and end-season, respectively. The FAO-adjusted crop coefficient values for mid and end-season were 1.01 and 0.52, respectively. The developed Kc values considerably differed from the FAO-adjusted Kc values. So, the determination of actual crop evapotranspiration and crop coefficient for crop growth at local climate conditions is vital for decision-making concerning water management in the area where irrigation is practiced.
Keywords
Introduction
Sorghum is an important cereal crop grown worldwide. Over half of the world’s sorghum is growing in semi-arid regions (A. Srinivas et al., 2014). It is the main source of food for above 750 million people who live in the semi-arid area of Africa, Asia, and Latin America (Food Security Department, 2004). In Africa, sorghum is the second most important cereal crop (Omoro, 2013), which supports 300 million people who live in sub-Saharan Africa (Mekbib, 2007). In Ethiopia, it ranks third after Teff and Maize in terms of production (Solomon et al., 2021) which accounts for 14.96% of the total area allocated to grains (Central Statistical Agency, 2018). However, the increasing need for the crop is challenged by the lack of knowledge of crop water requirements. Thus, information such as actual crop evapotranspiration (ETa) and crop coefficient (Kc) is important to better satisfy the water need of the crop. Therefore, a detailed investigation of ETa under various climate conditions, irrigation methods, and agronomic practice is very important to precisely manage irrigation water, particularly where water is a scarce resource.
ETa is a key parameter in irrigated agricultural and hydrological studies. Determination of irrigation demand depends on the actual crop evapotranspiration. ETa can be measured directly with lysimeters (weighing and non-weighing type) and the Eddy covariance method. Weighing-type lysimeters can provide crop actual evapotranspiration values for short time intervals but it has high installation and operation cost (B. Srinivas & Tiwari, 2018). Whilst a non-weighing type lysimeter can measure long-term ETa (weekly, decade, and monthly) using water balance techniques which can be used in irrigation system management and planning (Allen et al., 1998). Nevertheless, to bring the measured ETa for irrigation planning crop coefficient (Kc) is often required. Kc represents crop-specific water use which changes during the growing season with crop physiological changes.
Jensen (1968), was introduced the original Kc methodology of ETa estimation, and further improved by numerous scholars (Allen et al., 1998; Doorenbos & Pruitt, 1977). Kc is a ratio of actual crop evapotranspiration and reference evapotranspiration. Various methods are available to compute reference evapotranspiration (ETo). In 1948, Penman introduced the original ETo equation and modified it by various researchers (Allen et al, 1998; Doorenbos & Pruitt, 1977; Hargreaves & Samani, 1985; Watson & Burnett, 1995). The modified FAO-56 Penman-Monteith approach is the only standard method that gives satisfactory ETo results under various climate conditions (Allen, 2015).
Typically, the water requirement of the crops is computed according to the FAO-56 (Allen et al., 1998) by connecting ETo and Kc. The standard Kc values for different crops obtained by measuring actual crop evapotranspiration (ETa) mainly with lysimeters and then relating it with ETo are reported by Doorenbos and Pruitt (1977) and Allen et al. (1998) and updated by Pereira et al. (2021). However, those reported Kc values have been considerably different from the site-specific Kc values. Other researchers have reported on sorghum crop coefficient (Kc) values (Bashir et al., 2008; Howell et al., 2006; Lima et al., 2021; Piccinni et al., 2009; Shenkut et al., 2013; Tyagi et al., 2000). Nevertheless, depending on local weather conditions, soil texture, and duration of the crop, the sorghum Kc values obtained from the above studies significantly vary from place to place. Hence, all the above studies suggested the strong need for local calibration of Kc under local climate conditions since the climate and their interaction with crops differ in their spatial or temporal scale. Therefore, a lysimeter (non-weighing type) experiment was conducted to develop actual crop evapotranspiration and crop coefficient values for sorghum at Melkassa in a semi-arid area of Ethiopia. Water-balance approaches were employed for this purpose.
Materials and methods
Study area
The study was carried out at Melkassa Agricultural Research Center (MARC), a semi-arid part of Ethiopia. Geographically, the site is situated at 8°24’N latitude and 39°21’E longitude with an elevation of 1550 m a.m.s.l (Figure 1). The climate of the area is characterized as semi-arid with erratic and uneven distribution of rainfall patterns. The mean minimum and maximum temperature over the period 1977 to 2018 ranged from 13.8°C to 28.7°C. The average annual rainfall of the area over the same periods (1977–2018) was 825 mm, concentrated in July, August, and September. The annual mean relative humidity and solar radiation ranges from 46.17% to 75.33%, and 19.14 to 22.02 MJ m2 day−1, respectively during the period 1977 to 2018. The long-term (1977–2018) mean annual reference evapotranspiration (ETo), and wind speed of the area were 3.8 to 5.42 and 0.3 to 2.71 m s−1, respectively. The weather parameters for each month during the 2017 and 2018 sorghum growing periods are given in Table 1. The soil texture class of the study site is clay loam. The Filed Capacity (FC) and Permanent Welting Point (PWP) of the soil are 0.346 and 0.176 m3 m−3, respectively with a bulk density of 1.13 g cm−3.

Map of study site.
Selected Weather Parameters During the 2017 and 2018 Sorghum Growing Periods.

The experimental setup
To increase the accuracy of the data collected from the experimental site two non-weighing type lysimeters having different internal planting areas of 2 m2 (2 m × 1 m) and 4 m2 (2 m × 2 m) with the same total depth of 2.6 m located near the metrological station of the research center were used to identify actual crop evapotranspiration and crop coefficient for sorghum. Each lysimeter has contained access chambers and connected underground steel pipes to drain excess water to the collector chamber. To prevent the entry of surface runoff inside the lysimeter during rainy days, the rim of the lysimeters protruded 10 cm above the soil surface. To monitor the soil moisture level inside the lysimeters access tubes were installed at the center of each lysimeter up to an effective root depth of 100 cm. Then, both lysimeter’s results were used to compute the sorghum crop coefficient (Kc).
Crop management
Sorghum variety of Teshale was sown in mid-July inside and outside of the lysimeter to keep a similar environment. Before sowing, the two lysimeters were made to have similar moisture content. The row and plant spacings were 75 and 15 cm respectively. Planting and all other field management such as fertilizer, weeds, and pest control were uniformly applied inside and outside of the two lysimeters area. Fertilized rates of 100 kg ha−1 for diammonium phosphate (DAP) and 50 kg ha−1 for urea were applied to the plot but urea was applied in a split. Seedling density was controlled by 20 plants per m2. The crop was harvested in end-October during the two consecutive experimental seasons (2017 and 2018).
Soil moisture monitoring and irrigation application
Soil moisture contents were monitored from inside the lysimeter at an interval of 15 to 100 cm depth before and after every irrigation. A CPN503 neutron moisture meter was used to monitor soil moisture content at the lower depth (15–100 cm) in the lysimeter. Soil moisture content in the top 0 to 15 cm soil layer was monitored by the gravimetric (oven method). The Bouyoucos hydrometer method was employed to determine the soil particle size distribution. The soil bulk density of the experiment field was determined by taking undisturbed soil samples using the core method. The soil water content at Filed Capacity (FC) and Permanent Welting Point (PWP) was determined by the pressure plate apparatus technique, while the total available soil water (TASW) was obtained by subtracting PWP from FC. The irrigation water was applied when 55% of the total available soil water was depleted in the main rooting layer. A known volume of irrigation was applied using a watering can inside and outside the lysimeter by converting the 55% depletion into the volume of water. Irrigation water was terminated following the maturity sign of the crop. The applied irrigation water in each lysimeter was used to compute the actual crop evapotranspiration (ETa). The amount of applied irrigation water was computed from the following relationship (equation (1); Brouwer et al., 1985):

Where: V is the amount of water to be added (m3); A is the surface area of lysimeter (m2); and D is the depth of application (m).
Crop evapotranspiration and reference evapotranspiration
The daily actual crop evapotranspiration was computed using the soil water balance approach (equation (2); Jensen et al., 1990).

Where: ETa is actual daily crop evapotranspiration (mm), I is applied irrigation water (mm), P is effective rainfall (mm), D is drainage water (mm), is the change in soil moisture storage (mm), and Δt

Where:
The FAO Penman-Monteith method was applied to calculate daily reference evapotranspiration (ETo) using the cropwpat8.0 model. Weather data such as daily air temperature (minimum and maximum), sunshine hours, wind speed at 2 m height, and relative humidity were used as model input to calculate daily ETo.
Crop coefficient (Kc)
The actual sorghum crop coefficient values for each growth stage of the crop were computed from the following relationship (equation (4)).

Where Kc is the actual crop coefficient (dimensionless); ETa is the actual crop evapotranspiration (mm day−1); and ETo is the reference evapotranspiration (mm day−1).
Sorghum crop coefficient values developed under a standard climate condition (RHmin = 45% and u2 = 2 m s−1) are listed in FAO-56 Table 12, as 0.3, 1.10, and 0.55 for the initial, mid, and end-season. These values must be adjusted with local weather conditions, where RHmin and wind speed differ from 45% and 2 m s−1, respectively. The typical Kc values (>0.45) for the mid-season and end-season stages were adjusted with climate conditions and plant height using the following (equation (5); Allen et al., 1998):

Where,
Results and discussion
Weather characteristics
Weather parameters such as; mean air temperature, relative humidity (RH %), wind speed (u2), solar radiation, rainfall, and ETo for the 2017 and 2018 study seasons are presented in Table 1. These weather variables were similar to some extent in both growing seasons except for some diffe
Sorghum actual crop evapotranspiration
Sorghum Teshale variety could take about 92 days to mature under Melkassa climate conditions as presented in Table 2. At the study site, the division of sorghum growing stages was depending on the occurrence of plant leaves numbers. The initial stage (Kcini) is when the plant develops up to three leaves, the crop development stage (Kcdev) from three leaf numbers to heading, the mid-season stage (Kcmid) from heading to black layer formation, and the late-season stage (Kclate) from black layer formation to harvest. The seasonal sorghum crop evapotranspiration (ETa) during the 2017 and 2018 experimental years were 358.6 and 377.54 mm, respectively with an average of 368.07 mm (Table 2). The average sorghum daily actual crop evapotranspiration ranged between 2.27 to 5.41 mm day−1 in 2017 and 1.96 to 5.17 mm day−1 in 2018 (Figure 2). The maximum average daily crop evapotranspiration was observed at 64 DAS in 2017 and 68 DAS (mid-season) in 2018. The pattern of average daily ETa for each sorghum growing season observed in the study area was comparable to the trend described in FAO-56. This trend generally shows a gradual increase in ETa from the initial, reaching the peak at the midseason and started decline toward the end of the season. The variation in ETa is due to the combined effects of crop development, changes in the evaporative demand of the atmosphere, and differences in energy absorption characteristics. The increase in ETa from the initial to crop development stages can be explained by changes in evaporative demand and rapid crop growth. The decline in ETa toward the end-season stage was due to senescence and less physiological activities of the leaves because of aging (Allen et al., 1998). The sorghum seasonal ETa of this study was highly comparable to the study reported by Widiyono et al. (2021) in east Nusa Tenggara province Indonesia, with a sorghum ETa value of 371 mm.
Water Balance Components (cm) During Sorghum Growth Stages Observed at the Experimental Site in the Semi-Arid Area, Ethiopia.

Note. P = effective rainfall; I = irrigation; D = drainage; ΔS = change in soil moisture storage; ETa = actual crop evapotranspiration; No Irri = number of irrigation.
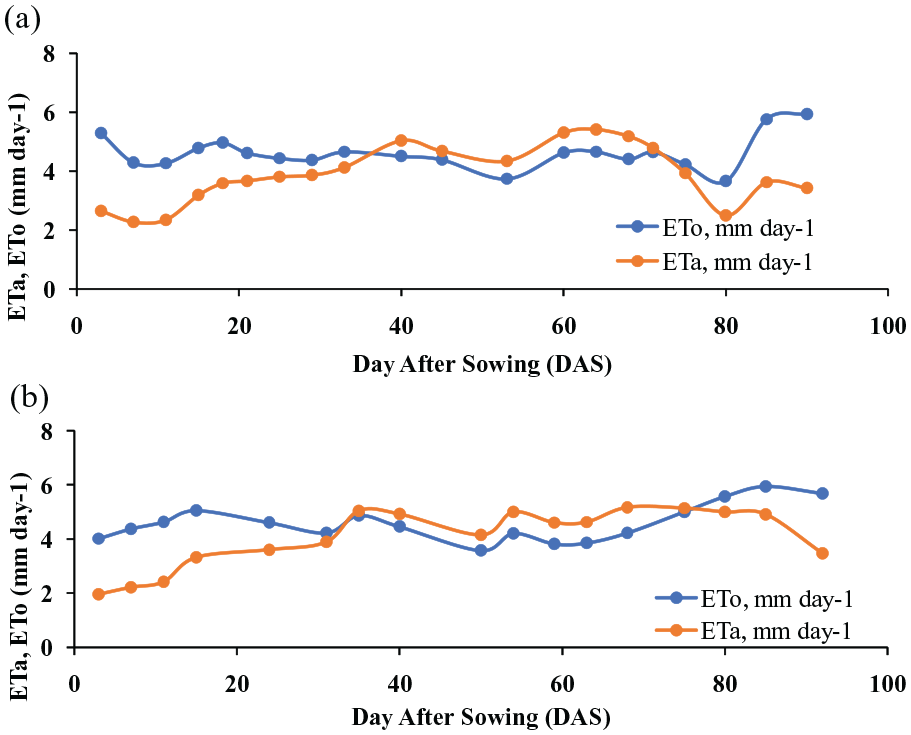
Actual crop evapotranspiration (ETa) as a function of days after sowing for sorghum during (a) 2017 and (b) 2018.
Sorghum crop coefficient (Kc)
The computed daily actual crop coefficient values expressed as a function of the day after sowing (DAS) for the sorghum growing seasons of 2017 and 2018 are presented in Figure 3. The result indicates a gradual increase in Kc values from the initial, reaching a peak at the mid-season and starting to decline toward the end of the season. This result was alike to the trend described in FAO-56. The seasonal Kc values during the initial (0.56), midseason (1.13), and end season (0.57) were recorded in 2017, while Kc values of 0.55, 1.16, and 0.61 for initial, mid, and end-season, respectively were obtained in 2018 (Table 3). The average sorghum seasonal Kc values over the two experimental years were 0.55, 1.15, and 0.59 for the initial, mid, and end-season, respectively (Table 3). The evolution of Kc values reflected the effects of crop growth, development, and physiology on ETa. As the crop develops and shades the ground to the effective full cover and reaches full size, the amount of water abstraction increases which in turn increased the ETa. The maximum Kc value of 1.13 and 1.16 was obtained during the mid-season of 2017 and 2018, respectively when ETa reached its highest demand. The Kc-mid value recorded in 2017 was lower than the Kc-mid value recorded in 2018.
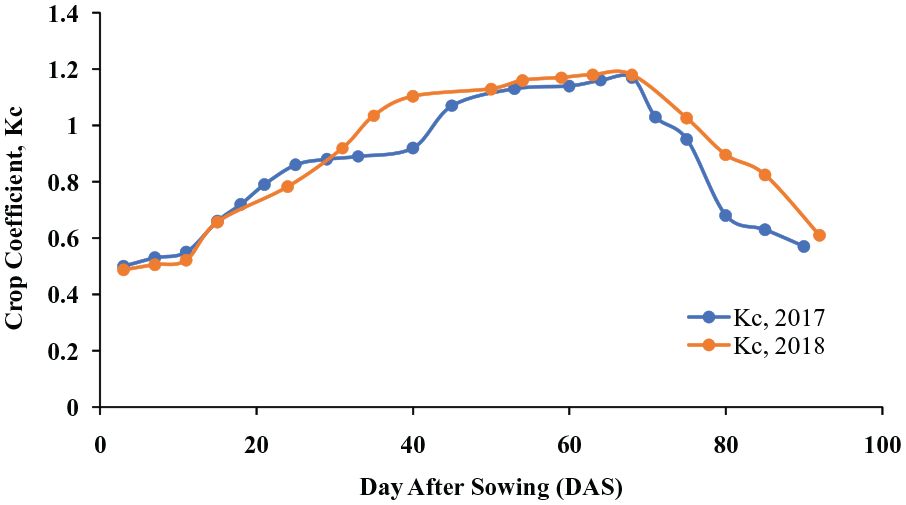
Crop coefficient (Kc) values as a function of days after sowing for 2017, and 2018 sorghum growing seasons.
Locally Developed Kc Values for Sorghum at Melkassa During 2017 and 2018.

Comparison with FAO adjusted and other studies
Table 4 showed a locally obtained and FAO-adjusted Kc value for mid, and end-season growth stages. It can be observed that the two seasons’ average locally developed Kc-values were considerably different from FAO-adjusted crop coefficient values for these sorghum growth stages and other publications.
Locally Obtained and FAO-adjusted Kc Values for Sorghum at Melkassa During 2017 and 2018.

Note. Kc-mid-Local and Kc-end-Local are the locally obtained Kc values for mid and end-season, respectively; (Kc-mid(adj)) and Kc-end(adj) is the FAO adjusted Kc values for mid and end-season, respectively where RHmin differ from 45% and wind speed differ from 2 m s−1.
The average Kc-mid-local of 1.15 developed from this study was higher than with a Kc-mid-FAO-adjusted value of 1.01 (Table 4). The average locally developed Kc-mid-local for this study was lower than the sorghum Kc-mid values of 1.24 and 1.18 obtained by Tyagi et al. (2000) and Shenkut et al. (2013), respectively. Sorghum average locally measured Kc values (Kc-mid-local) were higher than the Kc-mid values of 0.99, 1.0, 1.05, and 1.1 reported by Lima et al. (2021), Piccinni et al. (2009), Howell et al. (2006), and Allen et al. (1998), respectively. However, a similar sorghum Kc-mid-local value of 1.15 was obtained by Bashir et al. (2008) in Sudan, Gezira, using a satellite-based energy balance model.
Two years’ average locally measured Kc-end-local value of 0.59 was higher than with a Kc-end-FAO-adjusted value of 0.52 (Table 4). It exceeded that of the Kc-end-FAO-adjusted value by 11.86%. The average locally developed Kc-end-local values of sorghum were greater than the Kc values of; (Kc-mid = 0.4 and 0.48) reported by Howell et al. (2006) and Bashir et al. (2008), respectively.
The average Kc-ini-local value of (0.55) measured in this study was equal to that of the Kc-ini values of 0.55 reported by Bashir et al. (2008). However, the average Kc-ini-local value obtained from this study was higher than the Kc values developed by Tyagi et al. (2000) and Lima et al. (2021). In general, this variation of Kc values between the locally developed, the FAO adjusted and other studies could be attributable to the difference in local climatic conditions, growing window, soil texture, and management practice.
Implication for irrigation and crop management
Determining actual crop evapotranspiration and developing regionally based Kc-value helps to provide reference information for irrigation water management for sorghum in semi-arid areas of Africa in particular the semi-arid part of Ethiopia. It is key to optimizing irrigation events, determining the timing and quantity of irrigation events, providing real-time irrigation recommendations, and for irrigation scheduling, planning, and development. Moreover, it provides precise water application to crops in areas where irrigation practices take place. Consequently, it can help private consultants and growers to avoid water overuse and to more precisely meet the crop water demand to produce greater yields, crop quality, and enhanced water use efficiency.
Conclusions
Sorghum has an enormous role in the economy of sorghum-growing states. However, under-estimation of its actual crop evapotranspiration can cause yield penalty attributable to water stress, whilst over-estimation can result in excessive applied water, consequently reducing available water for other purposes. Kc is a significant parameter influencing the estimation of ETa of any crop, and knowledge of stagewise Kc of sorghum is vital. The study provided knowledge base information on sorghum ETa and Kc by water balance method using a non-weighing lysimeter under local weather conditions which will help to improve irrigation practices in the semi-arid area of Ethiopia. The seasonal ETa values of sorghum were 358.6 mm in 2017 and 377.54 mm in 2018 with an average value of 368.07 mm. The developed periodic sorghum Kc values during the initial, mid, and end-season were 0.56, 1.13, and 0.57 in 2017, respectively, whilst Kc values of 0.54, 1.16, and 0.61 for initial, mid, and end-season, respectively were observed in 2018. The mean sorghum seasonal Kc values over the two experimental years were 0.55, 1.15, and 0.59 for the initial, mid, and end-season, respectively. Compared to these locally measured Kc values with FAO-adjusted Kc-values; the locally obtained Kc values are higher than the FAO-adjusted Kc-values throughout the growth period. This indicated that FOA-adjusted Kc-values would lead to underestimation in the irrigation scheduling of sorghum in a semi-arid part of Ethiopia. The use of Kc values obtained in this study could lead to in correction of sorghum’s actual water use. Generally, this study provided valuable information on the efficient management of irrigation water and precise water applications for sorghum-growing nations of semi-arid regions.
Footnotes
Acknowledgements
The authors acknowledge the Ethiopian Institute of Agricultural Research, Melkassa Agricultural Research Center for providing funds for the experiment and technical support.
Authors Contributions
All authors; Tatek Wondimu Negash, Gobena Dirirsa Bayisa, Abera Tesfaye Tefera, Ketema Tezera Bizuneh, Aynalem Gurms Dinku, Tigist Worku Awulachew, and Gebeyehu Ashemi Bikela read and approved the final content of the manuscript.
Declaration of Conflicting Interests
The author(s) declared no potential conflicts of interest with respect to the research, authorship, and/or publication of this article.
Funding
The author(s) received no financial support for the research, authorship, and/or publication of this article.
Availability of Data and Materials
All data are available on the paper itself.