
Abstract
Land use and land cover change threaten the ecological state of the most polluted urban catchment in South Africa due to the loss of biodiversity. For a country undergoing rapid economic growth, monitoring the impact of land use on water quality provides effective water management mitigations. Therefore, this study aimed to assess the impact of land use and land cover changes on water quality. Historical land use and land cover and water quality data from 2003, 2008, 2013, 2018, and 2023 were used to determine the correlation. Supervised classification with a maximum likelihood classifier was applied to generate LULC classification maps for the selected periods. The Spearman correlation model was used to determine the relationship between LULC change and water quality variables. The results of the LULC change from 2003 to 2023 revealed an increase in residential areas, bare soil, and mines; meanwhile, forest/agriculture and water bodies recorded a decreasing trend. The study findings highlighted the need to adopt sustainable land use management practices to minimise further water quality deterioration in the Klip River.
Introduction
Land use and land cover studies have evolved over the years to understand their influence on the economy and the environment (Meneses et al., 2015). Changes in LULC affect sustainable development goals through the degradation of water resources and biological integrity (Xu et al., 2022). Human activities such as urbanisation, population growth, and industrial development affect the hydrological cycle and geomorphology, which are linked to water quality and quantity (Duan & Takara, 2020). In South Africa, approximately 60% of natural land is degraded, and 91% is susceptible to degradation (Mani et al., 2021). Nephawe (2017) studied the influence of land use changes on wetlands in Limpopo using GIS and remote sensing. The findings showed a conversion rate of 299.984 ha, showing the area’s high degradation rate. Che et al. (2021)investigated the impacts of land use and land cover on the spatial variation of physical and chemical variables in the North-West. The findings suggested increased grassland, water bodies, and cropland from 1999 to 2018. These findings highlighted the transformation caused by human activities in South Africa. Gauteng is the economic hub of South Africa, and it hosts several mining, industrial, intensive farming, and informal settlements. Therefore, establishing effective methods to monitor the influence of LULC change on water quality is essential for river monitoring and management.
Remote sensing is a cost-effective application tool used to evaluate temporal and spatial variations of land use and land cover changes (Mohamed, 2017). The benefits of using remote sensing to analyse are attributed to its repetitive nature and capability to gather data over large spatial areas (Atzberger, 2013). Understanding the relationship between LULC changes and water quality can assist with effective water management and ecological rehabilitation initiatives. Ding et al. (2015) concluded that a comprehensive understanding of these relationships is necessary for effective surface water management strategies to reduce the influx of pollutants into the river systems, thus promoting sustainable water management. Kibena et al. (2014) investigated how LULC Change affect water quality in the upper Manyane, Zimbabwe. The study used a supervised classification, and the results indicated a decreasing trend in woodland, grassland, and bare land and an increasing trend in urban and agricultural areas between 1984 and 2011. It was concluded that urban areas and agriculture were responsible for water quality degradation, with a Pearson Coefficient of r = .97 for chemical oxygen demand and r = .78 for total dissolved solids.
Several studies have indicated that human activities are the leading cause of land use and land cover (LULC) changes that disturb the ecosystem functionality (Chu et al., 2013; Khan et al., 2017; Wagner et al., 2013). Changes in LULC caused by anthropogenic activities impact the water quality (Wagner et al., 2013). Li et al. (2012) investigated the LULC change’s effect on water quality in the Liao River Basin, China. The study showed that water quality in the upper stream was less polluted than downstream, attributed to less influence from LULC changes in the area. They argued that LULC change might increase sediment deposition due to changes in magnitude and peak flow, thus negatively affecting river water flow patterns and reservoir capacity (Li et al., 2012). de Oliveira Serrão et al. (2022) studied the impacts of LULC changes on the hydrological process in Brazil. The study revealed that LULC altered surface runoff and increased sediment deposition.
The Klip River catchment transverses through different land uses, and as a result, the catchment suffers from poor water quality. The Klip River is one of the most heavily polluted rivers in South Africa, and there are limited studies that correlate the relationship between water quality and land use and land cover changes using remote sensing techniques. This study aims to bridge the gap by assessing the impact of land use and land cover changes on water quality. The objectives of the study were to (1) identify temporal and spatial variations of the physical and chemical variables for 2003, 2008, 2013, 2018, and 2023, and (2) to assess the influence of land use and land cover change (LULCC) on water quality and their correlation.
Materials and Methods
Study Area
The Klip River catchment extends from the Southern Witwatersrand and flows southward before joining the Vaal River at Vereeniging (Figure 1). The study area was selected based on different land use activities and their potential impacts on water quality.
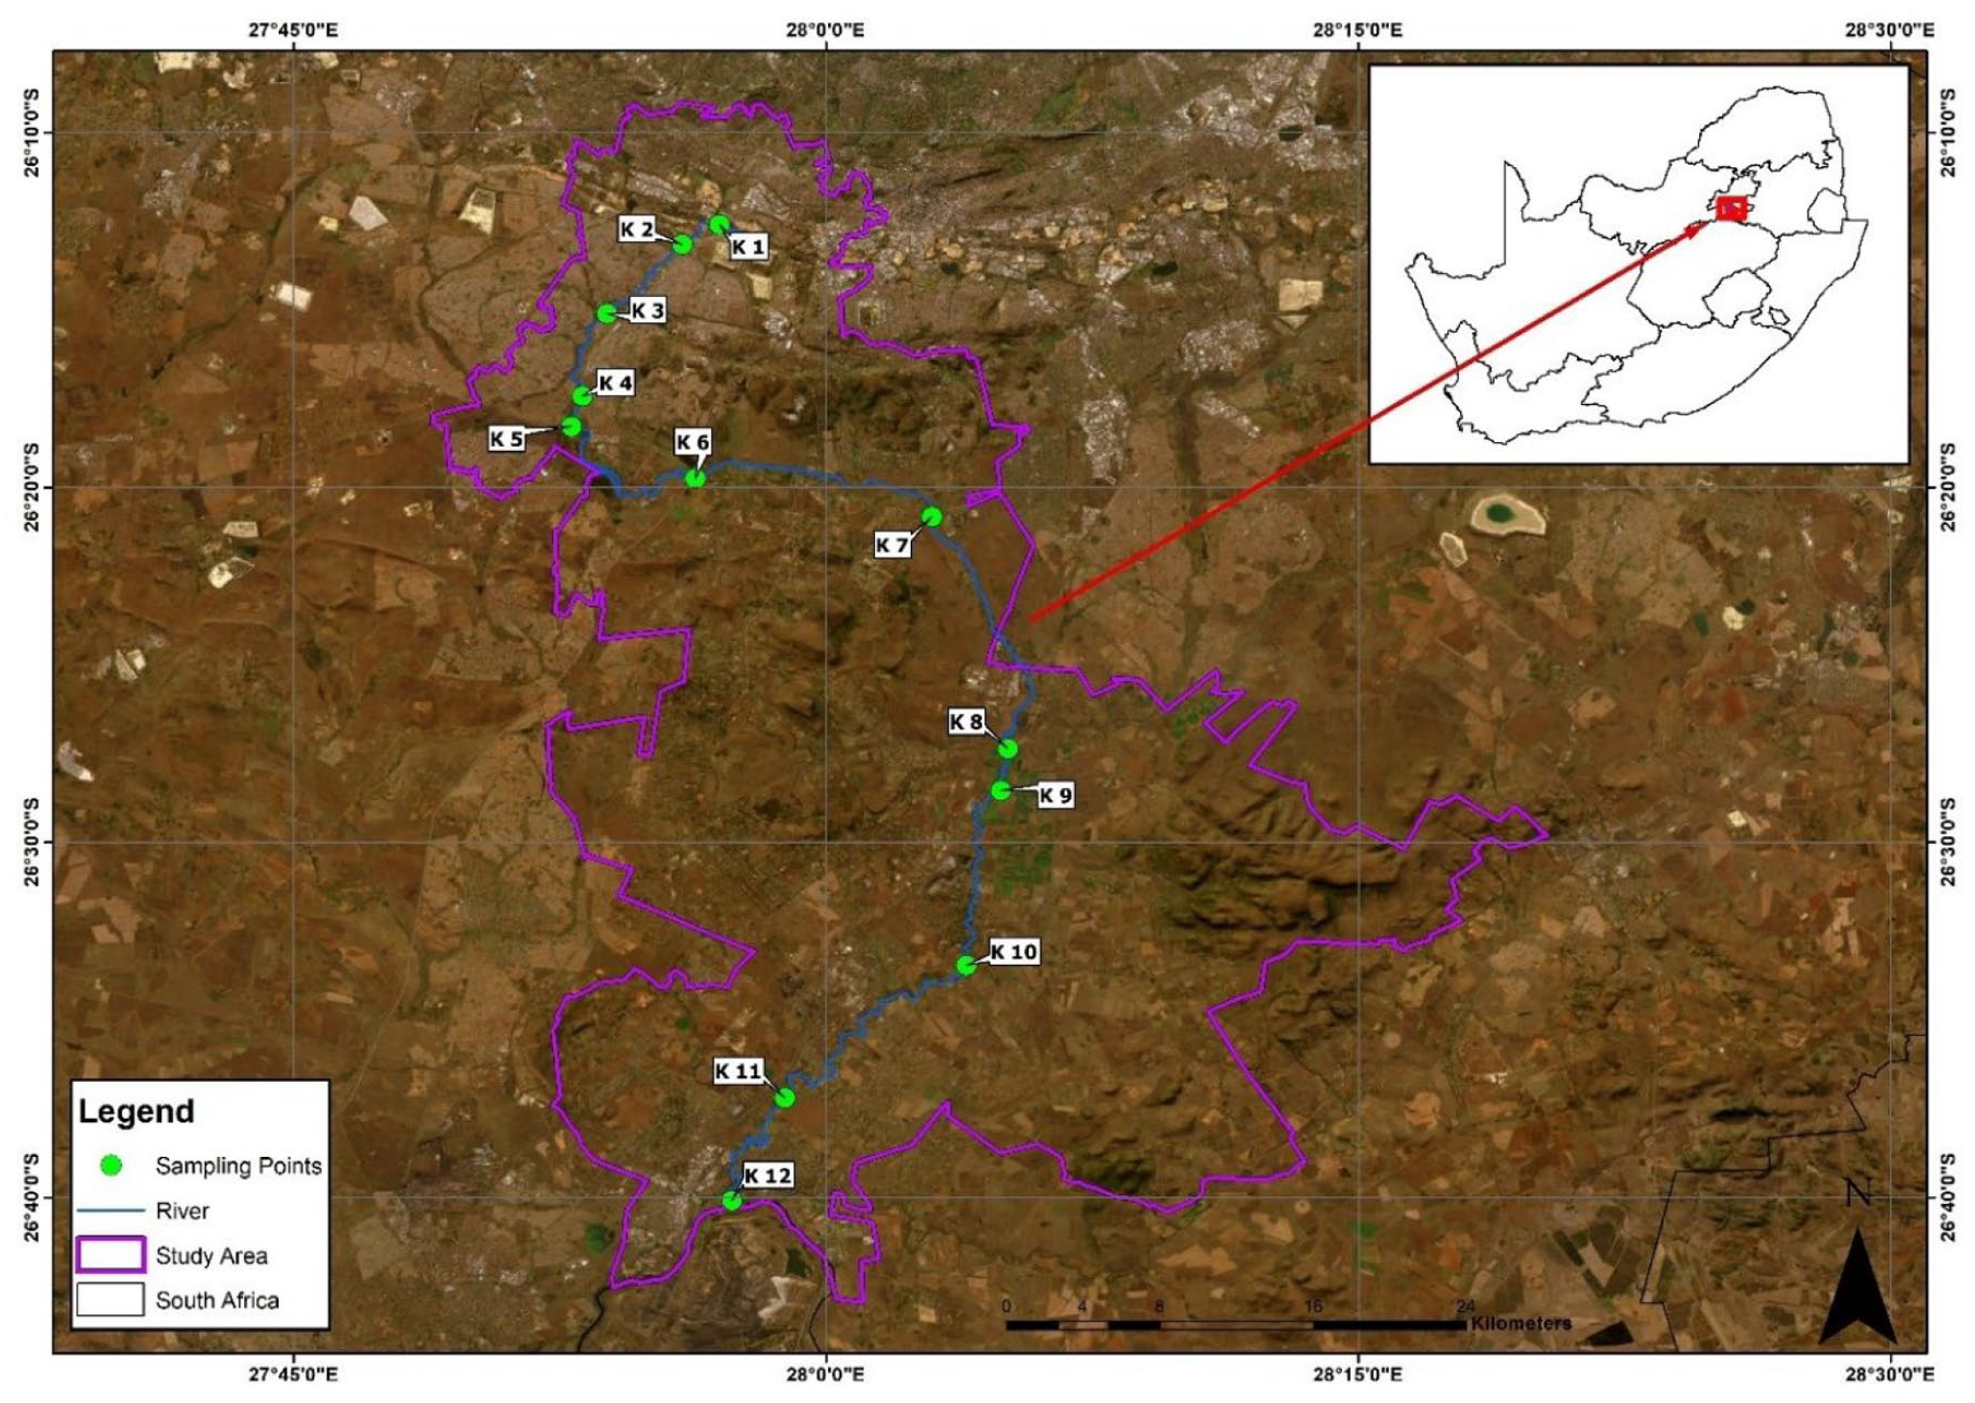
The map showing the location of the study area and sampling sites along the Klip River.
Data Collection
Landsat Data Acquisition
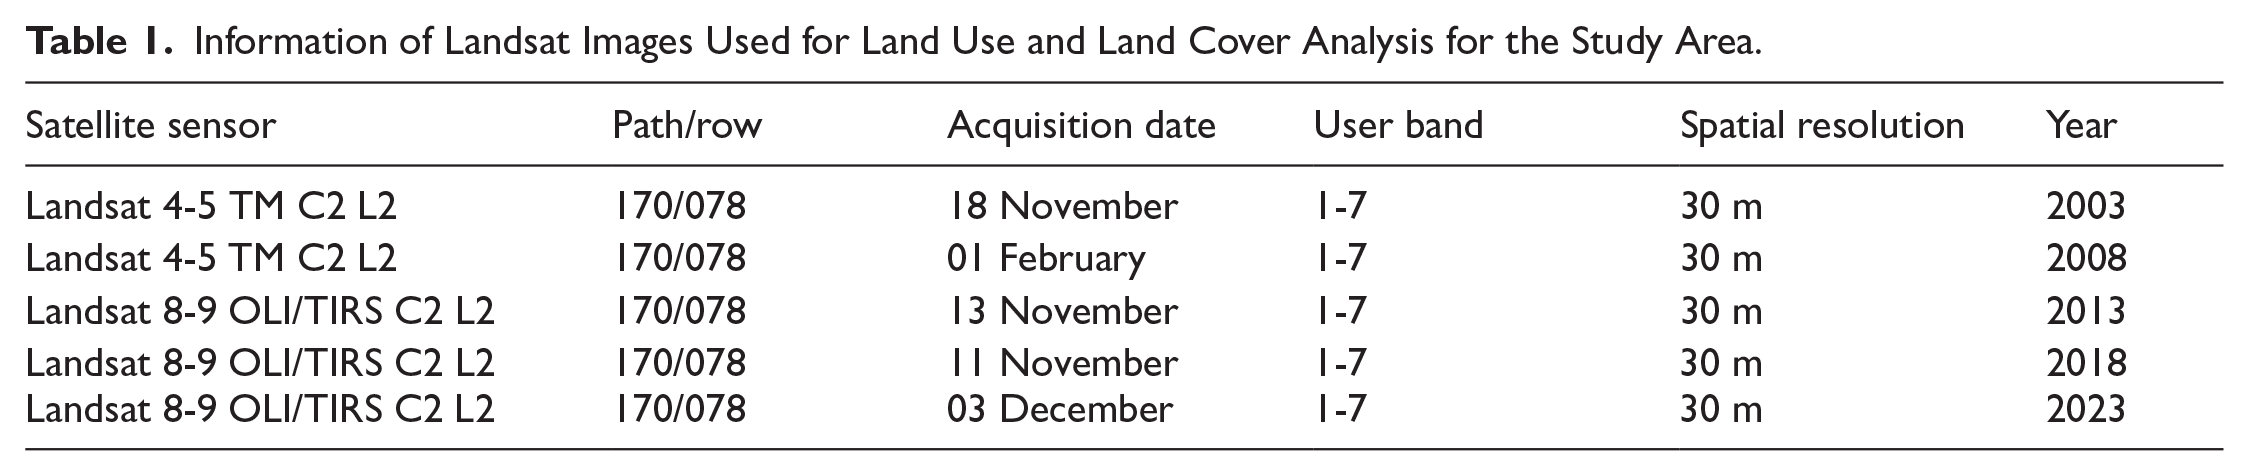
Landsat satellite images from 2003, 2008, 2013, 2018, and 2023 were used to determine LULC changes within the study catchment. The five (5) Landsat images were downloaded from the (EarthExplorer [usgs.gov]) during November, December, and February, which correspond to the summer months in South Africa (Table 1). The Maximum Likelihood Classifier (MLC) was used to classify the satellite images into various LULC categories. A total of 70 training samples per land cover class were selected using a random stratified sampling. A total of 50 independent control points were collected from Google Earth using 2023 imagery. These points were used to perform accuracy assessment through confusion matrix to detect misclassifications. The imagery from 2023 served as a ground truth reference. The approach follows remote sensing best practices of utilising 70 training samples and 50 validation samples per LULC classes (Basheer et al., 2016).
Information of Landsat Images Used for Land Use and Land Cover Analysis for the Study Area.
Accuracy Assessment
In remote sensing, accuracy assessment is essential to determine the quality of the classified maps from remotely sensed data (Congalton & Green, 2019). For the current study, accuracy assessment applied an error confusion matrix where producer’s accuracy (PA, %), user’s accuracy (UA, %), and Kappa Coefficient (%) were calculated using ArcGIS Pro. A random stratified sampling method was selected to determine accuracy assessment, with 215 random points chosen for each image. The study area was subdivided into five (5) classes: residential/built-up area, agricultural land/forest, water body, bare soil/dry patches, and mine, presented in Table 2. The municipal shapefile boundary was used to determine the extent of the study area classifications.
Description of Different Land Cover Classes in the Klip River.

Water Quality Data Collection
Precautionary measures were followed during the collection of in situ parameters. Water quality samples were collected in October 2022 (high-flow sampling) and June 2023 (low- flow sampling). In situ parameters were measured using a YSI Quattro multiparameter probe. Nutrients and biological nutrients water samples were collected using 1.5 L sterile plastic bottles and transported to the South African National Accreditation System (SANAS) accredited laboratory and Waterlab for analysis. The following water parameters were measured and analysed for the year 2022 to 2023: Electrical conductivity (µs/cm), pH, turbidity (NTU), Escherichia coli (CFU/100 mL), Faecal coliform (CFU/100 mL), total dissolved solids (PPM), and chemical oxygen demand (mg/L). The same water quality parameters were obtained from the Department of Water Affairs and Sanitation for 2003, 2008, 2013, 2018, and 2023 using the current study measurements.
Statistical Analysis
Statistical analysis was performed using R studio software to correlate the relationship between land use, land cover change, and water quality. The correlation model was used to determine the strength of the relationship between water quality and LULC changes and whether there was a positive or negative relationship. The Spearman correlation model was used. Continuous, Historical water quality data were sourced from the Department of Water Affairs and Sanitation from 2003, 2008, 2013, 2018, and 2023. Data was extracted for the drainage regions (C22A, C22C, C22D, and C22E) that form part of the study area for the following months: November, December, and February coincide with the LULC change detection conducted for these months. Out of the parameters measured by the DWS, only seven (7) variables were selected: electrical conductivity, pH, total dissolved solids, turbidity, E. coli, faecal coliform, and chemical oxygen demand based on data availability for the respective years. These parameters were selected based on data availability.
Landsat images used for LULC classifications corresponded only to the high-flow season. This was due to a lack of cloud-free images during the low-flow season. DWS data collection and reporting inconsistency influenced this approach as more data was available during the high-flow season. It is important to note that water quality assessment for the current study (2022 and 2023) was done in both seasons, but for correlation purposes, only high-flow data from DWS was used due to data availability, thus corresponding with the land use maps used for similar months. This approach allowed for compatible land use change and water quality data.
The selected variable’s average/mean and the standard deviation for the respective months were obtained. The Spearman correlation model was used to determine the strength of the relationship between water quality and LULC changes and whether there was a positive or negative relationship. The Spearman was chosen because the data was not normally distributed, as shown by the Shapiro-Wilk test. The number of samples (n) used for the analysis was 647 across the selected drainage basins.
For the correlation model, it was assumed that LULC change data would serve as independent variables, while water quality parameters would serve as a dependent variable. The correlation coefficient was calculated at a 95% (p < .05) confidence level for the current study.
Results
Land Use and Land Cover Distribution
The current study revealed that forest/agriculture, residential area/built-up area, bare soil, and mine were the primary land use types in the area, representing significant portions of the study area. There was a constant decrease in forest/agriculture and water bodies from 2003 to 2023, with an increase in residential areas/built-up areas, bare soil/dry patches, and mines. Forest/agriculture was highest in 2008, with a land distribution of 588.82 km2, and the lowest land distribution was observed in 2013 (95.28 km2). Bare Soil/dry Patches increased throughout the years, with the highest distribution in 2013 (732.99 km2) and the lowest land distribution of 290.90 km2 in 2003 (Table 3).
Land Use and Use and Land Cover Change Distribution in the Klip River Catchment From 2003 to 2023.

Mines also increased from 2003, with the most significant distribution observed in 2018 with a total land distribution of 351.52 km2 and decreased thereafter. Like the mines and other land uses, the residential area/built-up area represented the highest portions. It increased over the years, with 2023 recording the highest distribution of 744.64 km2 and the lowest land distribution of 246.32 km2 in 2008. The waterbody class did not show significant change but decreased over the years. The major land use change was a decline in agriculture/forest and water bodies and an increase in residential areas, bare soil, and mines. The highest increase change was shown by residential areas, bare soil/dry patches and mines (13.82, 12.66, and 0.7 km2), respectively. Forest/agriculture had the highest decline (−27.1 km2), and the water body also showed a decrease (−0.09 km2) between 2003 and 2023 (Figure 2a–e).

(a) Land use and land cover classification map of the Klip River in 2003; (b) land use and land cover classification map of the Klip River in 2008; (c) land use and land cover classification map of the Klip River in 2013; (d) land use and land cover classification map of the Klip River in 2018; and (e) land use and land cover classification map of the Klip River in 2023.
Accuracy Assessment
It is essential to evaluate classification results as they show the capability of your classifier to identify the desired object from an image (Rejaur Rahman & Saha, 2008). Therefore, a confusion or error matrix and Kappa analysis were performed. The confusion/error matrix evaluates the model’s performance by comparing the actual values with those predicted by the model. The Kappa Coefficient in remote sensing is an essential tool to measure the accuracy of your model with the ground truth data. The confusion matrix scored over 80% for producers’ and users’ accuracy in most of the images classified (classes), and the Kappa Coefficients were above 80% in all classified images, which is regarded as almost perfect agreement (Tables 4–8). The results suggest the quality of the classified maps is reliable and accurate due to higher accuracy assessment by producers and users and the Kappa Coefficient.
Confusion Matrix for 2003 Image.
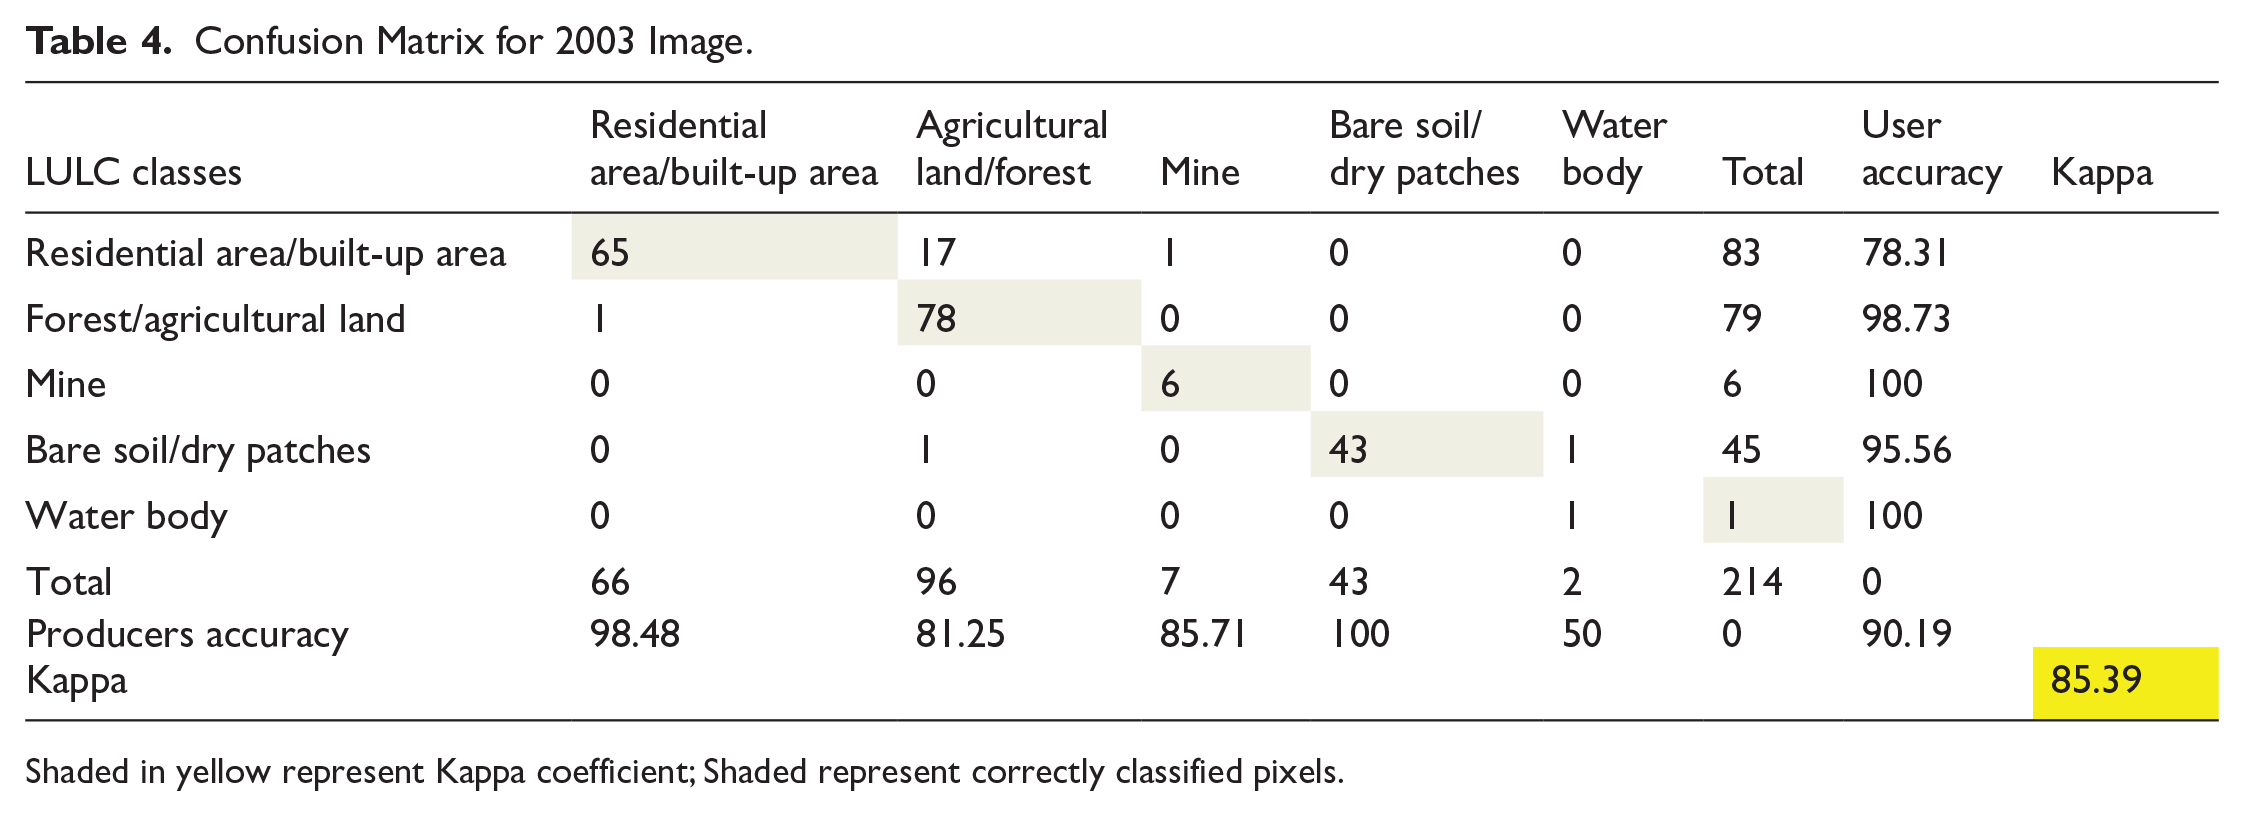

Shaded in yellow represent Kappa coefficient; Shaded represent correctly classified pixels.
Confusion Matrix for 2008 Image.


Shaded in yellow represent Kappa coefficient; Shaded represent correctly classified pixels.
Confusion Matrix for 2013 Image.


Shaded in yellow represent Kappa coefficient; Shaded represent correctly classified pixels.
Confusion Matrix for 2018 Image.


Shaded in yellow represent Kappa coefficient; Shaded represent correctly classified pixels.
Confusion Matrix For 2023 Image.


Shaded in yellow represent Kappa coefficient; Shaded represent correctly classified pixels.
Land Use and Land Cover Change and Water Quality
Mines and water bodies displayed a strongly negative correlation with EC, while bare soil was strongly positively correlated with pH. pH negatively correlated with forest/agriculture and residential/built-up areas and positively correlated with mines and water bodies. It had a positive correlation with bare soil. TDS was insignificant with water variables and showed a negative relationship with bare land, residential areas, mines, and water bodies. A negative relationship was observed for E. coli with forest/agriculture, bare soil, and residential areas, and a positive relationship was observed with mines and water bodies. COD and faecal coliform also displayed positive and negative relationships across different land uses, and they were not statistically significant (Table 9).
Results of Correlation Model Analysis for LULC Change and Water Quality Variables.

Note. The p-value in the parentheses is derived from the Spearman correlation. Statistical significance was tested at a 95% confidence level. asterisks indicate significance at *p < .05, **p < .01. A two-sided test was used for all comparisons.
Water Quality Variables
The measured water quality parameters generally showed higher concentrations during the high-flow (Table 10). Upstream recorded higher concentrations of faecal and bacterial and improved further downstream. pH and EC concentrations were within ideal limits for both seasons. TDS were slightly higher in high-flow, with higher concentrations downstream. Overall, downstream sites had better water quality concentrations.
Measured Water Quality Parameters.


Note. (–) = No data; site K6 data could not be obtained due to inaccessibility to the site during the high-flow season, and total dissolved solids and site one could not be measured due to faulty measuring parameters. Turbidity data was not collected during low-flow due to faulty measuring parameters.
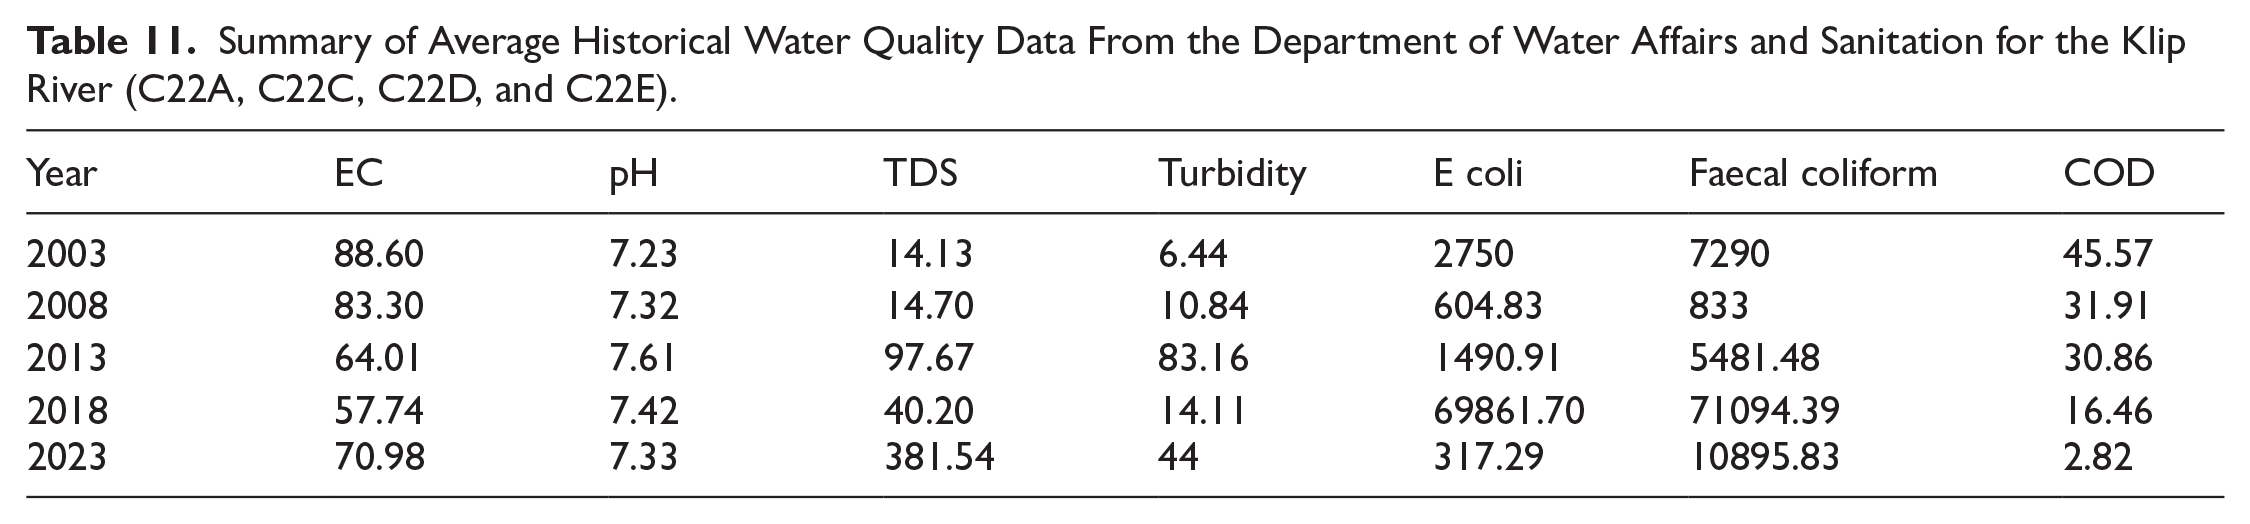
Table 11 summarises historical water quality parameters from the Department of Water and Sanitation (DWS) for 2003, 2008, 2013, 2018, and 2023. The data represents the average values across the selected catchment (C22A, C22C, C22D, and C22E). These parameters are EC, pH, TDS, E coli, turbidity, COD, and faecal coliform. The average results showed a mixed trend over the years; EC and pH remained relatively stable while turbidity and TDS increased significantly, demonstrating a growing water pollution concern. E coli and faecal coliform increased over the years, showing an increase in faecal contamination from informal settlements. COD improved along the measured water catchments, reflecting nutrient pollution reduction in the Klip River.
Summary of Average Historical Water Quality Data From the Department of Water Affairs and Sanitation for the Klip River (C22A, C22C, C22D, and C22E).
Discussion
The current study results showed a decline in forest/agriculture and water bodies relative to an increase in residential areas, bare soil, and mines. The 2003 land use map showed a higher forest/agriculture distribution than in 2013, 2018, and 2023; it could be attributed to the low population and built-up area at that time. It further explains the low bare soil distribution as it was lowest during this period and least impacted by human activities. The results are consistent with the study by Kabanda and Palamuleni (2013), who reported a decline in vegetation and an increase in barren land from 1990 to 2010. The Klip River catchment had the highest bare soil in 2008 and 2013 and decreased from 2018 to 2023; the decrease in bare soil can be ascribed to the COVID-19 lockdown, where human activities were minimised. Jaya et al. (2022) also found that vegetation class increased by 31.86% from 2019 to 2020 due to COVID-19 restrictions towards tourists in the Komodo National Park.
Mining activities within the study area were highest in 2018, leading to a decline in forest and, surprisingly, an increase in water bodies. Building artificial tailing dams for the mining area could influence an increase in water bodies as observed in 2018. The observed mining trends from 2003 to 2008 could be attributed to regulatory changes such as the Mineral and Petroleum Resources Development Act (MPRDA) of 2002, which came into effect in 2004. The law implemented strict environmental and social regulations, which led to the closure of non-compliant mines. Global commodity demand for minerals such as gold, platinum, and coal which are key South African exports could influence increased mining activities observed from 2008 to 2018, these trends were also observed from a study by on Africa’s mining potential. A shift towards renewable energy, COVID-19 restrictions and load shedding led to a decline in mining activities from 2018 to 2023. The residential areas increased due to mining activities from 2018 to 2023. Overall, the change from 2003 to 2023 for forest/agriculture decreased by −27.1%, water body decreased by −0.13%, bare soil/dry patches increased by 12.66%, mine increased by 0.7%, and residential/built-up area increased by 13.82%.
The water EC showed a negative relationship with bare soil, mines, and water bodies, while it was positively correlated with forest and residential/built-up areas. The negative correlation implies that areas with less vegetation contribute to the influx of minerals into the water bodies, while the mining correlation can be attributed to mineral runoff. The findings align with what Nkwanda et al. (2021) reported in the Upper Lilongwe, Malawi. The constant dilution of mineral ions and changes in the water flow could explain the negative correlation of EC with water bodies. TDS was negatively correlated with other land uses except for forest/agricultural areas. However, the positive relationship can be explained by the decomposition of organic matter, which can be released into the water body or agricultural practices promoting soil erosion and salinity accumulation. Unlike other studies by Ogbozige and Alfa (2019) and Nguvulu et al. (2021), the current study did not show a negative relationship between TDS and forest/agriculture, implying that it does not necessarily improve TDS concentration in water. Faecal coliform had a strong positive correlation with residential areas; the positive results suggest that an increase in residential areas is associated with increased faecal coliform concentrations. Townships and informal settlements surround the river; thus, there is a strong correlation between faecal coliform and residential areas. The results indicated severe catchment degradation over the last 20 years.
Water quality results demonstrate a deteriorating trend over the years due to increased anthropogenic activities adjacent to the Klip River catchment. E coli and faecal coliform concentrations were highest during the high-flow season, attributed to the deterioration of waste infrastructures. Upstream sites recorded high concentrations of E coli and faecal coliform due to informal settlement and increased population compared to downstream sites which had high concentrations of nutrients because of farming activities. The historical data summary also showed deteriorating water quality because of increased pressures on water resources. The Klip River water conditions were mostly above water quality guidelines, suggesting a need for sustainable management of water resources in South Africa.
Limitations
As a result of the expensive costs associated with organic and inorganic analysis, surface water was only collected and analysed at the selected sites from upstream, midstream, and downstream to get the overall spatial and temporal variation pollution caused by different land use activities. A faulty probe meter and inaccessibility to the site during sampling resulted in some parameters not being collected during the high and low-flow seasons, which can slightly affect the results. The lack of inconsistency with data collection from the DWS affects the confidence of the results in which strong conclusions can be drawn. Lastly, the lack of cloud-free satellite images that corresponded with the water sampling months, provided challenges to accurately link field data with remote sensing analysis, thus affecting reliability and consistency of the results.
Conclusions
This study assessed the impact of land use and land cover (LULC) changes on water quality’s physical and chemical parameters within the Klip River catchment. The results demonstrated severe degradation over the 20 years caused by anthropogenic activities around the Klip River catchment. The area has experienced a decline in forest/agriculture due to the expansion of built-up areas and bare soil. The decline in forest/agriculture and the expansion of the built-up areas have increased pollution levels, with several water quality parameters exceeding acceptable target limits. Upper streams were closely associated with faecal coliform, which was attributed to informal settlements and downstream sites that recorded high concentrations of organic nutrients because of agricultural practices.
The measured parameter correlated positively and negatively with LULC changes, highlighting the need to monitor their relationship closely. pH showed a strong positive correlation with bare soil, indicating potential alkaline effects linked to land cover changes, whereas EC showed a strong negative correlation with mining and water bodies. These findings highlight the severe degradation of the Klip River’s ecological state, emphasising the need for sustainable intervention.
Sustainable land management practices and targeted ecological restoration initiatives must be prioritised to mitigate further environmental degradation. Decision-makers should focus on implementing strategies such as community engagements and river clean up initiative to rehabilitate the catchment’s ecological state. Additionally, stricter enforcement of land-use regulations and pollution controls is crucial to protecting water resources and ensuring long-term sustainability in South Africa.
Footnotes
Acknowledgements
The author(s) would like to thank the Waterlab and South African National Accreditation System (SANAS) for conducting organic and inorganic analyses. The University of Johannesburg (GEMES) department allows the author(s) to utilise laboratory equipment and data analysis. The author would like to acknowledge the use of AI tool (Grammarly) to improve their English, scientific content, and interpretation remains author responsibility.
Author Contributions
Conceptualisation: Dr. Lee-Ann Modley. Data curation: Dr. Lee-Ann Modley and Prof. Inos Dhau. Formal analysis: Mr. Muwanwa Phunge. Funding acquisition: Dr. Lee-Ann Modley. Investigation: Mr. Muwanwa Phunge. Methodology: Dr. Lee-Ann Modley, Mr. Muwanwa Phunge, and Prof. Inos Dhau. Project administration: Dr. Lee-Ann Modley. Resources: Dr. Lee-Ann Modley and Prof. Inos Dhau.
Funding
The author(s) disclosed receipt of the following financial support for the research, authorship, and/or publication of this article: The authors would like to thank the National Research Foundation for providing financial support for conducting water sample experiments.
Declaration of Conflicting Interests
The author(s) declared no potential conflicts of interest with respect to the research, authorship, and/or publication of this article. We also declare that, as required by these rules and conducts, all sources of materials that are not original to this work have been cited and duly acknowledged.