
Abstract
Climate change and land use changes are significantly impacting the hydrological cycle, influencing the availability and quality of raw water. This study investigates the changes in rainfall patterns, temperature, and land use in the Cirasea Sub-watershed and their effects on water resources for the Tirta Raharja Water Utility, focusing on the Cibangoak Intake. The research utilizes climate projections from three Global Climate Models (MPI-ESM1.2-HR, MPI-ESM1-2-LR, and GFDL-ESM4) under scenarios SSP2-4.5, SSP3-7.0, and SSP5-8.5. Downscaled climate data, combined with historical rainfall, discharge, water quality, and land use data, provided insights into localized trends. Statistical methods like Quantile Mapping, Mann-Kendall, and Spearman Rank tests were applied to detect climate trends, while correlation analysis assessed their impacts on water quality and discharge. Findings show increased rainfall during wet seasons positively correlates with discharge levels, BOD (Biochemical Oxygen Demand), and Fecal coliformforms, while temperature changes negatively correlate with discharge and TSS (Total Suspended Solids). Agricultural and settlement land use are linked to higher TSS and BOD, respectively. Projections for 2025 to 2045 suggest rising rainfall, temperatures, and land use changes may further influence the quantity and quality of raw water at the Cibangoak Intake.
Introduction
Climate change has become a critical issue requiring substantial attention across various sectors. The Intergovernmental Panel on Climate Change (IPCC) defines climate change as long-term alterations in climate characteristics, which can be identified through statistical analysis of climate parameters (IPCC, 2001). This phenomenon is primarily driven by human activities, especially the burning of fossil fuels such as coal, oil, and natural gas, which release greenhouse gases (GHGs) like carbon dioxide (CO2) into the atmosphere. These gases trap heat, leading to rising global temperatures and triggering environmental consequences such as rising sea levels, melting ice caps, and increased frequency of extreme weather events like hurricanes, droughts, and floods. Addressing climate change requires global efforts to reduce emissions, enhance adaptation strategies, and promote sustainable practices (Manikandan & Saraswathi, 2023; Saxena, 2025; Saxena et al., 2023; Wei et al., 2020).
One significant impact of climate change that warrants considerable attention is in the water resources sector. Research by Prasetiawan (2015) indicates an increase in the average annual temperature of approximately 1°C to 1.2°C in the Lebak Regency by 2050 due to climate change. This temperature rise leads to heightened evaporation and evapotranspiration, resulting in reduced rainfall during the dry season and increased precipitation during the wet season. Furthermore, water quality is expected to deteriorate as temperature changes affect various physical and chemical processes in water bodies, such as water density, gas solubility, compound solubility, and the properties of toxic substances, while also influencing biological and chemical processes (Boyd, 2015; Boyd & Lichtkopler, 1979; Howerton, 2001). Shifts in rainfall patterns due to climate change, manifesting as floods and droughts, may further impact water quality. Additionally, land use changes, particularly the conversion of natural land into built-up areas, are likely to increase surface runoff, consequently affecting raw water quality.
In addition to affecting water quantity, climate change also impacts water quality. The decline in water quality is largely driven by liquid waste discharge from agriculture, residential areas, livestock, industry, and other sources. However, indirectly, human activities that emit greenhouse gases, such as CO2, contribute to global warming, which in turn affects water quality. Climate-induced temperature changes exacerbate water quality issues by impacting various physical, chemical, and also biological processes in aquatic systems. Some water quality parameters affected by temperature include dissolved oxygen (DO) levels, total dissolved solids (TDS), organic content such as biochemical oxygen demand (BOD) and chemical oxygen demand (COD), microbiological content, and nutrients. Altered rainfall patterns due to climate change cause floods and droughts can also affect water quality. During floods, increased water flow elevates parameters such as total suspended solids (TSS) and turbidity. Conversely, during droughts, higher temperatures and reduced flow can increase BOD levels. This degradation in water quality can impact raw water treatment processes, especially at regional water company, leading to increased operational costs, such as greater demand for coagulants and expanded treatment capacity.
Numerous studies have explored the impacts of climate change on water resources. For instance, Choi et al. (2010) investigated how climate change affects the quantity and quality of the Byeongseong River in Korea. However, research on these impacts in Indonesia, particularly within the local water company sector, remains limited. Existing studies, such as those by Pujiraharjo et al. (2015) on raw water availability in the Greater Malang region and Prasetiawan (2015) on regional water supply in Lebak Regency, primarily focus on water quantity. In addition to climate change, land use changes also play a crucial role in water resource dynamics. Majidi et al. (2024), for example, examined the combined effects of climate and land use changes on flood damage in Aqala, Iran, employing hydrological and hydraulic models such as SSA (Storm and Sanitary Analysis) and HEC-RAS to predict flood discharge and assess damage. While previous studies have largely emphasized water availability, the influence of climate change on water quality remains underexplored, especially in Indonesia. The conversion of natural land into developed areas increases surface runoff, which in turn affects raw water quality. This study combines an analysis of climate change impacts with land use factors to assess both the availability and quality of raw water resources.
The Local Public Water Supply Company Tirta Raharja is responsible for providing clean water to the Greater Bandung area. Given the essential role this company plays in supplying clean water to the residents of Greater Bandung, it is crucial for Tirta Raharja to consistently maintain the quantity and quality of its processed water. Therefore, a comprehensive understanding of the relationship between climate change and the availability and quality of Tirta Raharja’s raw water sources is essential for ensuring the sustainability of clean water services in the Bandung area.
The objective of this study is to determine the impact of climate change and land use factors on Tirta Raharja’s raw water sources, focusing on both quantity and quality aspects. It is hoped that this research can serve as a basis for developing adaptation and mitigation strategies to address the challenges posed by climate change in the regional water utility sector, ensuring a continuous supply of clean water for the community.
Materials and Methods
Description of the Study Area
This study is conducted at the regional public water utility company Tirta Raharja, located in the upstream area of the Citarum watershed (DAS Citarum). The focus of the study is one of the transmission system components within the Ciparay Water Supply System (SPAM), specifically the Cibangoak Intake. Geographically, the raw water intake for Ciparay SPAM is situated in the Cirasea Sub-basin at coordinates 7°07′38.7″S, 107°42′05.5″E, as shown in Figure 1.

Study location.
The raw water used in Ciparay SPAM is sourced from the upper reaches of the Citarum River. The study’s focus on the Cibangoak Intake in Ciparay SPAM was selected based on disaster data indicating that the Cikoneng-Ciparay SPAM experienced flooding in recent years, which disrupted clean water services. This research took place for approximately 8 months.
Data Collection
This study uses secondary data obtained from agencies managing the Citarum watershed (DAS Citarum) and company sources, as follows:
a. Climate Data
The climate data used are outputs from climate models based on three General Circulation Models (GCMs): MPI-ESM1-2-LR, MPI-ESM1-2-HR, and GFDL-ESM4, with emission scenarios SSP2-4.5, SSP3-7.0, and SSP5-8.5. According to research by Ge et al. (2021), which examined rainfall changes in Southeast Asia, the MPI-ESM1 model demonstrates satisfactory performance, with predominantly negative RMSE′ values, indicating superior performance compared to the other 50% of climate models used in their study. This means that the MPI-ESM1-2-LR and MPI-ESM1-2-HR models can represent the climate in the Southeast Asian region (which includes the study area in this research) quite well, making them the chosen climate models for this study. The GFDL-ESM4 model is used as a comparison to evaluate the best climate model that can represent the climate conditions in the study area of this research. Climate model data were sourced from the CMIP6 archive, accessible at https://aims2.llnl.gov/search/cmip6/.
b. Rainfall and Temperature Data
Rainfall data are derived from monthly rainfall records at four stations around the Cirasea watershed (Cikancung, Cipanas, Cibereum, and Cipaku/Ciparay) covering the period from 1996 to 2022. Temperature data consist of daily temperature records converted to monthly maximum and minimum values, covering 2010 to 2020, obtained from the Ciparay Climatology Post of PUSAIR.
c. Water Quality and Discharge Data
Raw water quality data are based on historical monitoring records at the Cibangoak Intake area from 2012 to 2021 period. The water quality parameters analyzed in this study include TSS, turbidity, BOD, COD, nutrients, and E. coli. The data were obtained from the water quality monitoring of the Tirta Raharja Local Public Water Supply Company and the West Java Environmental Agency. The water quality data were collected through sampling and laboratory testing conducted biannually, during the periods of January to June and July to December, representing the wet and dry seasons.
The study location is at the Cibangoak Intake, which sources raw water from the Citarum River and is located upstream of the Citarum-Majalaya monitoring point. Since discharge data for the intake are unavailable, discharge data at the Citarum-Majalaya monitoring point covering the period from 2001 to 2022 were used, adjusted by catchment area ratio. This approach is based on the fundamental principles of watershed flow, where the downstream area (Citarum-Majalaya) covers a larger catchment area compared to the upstream area (Cibangoak Intake), resulting in a consistently higher discharge in the downstream region than in the upstream.
d. Land Use Data
Land use data covers the Cibangoak Intake area for the years 2012, 2016, and 2019. The land use classification used in the analysis includes water bodies, shrubs, residential and built-up areas, agriculture (rice fields and plantations), and forests. The land use data used in this study is secondary data obtained from the Regional Development Planning Agency of West Java Province (2012 and 2016) and other local spatial data sources (2019), which can be accessed at https://www.indonesia-geospasial.com/.
Data Processing
Processing of Climate Data
The spatial resolution of GCM climate model outputs is relatively coarse, with grid sizes ranging from 100 to 500 km (Trzaska & Schnarr, 2014). To achieve higher resolution data, a downscaling process was performed using statistical downscaling, specifically the Quantile Mapping (QM) approach. The QM method assumes that the distribution of simulated or estimated data aligns with the distribution of observed data. In this method, simulated data at a given probability level are replaced by the quantile of observed (historical) data corresponding to the same probability level (Heo et al., 2019). Themeßl et al. (2012) reported that the Quantile Mapping approach effectively reduces biases in the mean, maximum, and minimum values of temperature and precipitation data, particularly in the higher quantiles of regional-scale climate data. The climate data processing using the QM method in this study was conducted through the Google Colaboratory browser, a “Jupyter Notebook” service that allows users to write and execute Python code through a browser. The package function used is the “bias-correction” package available in Python. The historical input data consists of point data, including rainfall data, maximum temperature data, and minimum temperature data from Ciparay Climatology Station, covering the period from 2010 to 2014. The selection of this data was adjusted to match the available data length with the historical data of the GCM.
The performance of the resulting forecasting model is then evaluated using the Root Mean Square Error (RMSE) as an accuracy metric. Given y(j) as the observed value of the predictand variable and y′(j) as the predictor value from the model output, the RMSE can be formulated as follows.

To compare the models used, the mean error values are normalized as follows (Abadie & Moral, 2023; Gleckler et al., 2008; Ruosteenoja, 2021).

RMSE′(j) measures model performance relative to the median value across the three models used. Negative (positive) values indicate that a model is more suitable than the median model, thus yielding better performance.
Classification of Seasons Based on Rainfall
The classification of wet and dry seasons is based on the study by Murray-Tortarolo et al. (2017), which defines the wet season as the number of months with an average rainfall >100 mm and the dry season as the number of months with an average rainfall <100 mm. This threshold was selected based on prior studies, which found that runoff occurs when monthly rainfall exceeds 80 to 120 mm (Zhang et al., 2004), as well as similar research by Malhi et al. (2009) and Doughty et al. (2015) in the Amazon River, which established a threshold of approximately 100 mm/month to hydrologically distinguish seasons (Murray-Tortarolo et al., 2017).
Statistical Tests
Statistical tests are conducted to analyze trends, variations, or relationships between variables. For hydrological and meteorological data, non-parametric tests are preferred over parametric tests, as parametric tests are more suitable for independent data with a normal distribution (Chen et al., 2007; Kyei et al., 2023). Non-parametric tests only require data independence and are robust against non-normal distributions and outliers. To investigate data trends and relationships among hydrological and meteorological variables, the Mann-Kendall (MK) and Spearman Rank (Spearman’s Rho) tests are commonly used for time series data (Ashraf et al., 2021; Chen et al., 2007; Fu & Wang, 2012; Kyei et al., 2023; Yanming et al., 2011). The null hypothesis (H0) indicates randomness and the absence of a trend in the data series, whereas H1 (rejection of H0) suggests the presence of a trend in the data series (Lornezhad et al., 2023; Sen, 1968; Suryanto & Krisbiyantoro, 2018). The conclusion is drawn by rejecting H0 if the calculated z-value exceeds the critical z-value from the standard normal table. If the z-statistic is positive, the data is considered to have an increasing trend; conversely, if the z-statistic is negative, the trend is considered to be decreasing.
The relationship between rainfall, temperature, and streamflow, as well as raw water quality, will be examined using correlation and multiple linear regression analysis. Correlation is a technique used to determine the strength of the relationship between two or more variables, represented by a correlation coefficient. Regression analysis is used for predicting how the dependent variable changes when the independent variable values increase or decrease (Sugiyono, 2013). Statistical tests are conducted using Excel and SPSS version 25, with rainfall, temperature, and land use as independent variables, and streamflow and various water quality parameters as dependent variables.
Results and Discussion
Climate Condition of the Study Area
The climatic conditions of the study area in this research are reviewed from the temperature parameters and also rainfall. The average annual temperature data of Ciparay Sub-district is presented in Figure 2 as follows.
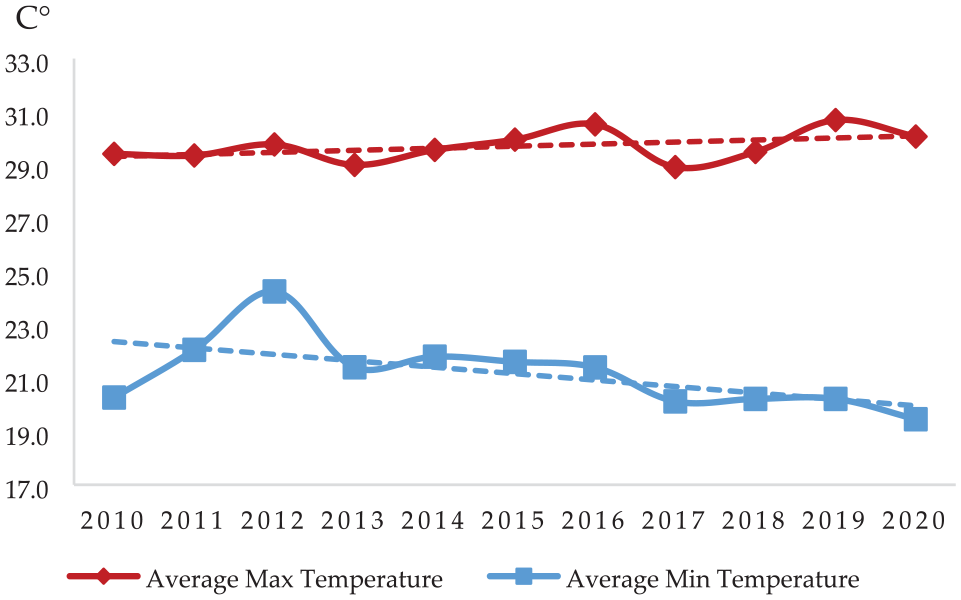
Average annual temperature of the Cirasea watershed 2010 to 2020
Based on temperature data from 2010 to 2020, the average minimum temperature in the Cirasea watershed ranged from 19.5°C to 24.3°C, while the average maximum temperature ranged from 28.9°C to 30.7°C, with an average difference between maximum and minimum temperatures of 8.5°C. As shown in Figure 2, there was an increase in minimum temperature from 2010 to 2012, followed by a decreasing trend from 2014 to 2020, while maximum temperatures showed slight fluctuations during the 2014 to 2020 period. The rainfall conditions in the Cirasea watershed are shown in Figure 3.

Average rainfall of the Cirasea Subwatershed 1996 to 2022.
According to Figure 3, the monthly rainfall pattern in the Cirasea sub-watershed follows a monsoonal pattern, with the peak of the dry season occurring in July to August to September and the peak of the wet season in February to March to April. Based on the seasonal classification by Murray-Tortarolo et al. (2017), the months classified as wet (monthly rainfall >100 mm) are January, February, March, April, May, October, November, and December, while the dry season months (monthly rainfall <100 mm) are June, July, August, and September. Based on Figure 4, rainfall during the wet season tends to increase. The highest average monthly rainfall is in March, at 276.3 mm, and the lowest is in August, at 16.59 mm.

Average monthly rainfall of the Cirasea Subwatershed by seasons.
Temperature and Rainfall Trend Analysis
Based on the trend test results presented in Table 1, most of the maximum temperatures in the Cirasea watershed do not show a significant trend. However, the Spearman’s Rho test for the month of July indicates an increasing trend in maximum temperature at a 5% significance level. Statistically, the minimum temperature in the Cirasea watershed shows a decreasing trend, particularly in November and December.
Trend test Results for Maximum Temperature, Minimum Temperature, and Rainfall in the Cirasea Watershed.
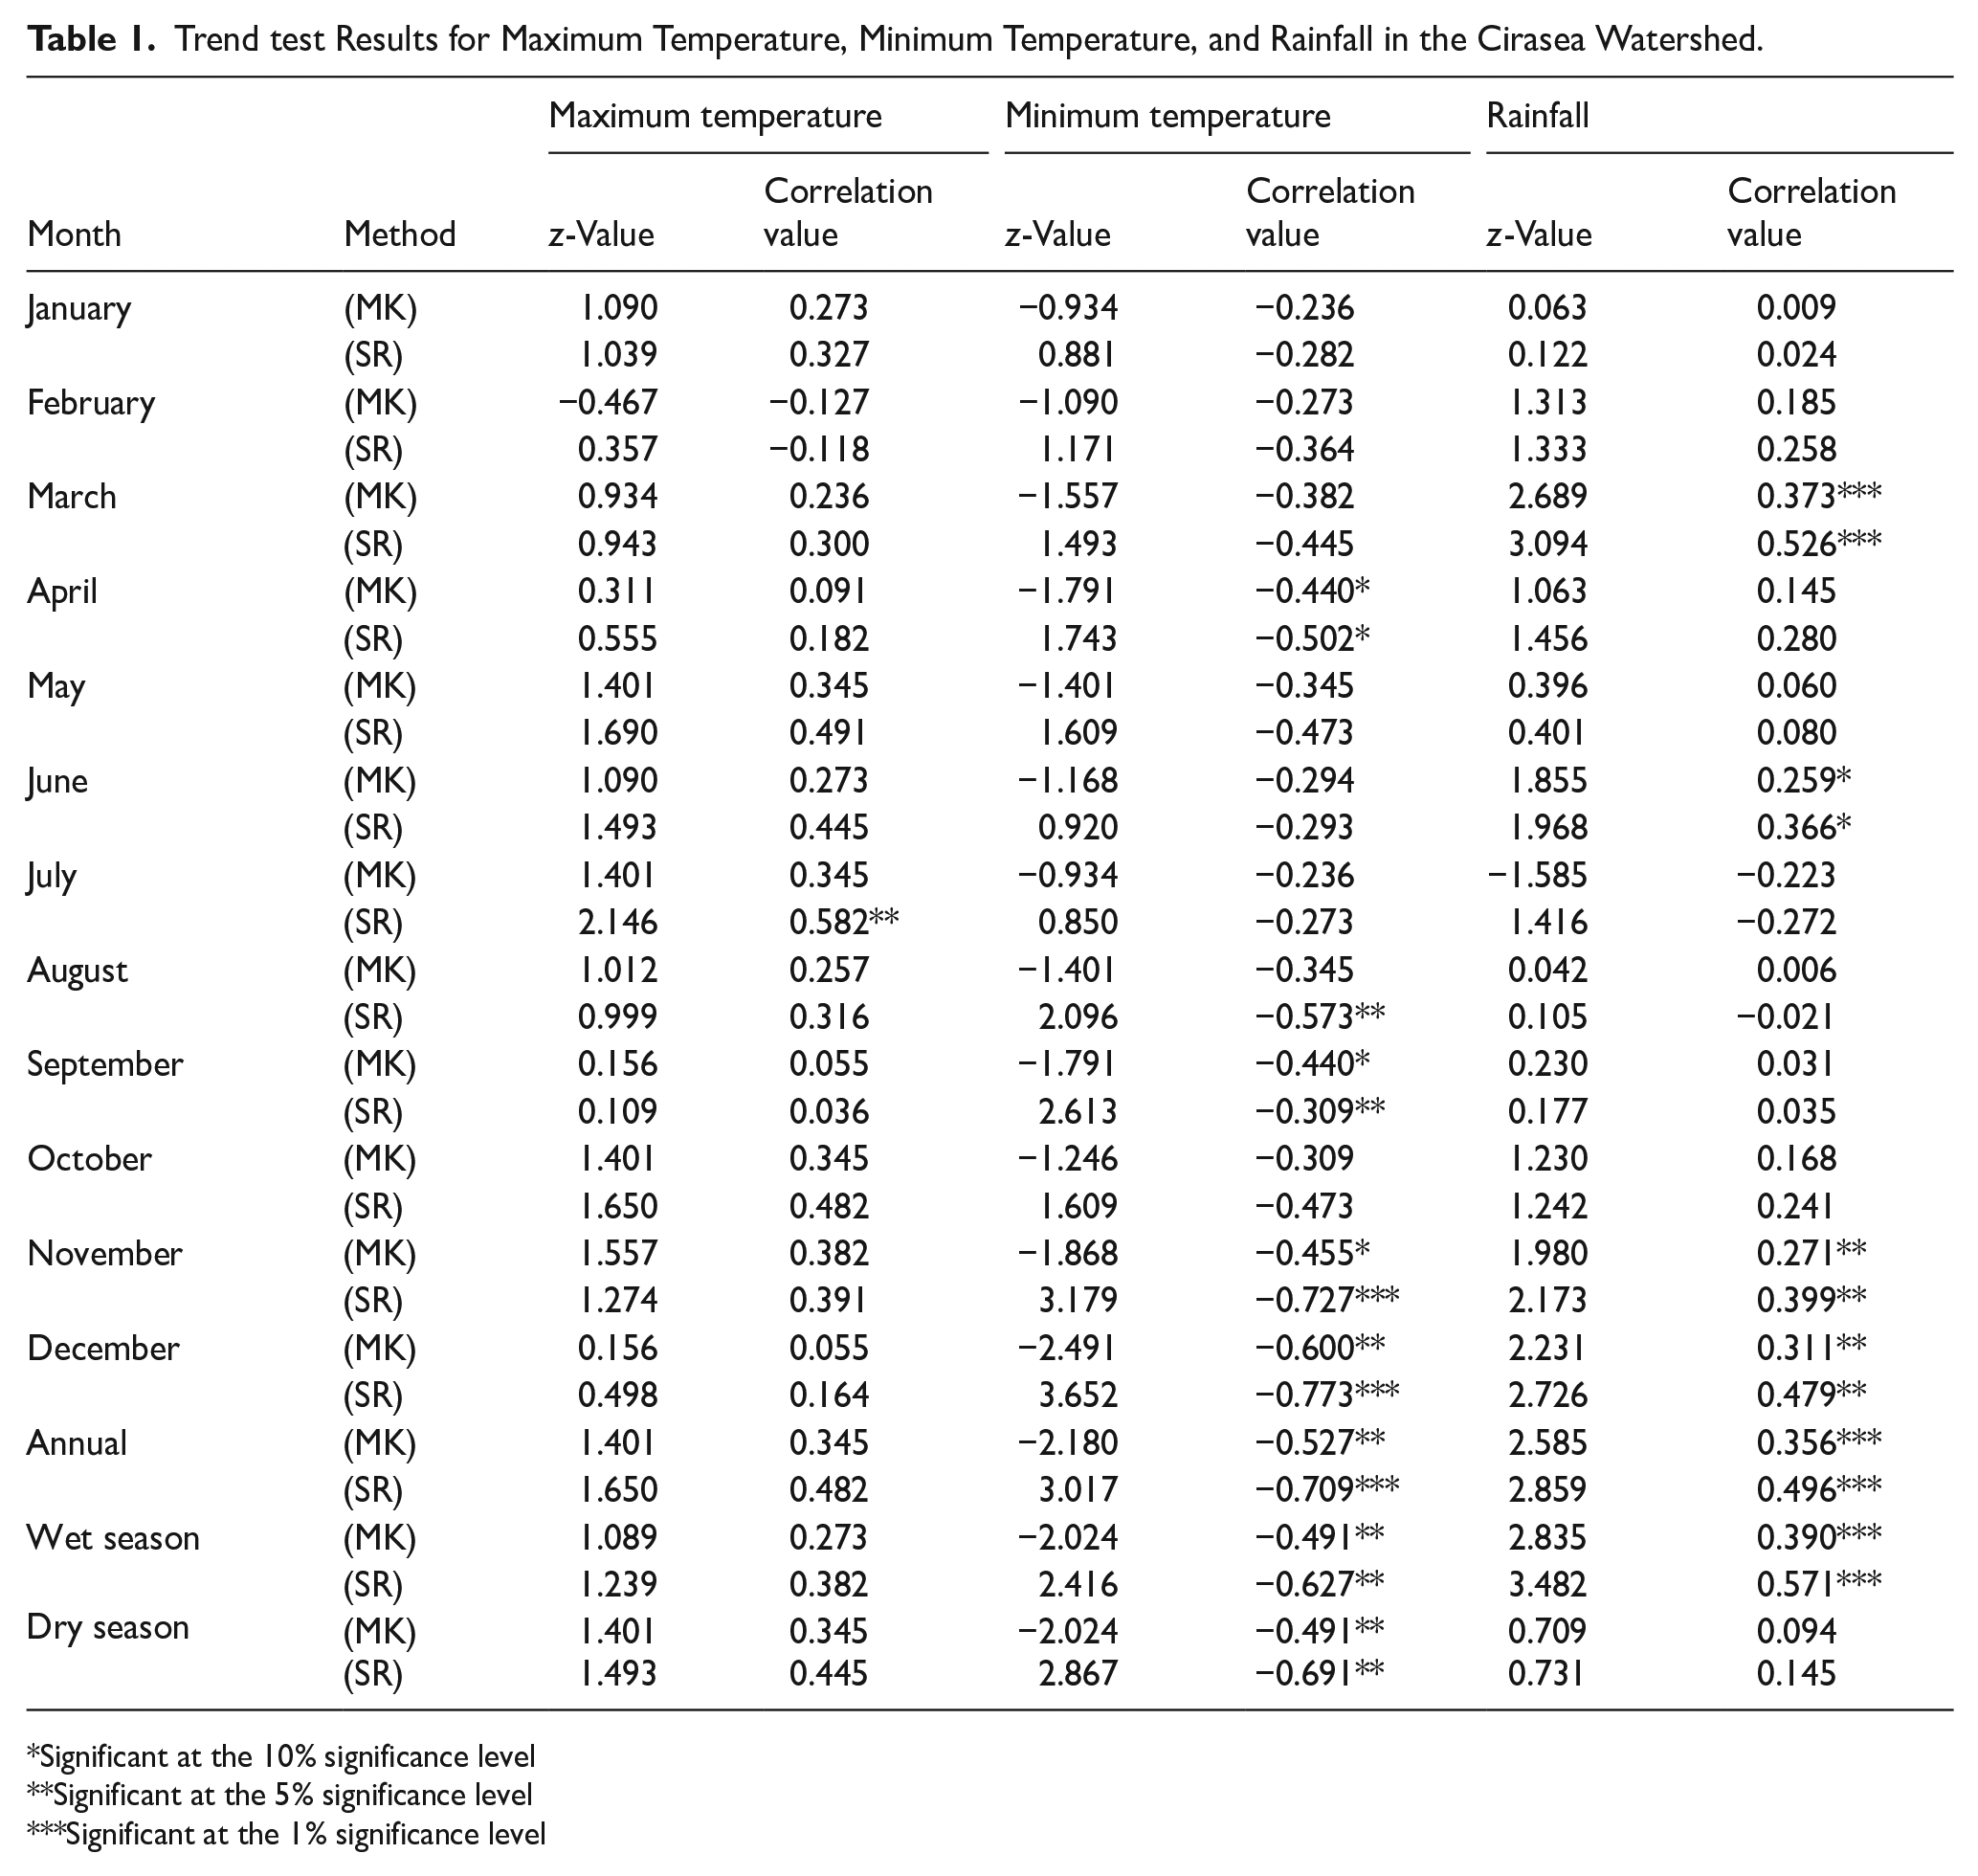
Significant at the 10% significance level
Significant at the 5% significance level
Significant at the 1% significance level
In June, which is classified as a dry month, there is an increasing trend in rainfall at the 10% significance level. In November and December, there is an increasing trend at the 5% significance level. Overall, the annual rainfall data shows an increasing trend, with higher rainfall during the wet season, meaning that the wet season will become wetter.
Temperature and Rainfall Projections
Temperature Projections
Temperature projections refer to predictions or estimates of how surface temperatures will change in the future. The selected GCM models for projecting maximum and minimum temperatures are the MPI-ESM1-2-LR and MPI-ESM1-2-HR models, as they have the smallest RMSE′ values according to Table 2. Based on the projection analysis results for the years 2025 to 2045 compared to the 2010 to 2020 temperatures in Table 3, the average maximum temperature for 2025 to 2045 is projected to decrease by −0.9°C, −0.7°C, and −1°C under the SSP2-4.5, SSP3-7.0, and SSP5-8.5 scenarios, respectively. The average minimum temperature is projected to increase by 1.2°C, 1.3°C, and 1.4°C under the SSP2-4.5, SSP3-7.0, and SSP5-8.5 scenarios, respectively. While the maximum temperature is projected to decrease, the minimum temperature is expected to increase, indicating an increase in the lower bound of the average temperature in the study area. The temperature projections are shown in Figure 5. As follows.
RMSE′ Values for Each Climate Model.

Changes in Average Temperature for 2025 to 2045 Compared to the Average Temperature for 2010 to 2020.


Cirasea Watersheds annual temperature projections 2025 to 2045.
Table 4 above presents the trend test results for the projected maximum and minimum temperature data for the years 2025 to 2045. Based on the projected temperature trend test results, the maximum temperature does not show a statistically significant trend. However, the SSP2-4.5 and SSP5-8.5 scenarios indicate an increase in maximum temperature, as evidenced by the positive z-value obtained from both tests. The trend test results for the projected data align with the historical maximum temperature trend test results, which also indicate an increase in maximum temperature at the study location.
Trend Test Results for Maximum Temperature and Minimum Temperature Projections (2025–2045).

Significant at the 10% significance level.
Meanwhile, the trend test results for the projected minimum temperature data show a positive z-value, indicating an increasing trend. However, the projected minimum temperature trend test results do not align with the historical minimum temperature trend test results. This discrepancy may be due to the limited length of historical data used as input in the climate data downscaling process (covering the period 2010–2014), which is constrained by the availability of data for the Cibangoak Intake location. As a result, the projection model may not yet fully capture the climate conditions at the study site.
Rainfall Projections
The monthly rainfall projections were obtained from the MPI-ESM1-2-LR model, which resulted in the smallest RMSE′ value. Based on the projection analysis for rainfall from 2025 to 2045 compared to rainfall from 2010 to 2020 in Table 5, there is an increase in the average monthly rainfall compared to the base year (2010–2020).
Percent Change in Average Monthly Rainfall (2025–2045) Compared to the Base Year (2010–2020).

The largest increase in rainfall is projected for June, July, August, and September, which are part of the dry season (ranging from 100 to 300 mm). The SSP5-8.5 scenario results in the highest annual rainfall increase, with a 67% increase, followed by the SSP2-4.5 scenario with a 59% increase, and the SSP3-7.0 scenario with a 54% increase. The differences between the projections and historical conditions may arise due to the historical data used being less than 30 years, which is insufficient to fully capture the climate conditions of the study area. The rainfall projections are shown in Figures 5 and 6 as follows.

Cirasea Watersheds monthly rainfall projections 2025 to 2045.
Table 6 above presents the results of the trend analysis for projected rainfall data from 2025 to 2045. Based on the trend analysis of projected rainfall, there is a statistically significant increasing trend (alpha 10%) in the SSP5-8.5 scenario for April and May, which are classified as rainy months. The trend analysis of projected rainfall under each SSP scenario indicates that higher carbon emissions (SSP5-8.5) lead to an increase in rainfall intensity.
Trend Test Results for Rainfall Projections (2025–2045).

Significant at the 10% significance level.
Hydrological Conditions of the Study Area: Discharge and Raw Water Quality
Discharge and water quality are crucial parameters in determining the quantity, availability, and quality of raw water sources. Figure 7 below presents the discharge conditions of raw water at the Cibangoak Intake, derived from the comparative approach based on the catchment area at the Citarum-Majalaya discharge monitoring point as follows.

Average annual discharge at Cibangoak Intake.
Based on Figure 7, the graph shows an increase in discharge during the dry season, while there is only a slight increase during the wet season. The estimated discharge at the Cibangoak Intake during the wet season has an average of 4.27 m3/s, and during the dry season, the average is 1.68 m3/s.
Based on Figures 8, the water quality parameters TSS, turbidity, and DO are higher during the wet season, while COD, BOD, nitrites, and Fecal coliforms are higher during the dry season. In general, the raw water quality at the Cibangoak Intake exceeds the quality standards set in Indonesia’s Government Regulation No. 22 of 2021.

Raw water quality data at Cibangoak Intake.
Trend Analysis of Discharge and Water Quality Data
Based on the trend analysis results in Table 7, discharge during the dry season (June, July, August, and September) shows an increase at the 10% and 5% significance levels, as well as the minimum discharge, which also shows an increase according to both the Mann-Kendall and Spearman Rho tests. This means that during the dry season, there is no drought at the Cibangoak Intake site because of sufficient water availability during the dry season.
Results of Trend Analysis of Discharge at Cibangoak Intake.

Significant at the 5% significance level
Significant at the 1% significance level
Based on the water quality trend test results in Table 8, during the wet season, there is a trend of increasing Fecal coliformform levels. The concentration of bacteria in surface water can increase drastically due to flooding in the watershed (Dakhlalla & Parajuli, 2020; Muirhead et al., 2004; Nagels et al., 2002). During the dry season, there is a trend of decreasing BOD levels as well as an increase in DO and Nitrite levels. This means that, during the dry season, the decrease in BOD will reduce the decomposition of organic materials, causing an increase in DO levels, as decomposition requires oxygen in the process. The increase in Nitrite levels can occur due to a decrease in discharge during the dry season, leading to the concentration of Nitrites. The highest concentrations of Nitrogen and Phosphates occur during the dry season, while the lowest concentrations are observed during the wet season because these concentrations are highly influenced by water discharge (Suteja & Purwiyanto, 2018).
Results of Trend Analysis of Water Quality at Cibangoak Intake.

Significant at the 10% significance level
Significant at the 5% significance level
Significant at the 1% significance level
Land Use Conditions in the Study Area
The Cirasea Sub-Watershed is one of the Sub-Watersheds in the Citarum River area, located in the upper stream. Its position in the upper Citarum Watershed makes the Cirasea Sub-Watershed predominantly mountainous and surrounded by mountain slopes. The Cirasea Sub-Watershed has a poor erosion index. According to Rusdiana and Gufrona (2011) in the study by Nurysyifa and Kaswanto (2021), the average erosion rate in the upper Citarum Watershed is 574.16 t/ha/year, with the land in the upper Citarum Watershed dominated by very high (36.87%) and high (21.84%) erosion hazard levels. The average sediment release due to erosion in the upper Citarum Watershed is 33.88 t/ha/year, with a maximum sediment release of 1044.55 t/ha/year. This condition is influenced by land use changes occurring in the upper Citarum Watershed area. The Cibangoak Intake, located in the upper Cirasea Sub-Watershed, is also impacted by this land conversion. Table 9 presents the land use types at the Cibangoak Intake site.
Land Use (ha) at Cibangoak Intake.

Source. Processed data from land use map of Upper Citarum Watershed and West Java, 2024.
The largest land use at the Cibangoak Intake site is for agriculture (Figure 9). The conversion of forest and shrubland areas, which should have been water catchment areas, into agricultural land has affected the hydrological conditions of the Watershed. This is reflected in the increase in flood discharge in the Cirasea Sub-Watershed by 10.28% (Maryam et al., 2023; Susilawati, 2014) and an increase in the runoff coefficient to 72.04% in 2018 (Atharinafi & Wijaya, 2021; Maryam et al., 2023).
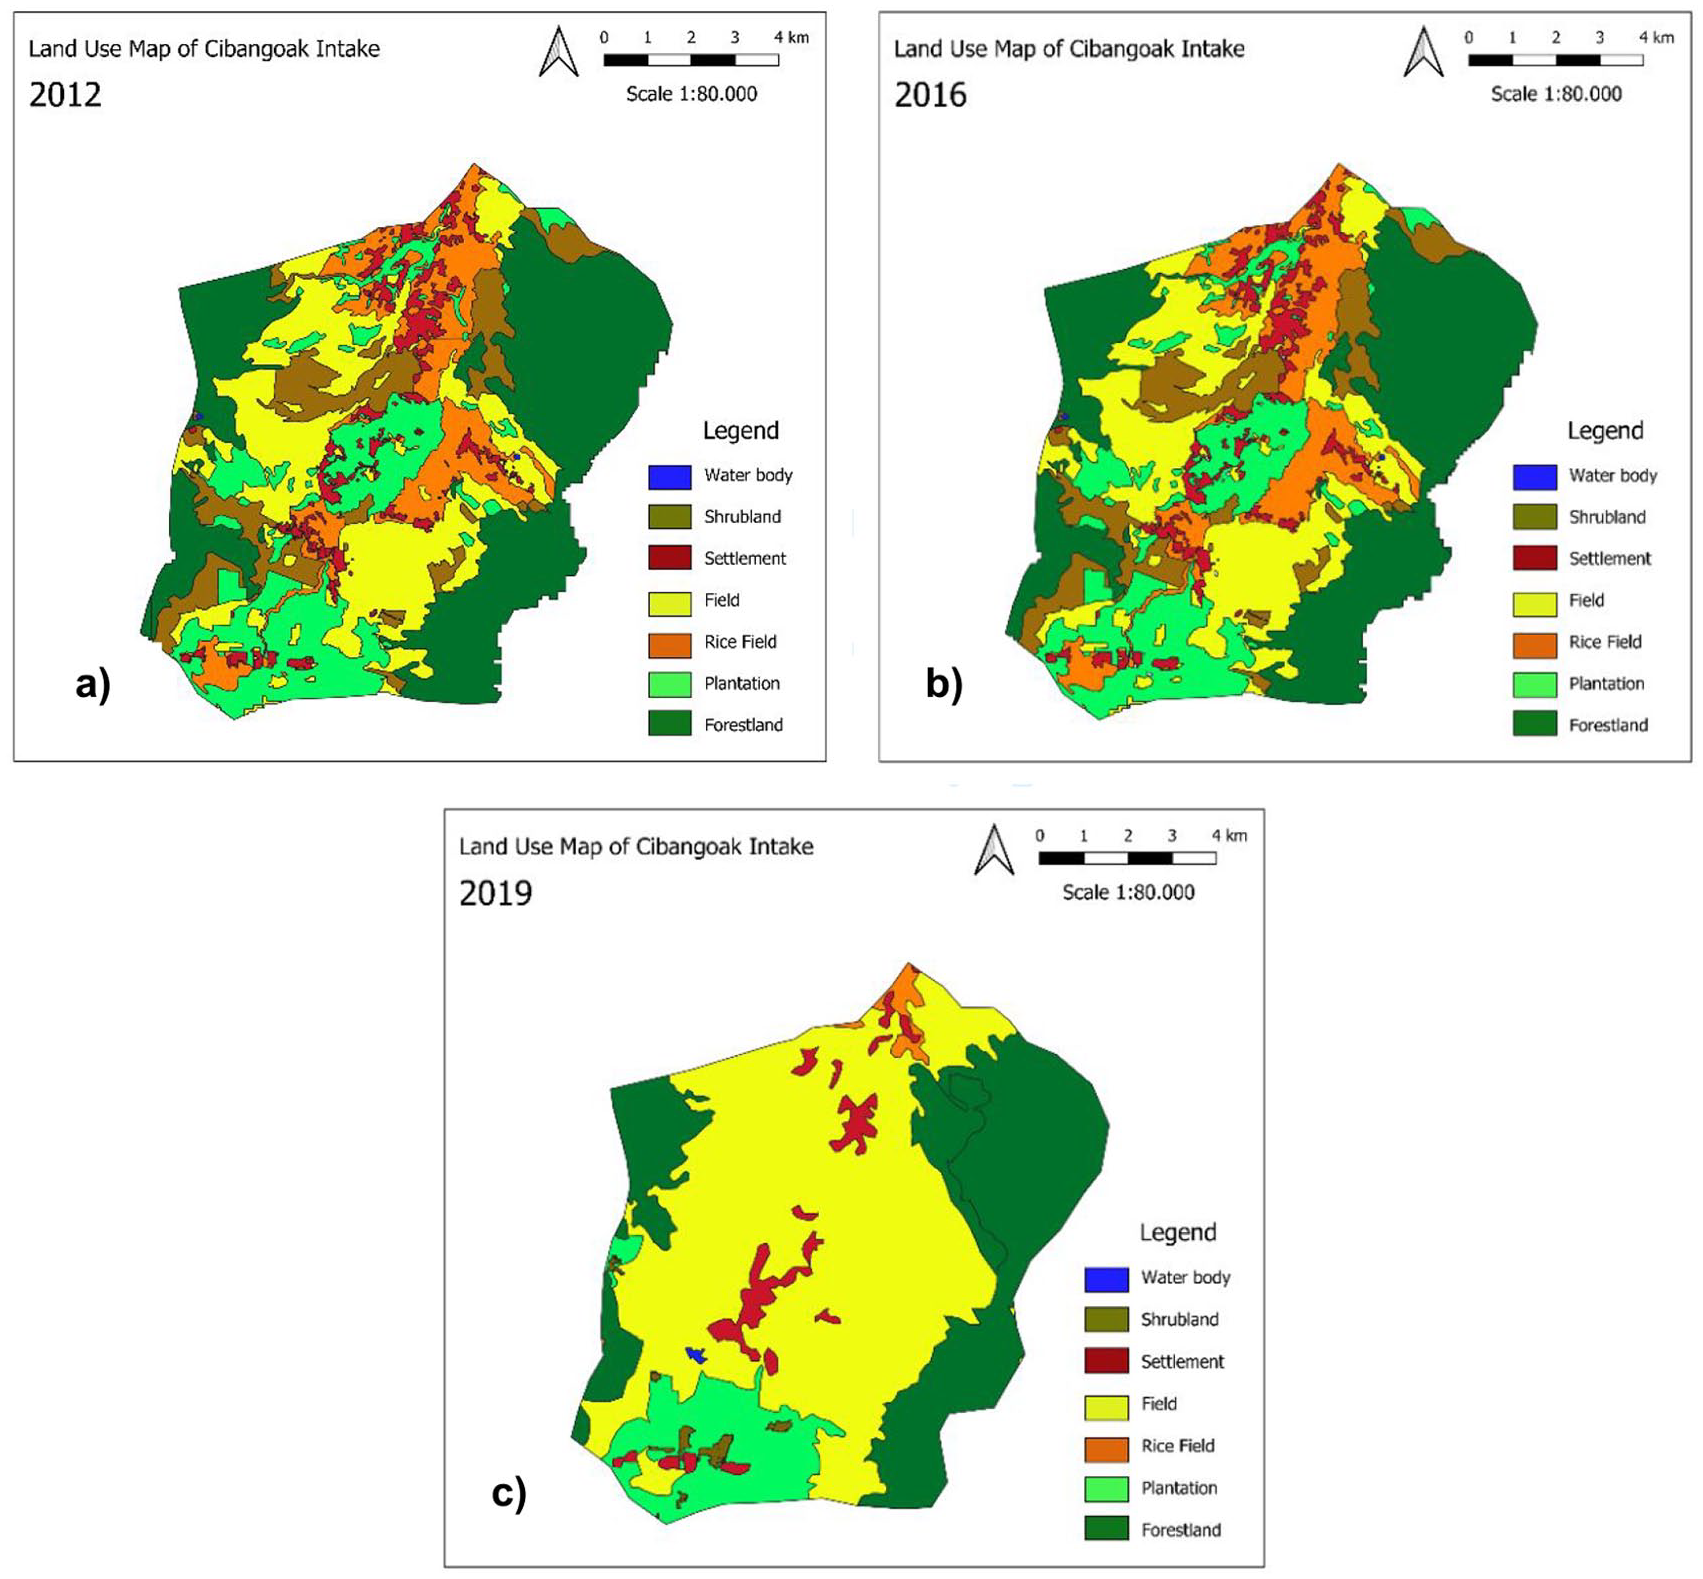
Land use map of Cibangoak Intake in a) 2012; b) 2016; and c) 2019 (Source: Data processing, 2024).
Correlation Analysis of Rainfall and Temperature With Discharge
Rainfall is one of the main factors influencing the hydrological cycle and directly affects river discharge. Climate change causes significant fluctuations in rainfall and temperature, which directly impact various environmental aspects. Table 10 presents the results of the correlation test between rainfall and temperature with discharge.
Results of Correlation Test Between Rainfall and Temperature With Discharge at Cibangoak Intake.

Significant at the 10% significance level.
Based on the correlation test results in Table 10 above, there is a strong and significant relationship between rainfall and discharge during the wet season, as well as with minimum discharge. This means that the higher the rainfall during the wet season, the higher the river discharge will be. This is consistent with the results of the rainfall trend test, which shows an increase in rainfall during the wet season.
This increase in rainfall and discharge has an impact on the increasing minimum discharge, as shown by the minimum discharge trend test results. Rainfall influences the fluctuations in discharge more than the land cover variables in a watershed (Mudiyarso & Kurnianto, 2007; Sutrisno et al., 2019). According to the disaster data from Local Public Water Supply Tirta Raharja, there has been no drought disaster at the study location, but there have been flood events that disrupt the PDAM operations. This data is consistent with the statistical test results that indicate an increase in rainfall during the wet season, leading to higher discharge and causing flooding events. Increased rainfall tends to raise river discharge, which contributes to an increased risk of flooding (Pradesi et al., 2023).
The correlation test results between maximum temperature and discharge show a significant relationship between the maximum temperature variable and the minimum discharge variable. This means that an increase in maximum temperature can lower the minimum discharge of raw water, and vice versa. This result is supported by research from Somura et al. (2009) in Y. Li et al. (2011), which shows a negative correlation between discharge and temperature, specifically the average annual discharge declining due to rising temperatures in Japan. However, in the study location, there is a trend of increasing minimum discharge due to climate change, indicating that drought has not occurred in the study location. Additionally, there is a very strong but insignificant negative correlation between the maximum temperature variable and rainfall during the dry season. This means that an increase in maximum temperature may reduce the rainfall intensity during the dry season and vice versa.
The correlation test results between minimum temperature and discharge and rainfall do not show a significant relationship. However, there is a positive correlation between temperature, discharge, and rainfall. This means that as the minimum temperature increases, both rainfall and discharge will also increase, and vice versa. This result is supported by the study of Alobid et al. (2024), which discusses the trends and causes of flooding events in Germany based on rainfall, temperature, and river discharge variables. The study found a positive correlation between temperature and flooding events, where higher temperatures increase the atmosphere’s moisture-holding capacity, leading to more intense rainfall and increasing flood risk.
Based on the projected rainfall and temperature in the Cirasea Watershed for the years 2025 to 2045, as previously explained, there will be a decrease in maximum temperature and an increase in rainfall intensity during the dry season. This indicates that the intensity of rainfall will continue to increase at the study location, meaning Local Public Water Supply Tirta Raharja will not experience vulnerability regarding the quantity of raw water for processing.
Analysis of the Correlation Between Rainfall and Temperature on Water Quality
Rainfall and temperature play a significant role in determining water quality as they influence various physical, chemical, and biological processes in aquatic ecosystems. Table 11 below presents the results of the correlation test between rainfall and temperature with water quality parameters during the wet season.
Correlation Test Results of Rainfall and Temperature on Raw Water Quality of Cibangoak Intake During the Wet Season.

Significant at the 10% significance level.
The correlation test results in Table 11 indicate a strong, significant positive relationship between rainfall during the wet season and the BOD and Fecal coliform parameters. Similar findings were reported by Momou et al. (2017), who identified a strong positive correlation (r = .636) between rainfall and BOD in a German lagoon. Likewise, Powers et al. (2020) observed that rainfall directly influences an increase in enterococcus concentrations, a gram-positive bacterium known as a natural pathogen.
A very strong and significant negative correlation was found between the minimum temperature and TSS during the wet season. The declining trend in minimum temperature during this period suggests that lower temperatures correspond with higher TSS concentrations in the water.
However, rainfall does not significantly correlate with TSS and turbidity. The correlation coefficient for TSS shows a weak negative relationship with rainfall, whereas turbidity has a weak positive correlation. Ariebowo et al. (2020) also reported a low correlation between discharge, rainfall, and sediment with TSS (ranging from .11 to .31). These findings contradict with disaster records, which indicate that TSS and turbidity levels in raw water are elevated during the wet season, often disrupting PDAM operations. The discrepancy may stem from a limited sample size or the influence of additional factors on TSS, such as domestic, agricultural, industrial, and livestock waste (Sutamihardja et al., 2018; Yudo & Said, 2018).
Additionally, the positive correlation between DO and rainfall is also influenced by the season. The increased rainfall during the wet season helps raise the DO concentration. Cloudy weather during the rainy season reduces sunlight, air temperature, and water temperature (Wiranegara et al., 2023). Generally, oxygen from the atmosphere is more easily absorbed by cooler water, thereby increasing DO levels (Magyar et al., 2013).
In the wet season, high rainfall affects the raw water quality of Local Public Water Supply Tirta Raharja. Furthermore, agricultural, settlement, and livestock activities in the upper Citarum area are other factors that influence TSS, Turbidity, Nutrients (Nitrites), DO, BOD, COD, and Fecal coliform concentrations in the raw water.
The correlation test results in Table 12 indicate a strong and significant positive relationship between rainfall and Fecal coliform concentration during the dry season. This suggests that an increase in rainfall corresponds with higher Fecal coliform levels in the water body and vice versa. However, trend analysis revealed no significant changes in rainfall or Fecal coliform concentration during this period.
Correlation Test Results of Rainfall and Temperature on Cibangoak Intake Water Quality During the Dry Season.

Significant at the 10% significance level
Nitrite concentration in water exhibits a negative correlation with rainfall intensity in the dry season. The highest levels of Nitrogen (N) and Phosphorus (P) occur during this period, whereas their lowest concentrations are observed in the rainy season due to the strong influence of water discharge (Suteja & Purwiyanto, 2018). Increased discharge during the wet season, along with agricultural activities, can elevate nutrient levels in water bodies (Wiranegara et al., 2023). Additionally, lower rainfall intensity during the dry season reduces river discharge, impacting the solubility and dilution of chemical compounds in the water. A decrease in river flow reduces its capacity to transport materials, leading to a longer retention time and lower dilution volume, ultimately increasing compound concentrations in the water (Torres-Ramírez et al., 2024; Whitehead et al., 2009).
At the study location, both minimum and overall discharge levels have risen during the dry season, whereas rainfall patterns show no clear trend. This suggests that the increase in Nitrite concentration at the Cibangoak Intake site is not solely influenced by rainfall but also by land cover, topography, and human activities in the surrounding area. The Upper Citarum watershed is predominantly used for agriculture and settlements (Chaidar et al., 2017), and agricultural practices significantly affect nutrient levels in water bodies (Tromboni et al., 2021).
The rise in dissolved oxygen (DO) concentration during the dry season is attributed to the increased discharge rate, as faster-flowing (turbulent) water enhances oxygen absorption from the air (Dou et al., 2019). Meanwhile, the reduction in BOD levels during the dry season is due to lower rainfall intensity, which decreases the influx of organic matter into the water body via runoff.
The positive correlation between TSS and Turbidity with rainfall during the dry season contradict with the ideal conditions. TSS and Turbidity concentrations are generally lower in the dry season compared to the wet season since high rainfall facilitates the transport of solid particles into rivers and reservoirs, thereby increasing TSS levels (Castilla-Hernández et al., 2014). Conversely, reduced rainfall in the dry season limits this process, resulting in lower TSS concentrations (Nichols, 2009).
Mosley (2015) found that surface water quality tends to deteriorate in the dry season, though the extent of this impact depends on factors such as the type of water body, its shape, size, depth, water regime, and retention time (Delpla et al., 2009; S. Li et al., 2017; Torres-Ramírez et al., 2024; Van Vliet & Zwolsman, 2008). Consequently, the effects of the dry season on water quality vary both spatially and temporally (Torres-Ramírez et al., 2024).
During the dry season, high solar radiation and low rainfall affect the raw water quality of Local Public Water Supply Tirta Raharja. Additionally, agricultural, settlement, and livestock activities in the Upper Citarum area are other factors that influence TSS, Turbidity, Nutrients (Nitrites), DO, BOD, COD, and Fecal coliform concentrations in the raw water.
Correlation Analysis of Land Use on Water Quality
The Cirasea Watershed (DAS) is part of the upper region of the Citarum Sub-Watershed. Based on the 2019 land cover analysis, the Cirasea Watershed is dominated by agriculture (42.8%), rice fields (23.22%), forests (18.77%), and settlements (10.54%). It is important to understand the impact of land use variables, especially in areas around the Cibangoak Intake, on water quality when formulating appropriate water resource management strategies. Table 13 presents the correlation test results between land use at the Cibangoak Intake site and raw water quality.
Correlation Test Results of Land Use on Raw Water Quality of Cibangoak Intake.
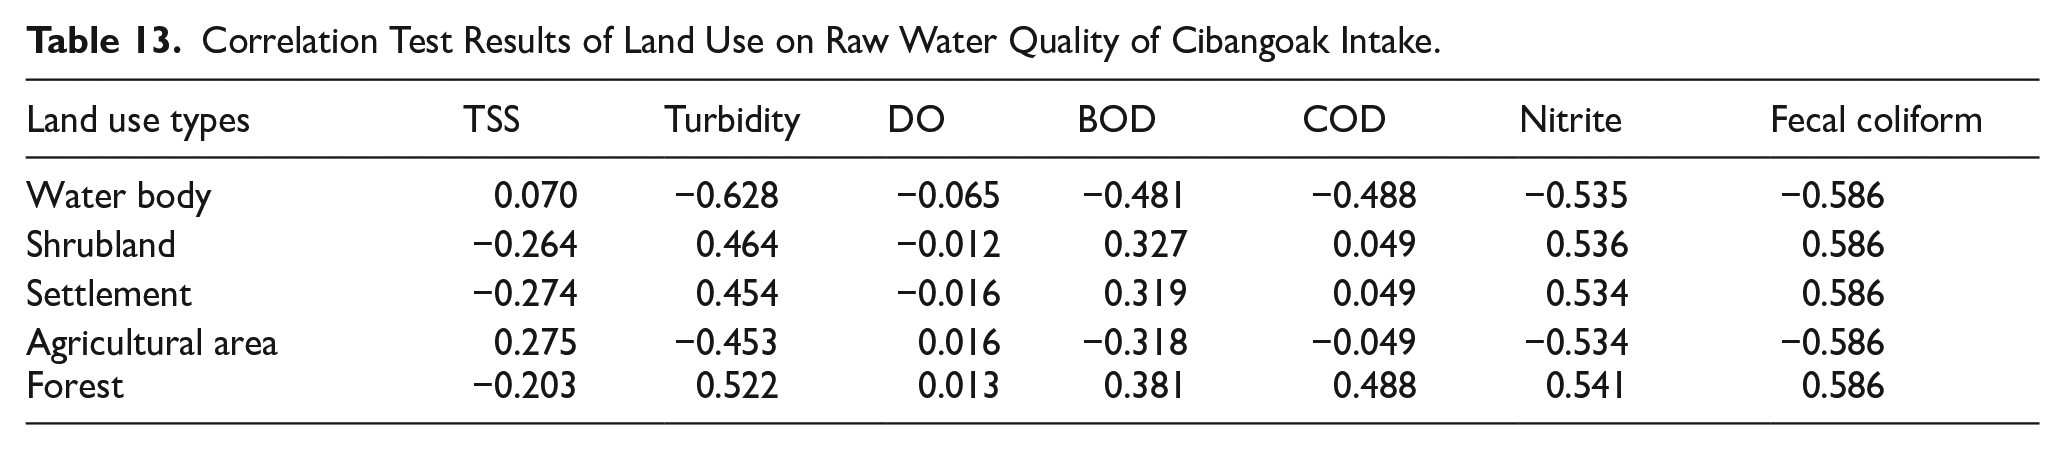
The correlation test in Table 13 shows no significant relationship between land use and water quality at the Cibangoak Intake site. However, agricultural land has a weak positive correlation with TSS (0.275), similar to findings by Ghalib et al. (2022), who reported a strong correlation between dryland agriculture and TSS in Bima Bay. In contrast, shrubland showed a negative correlation with TSS. This means that the larger the agricultural area, the higher the TSS levels in raw water, as rain runoff carries sediment from agricultural land. Land-use changes from forests or natural vegetation to agricultural areas can increase erosion and sedimentation, leading to higher TSS concentrations in water bodies.
Forests and shrubland positively correlate with turbidity, contradicting previous studies, such as Abidin et al. (2019), which found lower turbidity in forest-dominated areas. This inconsistency may be due to differences in land use data resolution. Settlements show a positive but weak correlation with BOD, aligning with research that links built-up areas to increased runoff, erosion, and pollution (Lin et al., 2020). Higher anthropogenic activities contribute to domestic waste, elevating BOD levels.
Forests and shrubland also show a positive correlation with BOD, as observed by Raziq (2019). Brontowiyono et al. (2022) found a significant correlation between BOD and vegetated land (.886) and a strong negative correlation with built-up areas (−.936) in the Opak Watershed. The link between vegetation and BOD likely stems from organic waste degradation (Brontowiyono et al., 2022).
Agriculture, water bodies, and forests negatively correlate with COD, whereas open land and built-up areas show a positive relationship (Effendi et al., 2018). Differences in sample size (n < 30) and land use data resolution may explain inconsistencies in correlation results.
There is no significant correlation between land use and Nitrite concentration. Forest vegetation helps absorb nutrients, reducing phosphorus and nitrogen in watersheds (Cheng et al., 2022). However, agricultural expansion increases sediment, dissolved organic material, and nutrients (Ni et al., 2021). Fertilizer runoff contributes to nitrogen transformations in water bodies (Camara et al., 2019; Jaworski et al., 1992; Lin et al., 2020). Contradicting this, Table 13 shows a positive correlation between forests and Nitrite, and a negative correlation with agriculture, implying that increased forest cover may raise Nitrite levels.
Between 2012 and 2019, forest area in the Cirasea Watershed increased, but Fadhil et al. (2021) reported a decline (−5.5%) in the Upper Citarum Watershed from 2009 to 2018. Differences in data sources and land use maps may contribute to inconsistencies in findings. Forest expansion in the study area may result from rehabilitation efforts, such as tree planting, which can influence Nitrite levels as plants require nitrogen for growth (Sulistyono & Nur, 2024).
Settlements have a strong but insignificant positive correlation with Fecal coliform, as domestic wastewater discharge increases bacterial contamination. Proper land management is essential to maintaining ecosystem balance, reducing runoff, and ensuring raw water quality.
Land use changes, such as deforestation and urbanization, affect water resources, highlighting the need for sustainable management strategies.Land use impacts both the quantity and quality of raw water, where changes in land use, such as converting forests into agricultural land or settlements, can affect the hydrological cycle and increase pollution. Proper land management can maintain ecosystem balance, reduce runoff, and increase water infiltration, thus contributing to the availability of quality raw water. Understanding the relationship between land use and raw water conditions is crucial for sustainable water resource management.
Linear Regression Analysis
Regression analysis is a technique used to understand how independent variables affect or relate to dependent variables, and to make predictions based on these relationships. Table 14 present the regression model results between climate change variables and land use on flow and raw water quality.
Multiple Linear Regression Model for Climate Change and Land Use Variables.

The Impact of Climate Change and Land Use on Raw Water Availability at Cibangoak Intake
Temperature is a crucial parameter indicating climate change, influencing the hydrological cycle. During the dry season, a negative correlation exists between maximum temperature and rainfall—higher temperatures reduce humidity, which lowers rainfall probability (Arpan et al., 2004). This suggests that an increase in maximum temperature leads to decreased rainfall at the study site, and vice versa.
A strong negative correlation (r = .9) between maximum temperature and minimum flow indicates that higher temperatures reduce water availability. Future projections (2025–2045) suggest a decrease in maximum temperature and increased dry-season rainfall, reinforcing the impact of temperature on rainfall and flow patterns. Conversely, minimum temperature shows a positive but insignificant correlation with rainfall and flow, aligning with Fenta et al. (2023), who found a significant positive correlation (.36) between minimum temperature and rainfall and a negative correlation (−.58) between maximum temperature and rainfall in Ethiopia.
Trend tests reveal increasing rainfall during the wet season and annually, significantly correlating with higher wet-season flow. This trend suggests a wetter climate, ensuring sufficient raw water for Local Public Water Supply Tirta Raharja, meeting the Ciparay SPAM service area’s drinking water needs.
However, this surplus raw water condition poses a destructive threat to the operation of the Ciparay SPAM Local Public Water Supply Tirta Raharja, particularly to the structural integrity of the Cibangoak Intake weir. High water flow can carry various materials such as trees, rocks, and waste into the water body. The topographical conditions of the study site, which consist of hills and mountains, combined with land conversion in the Upper Citarum area, can increase runoff coefficients, leading to flooding. Based on the correlation test results between land use factors and flow, the agricultural area is positively correlated with increased flow. This means that increased agricultural activity in the Upper Citarum region contributes to higher runoff flow.
The Impact of Climate Change and Land Use on Raw Water Quality at Cibangoak Intake
Climate change, indicated by temperature variations, influences water quality both directly and indirectly by affecting rainfall, flow, and overall water conditions. Previous correlation test results confirmed a link between temperature and rainfall, where increased wet-season rainfall, combined with land use changes, raises maximum flow. A strong and significant positive correlation (r = .9) exists between maximum flow and turbidity, meaning higher rainfall leads to increased turbidity levels.
Rainfall itself does not directly impact turbidity but does so by increasing maximum flow during the wet season. This finding aligns with disaster records and observations at the Cibangoak Intake, where turbidity spikes during flash floods force temporary shutdowns of water treatment plants due to excessive turbidity levels. Consequently, Local Public Water Supply Tirta Raharja main vulnerability lies in maintaining water quality, particularly turbidity, during the rainy season.
The TSS parameter shows a strong, significant negative correlation with minimum temperature, indicating that minimum temperature directly influences TSS concentration. Among land use variables, agriculture has the highest positive correlation with TSS (r = .275), though it is not significant. Regression analysis suggests that 44.5% of TSS levels are influenced by water body and forest variables, while the remaining 55.5% is attributed to other factors, such as soil type and slope, which were not considered in this study.
Dissolved oxygen (DO) exhibits a weak, insignificant positive correlation with rainfall and temperature. Similarly, the forest variable has a negligible correlation (r = .013) with DO, indicating that increased rainfall and temperature may slightly enhance DO levels, which can benefit aquatic ecosystems.
During the wet season, rainfall shows a strong, significant positive correlation with BOD and Fecal coliform, while maximum flow is positively correlated with Fecal coliform. Increased land conversion into settlements also correlates positively with higher BOD (r = .319) and Fecal coliform (r = .586) levels. This indicates the potential contamination of raw water sources, posing a threat to both public health and animals that rely on the water. The presence of Fecal coliformform, a group of pathogenic bacteria, serves as an indicator of fecal contamination, which carries significant health risks. These pathogen bacteria can cause various waterborne diseases, including diarrhea, cholera, and giardiasis (Gu et al., 2023; Saxena, 2025). Such infections can have severe consequences, particularly for vulnerable populations such as children, the elderly, and individuals with weakened immune systems.
In the dry season, rainfall maintains a strong positive correlation with Fecal coliform, while maximum temperature exhibits a weak but significant positive correlation, suggesting both factors contribute to variations in Fecal coliform concentrations. Additionally, settlement areas show a positive correlation with BOD, COD, and Fecal coliform.
Overall, correlation tests indicate that both wet- and dry-season rainfall and temperature are positively associated with BOD, COD, and Fecal coliform. This highlights that water quality deterioration is not solely influenced by climate change and land use but also by external factors such as topography and pollutant loads, which were beyond the scope of this study.
Strategic Recommendations
Climate change has a significant impact on water quality, primarily due to increased rainfall intensity, rising temperatures, and more frequent natural disasters. Floods can contaminate water treatment facilities, while droughts can degrade groundwater quality (Coffey et al., 2014; Parkinson et al., 2021; Tung et al., 2012). Additionally, land-use changes such as deforestation and urbanization exacerbate these issues by increasing pollution risks. The study results indicate an increase in rainfall, particularly during the wet season, which leads to a rise in peak discharge and has a positive correlation with raw water turbidity levels. Therefore, it can be concluded that Cibangoak Intake is expected to face water quality challenges, emphasizing the need for mitigation and adaptation strategies that integrate land-use management. Several key strategies can be implemented, including:
a. Policy and Regulatory Framework: Strengthening regulations, such as stricter permitting processes (Bartlett & Dedekorkut-Howes, 2023; De Smedt 2010; Garnier & Holman 2019; Palmer et al., 2009), integrating water resource management policies, and enforcing waste control measures. A multi-stakeholder approach is essential for effective water management, including optimizing collaboration between Tirta Raharja Company and MoEF (The Ministry of Environment and Forestry) in monitoring water quality through Onlimo Cibangoak (online monitoring tools for measuring water quality by real time at Cibangoak location). Additionally, conservation efforts such as reforestation and buffer zone implementation around the Upper Citarum River Basin are crucial for reducing water pollution.
b. Sustainable Agriculture Practices: Since the Cibangoak Intake area is predominantly used for agriculture, adopting environmentally friendly practices such as agroforestry systems, organic fertilizers, crop rotation, and natural pest control can help reduce soil erosion and water pollution (Bartlett & Dedekorkut-Howes, 2023; Nunes et al., 2017; Mehdi et al., 2015).
c. Enhancing Water Treatment Capacity: During the rainy season, water turbidity increases significantly. To address this, expanding pre-sedimentation basin capacity is necessary to reduce the treatment load at the Cikoneng Water Treatment Plant (IPA Cikoneng).
d. Nature-Based Infrastructure: Implementing nature-based solutions, such as riparian buffers, wetland restoration, and reforestation, can help mitigate water pollution and counteract climate change impacts (Ha & Wu, 2017; Khaniya et al., 2021; Lukasiewicz et al., 2016; Salila et al., 2020; Wu et al., 2021).
e. Community Education and Awareness: The Citarum Harum program should enhance public awareness regarding climate change impacts, waste management, and the importance of river basin conservation. Encouraging community involvement in river rehabilitation efforts will contribute to improving water quality in the Citarum River.
f. Implementation of Digital Twin Approach: This approach offers an innovative solution for raw water quality management. A digital twin is a virtual representation of a physical system that enables real-time monitoring, simulation, and prediction through the integration of historical data and real-time sensor inputs (Hamzah et al., 2024). Incorporating a digital twin could enhance existing monitoring systems such as Onlimo Cibangoak by combining climate, water quality, and hydrological data to anticipate extreme variations driven by climate change and land use conversion. This technology would enable the regional water utility to adopt predictive, data-driven operational planning—such as dynamically adjusting pre-sedimentation basin capacity or coagulant dosage—thereby improving the efficiency and resilience of water treatment processes against seasonal water quality fluctuations.
The integration of these strategies, along with efforts to reduce greenhouse gas emissions (Baker et al., 2012) and protect water treatment infrastructure from disasters (Levine et al., 2016), will enhance water ecosystem resilience against climate change and land-use changes.
Study Limitations
This study highlights the relationship and impact of climate and land-use changes on water availability and quality, along with necessary adaptation and mitigation strategies. However, several limitations must be considered. One key challenge is data inconsistency, as rainfall, temperature, discharge, and water quality data at Cibangoak Intake are not collected systematically over the same period or in sufficient quantity. Additionally, missing or incomplete data due to the absence of monitoring and measurements at certain points and time periods further affect the reliability of statistical analyses. To address this, the author applied methods such as interpolation and data approximation using the nearest available monitoring points. However, these adjustments may influence the accuracy of the results obtained, potentially introducing uncertainties in trend analysis and correlation assessments.
Another limitation is the reliance on historical data, which provides insights into past trends but is insufficient for predicting future impacts comprehensively. To address this, future studies should incorporate numerical modeling techniques, such as hydrological simulations and climate change scenario analysis. These methods can offer a more detailed projection of climate and land-use change impacts on raw water sources, supporting the development of more effective long-term adaptation strategies.
Further research should explore the integration of advanced remote sensing and machine learning techniques for continuous water quality monitoring and predictive modeling. Remote sensing can provide large-scale spatial and temporal data, while machine learning can analyze trends, detect anomalies, and improve predictions. Additionally, interdisciplinary studies assessing the combined effects of climate change, land-use changes, and socio-economic factors on water resources will provide a more comprehensive understanding of water security challenges. These approaches will strengthen data-driven decision-making and enhance water management resilience in the face of environmental uncertainties.
Conclusion
There is a trend of increasing rainfall during the wet season and a decrease in minimum temperature at the study location because of climate change. However, based on the climate scenario projections for 2025 to 2045, it is expected that rainfall will increase, especially during the dry months, while maximum temperatures will decrease, and minimum temperatures will increase. The discrepancy between the observed trend test results and climate scenario projections for rainfall and temperature parameters is likely attributed to the relatively short dataset available (<30 years). This limitation constrains the ability of climate models and statistical analyses to capture long-term trends with high accuracy, leading to potential uncertainties in climate impact assessments.
A strong positive correlation exists between rainfall and river discharge, suggesting that increased rainfall could reduce drought risks but also exacerbate erosion and sedimentation due to land-use changes, particularly in the Upper Citarum region. Regarding water quality, higher rainfall is linked to increased organic and microbial contamination, while lower temperatures correlate with reduced sediment levels. During the dry season, both rainfall and maximum temperature contribute to microbial contamination, and increased wet-season rainfall may elevate turbidity at Cibangoak Intake, challenging water treatment processes.
The analysis of land-use variables and their correlation with raw water quality parameters yielded mixed results, with some findings deviating from expected patterns. This inconsistency may be attributed to several factors, including data limitations (n < 30), inconsistencies in land-use classification, and the influence of external environmental variables that were not fully accounted for in the study. These uncertainties highlight the complexity of interactions between climate change, land-use dynamics, and water quality, underscoring the need for further research with a more extensive dataset and refined analytical approaches.
Given these findings, Cibangoak Intake is anticipated to face increasing water quality challenges due to the combined effects of climate change and land-use modifications. Addressing these impacts requires comprehensive mitigation and adaptation strategies, including strengthening regulations, promoting sustainable agriculture, enhancing water treatment capacity, implementing nature-based solutions (e.g. wetland restoration and reforestation), and increasing community awareness through the Citarum Harum program. Further research with an expanded dataset and more comprehensive analytical approaches is needed to clarify the relationships between climate change, land use, and raw water quality at the study site and to support more effective water resource management policies.
Footnotes
Acknowledgements
The preprint of this manuscript is available on SSRN: https://papers.ssrn.com/sol3/papers.cfm?abstract_id=5023412. This paper is part of the corresponding author’s Master’s thesis and a research project conducted in collaboration with the Rucika Institute, Indonesia. The author would like to express sincere gratitude to the Tirta Raharja Local Public Water Supply Company for their willingness to serve as the study’s research object and for sharing valuable data for this research. The research is funded by a grant from the Ministry of Research, Technology, and Higher Education of the Republic of Indonesia.
Author Contributions
AW has made considerable contributions in designing the study, data collection, analysis, interpretation, and manuscript writing; MM has made a significant contribution in supervising, commenting, suggesting ideas, and reviewing the manuscript; ER, AK, and EB have made a significant contribution in providing data and supervising. All authors read and approved the final manuscript.
Funding
The author(s) disclosed receipt of the following financial support for the research, authorship, and/or publication of this article: The research is funded by a grant from the Ministry of Research, Technology, and Higher Education of the Republic of Indonesia.
Declaration of Conflicting Interests
The author(s) declared no potential conflicts of interest with respect to the research, authorship, and/or publication of this article.
Data Availability Statement
All data will be made available when requested.