
Abstract
Climate and LULC changes can affect runoff. Water stress is a major problem in Ethiopia’s upper and lower parts of the Jewuha watershed. This study aimed to examine the long-term patterns of freshwater availability in the study area under climate and LULC changes by analyzing long-term climate data using SWAT models. The SWAT model was used to simulate the runoff data. Calibrating and validating SWAT results were done by selecting sensitive parameters in the watershed. The LULC change predicted for 2045, a climate change analysis of the years 1984 to 2015 is conducted. The result of the study showed that surface runoff increased by 30.34 m3/s in 2015 as compared with 1984 mainly due to the impact of LULC change. Additionally, climate change’s impacts on the runoff increased by 16.1 m3/s in 2015 compared to 1984. The LULC classes, including vegetation cover (Forest and shrubland), experienced a shift from 35.94% in 1984 to 27.32% in 2015. The agricultural sector, which was 38.01% in 1984, has changed to 50.43% in 2015. The prediction values of agriculture and grassland are 52.29% and 24.193% respectively. At the same time, the prediction value of shrubland decreased to 14.186% in 2045. In general, the hydrology of the Jewha watershed is influenced by LULC and climatic variability in a significant and combined way.
Introduction
Water resources are most dominantly affected by climate and change in land use and land cover (LULC). Recent developments in sub-Saharan Africa (SSA) have shown an increasing trend of conversions of natural land cover into arable land (Kumar, 2012). Drivers of changes are manifold and can be directly linked to human activities such as population growth, economic development, and globalization (Marchant et al., 2018).
Tropical regions have experienced the fastest LULC Change in the last decades, coupled with climate change (CC) affected river systems; and geomorphological processes. With the increased demand for land, the general trend has been the loss of forest land to agriculture and settlements. These changes have altered the water balance components through enhanced or reduced evaporation, peak flow, flooding, sediment transport, and river morphology (Kayitesi et al., 2022). Hydrological response to changes in land use and land cover (LULC) and climate change is an important area of research in hydrology and environmental science. These determinants have the potential to significantly affect the hydrological cycle, thereby affecting critical areas such as surface runoff, groundwater recharge, sedimentation, and river flow (Dibaba et al., 2020; Kuma et al., 2021).
Hence, climate change is a challenge to the environment in the 21st century. In addition to being primarily detrimental, climate change, and natural climate variability frequently worsen other environmental issues, such as ecosystem degradation, biodiversity loss, and air and land pollution (Malhi et al., 2020). Long-term impacts of climate change, according to literature (Bolan et al., 2024; Squillacioti et al., 2024; Wilkinson et al., 2024), will include a rise in heat waves and intense precipitation, a decline in sea ice and an increase in permafrost thawing, and a reduction in water supplies in semi-arid areas. Africa: It is estimated that between 75 and 250 million people will experience increasing water stress; in certain areas, yields from rain-fed agriculture might be cut by up to 50%; and agricultural production, which includes food access, could be seriously jeopardized (Syamsuri et al., 2019).
Because of human-caused greenhouse gas (GHG) emissions, there has been an increase in land cover and climate change, and this trend is expected to continue unless something is done to stop it. Because it jeopardizes water supplies and food production, and destabilizes the most impacted communities, making climate change a security issue. Several factors related to climate change have an impact on health, including changing coasts, increased temperatures, and variations in precipitation. This variability may increase productivity in temperate regions (Lyakurwa, 2008).
The general aim of this study was to examine long-term patterns of freshwater availability in the Jewha watershed under climate and LULC changes by analyzing long-term temperature and rainfall data using SWAT models. Specifically; to assess the status and trends of climate variability in the Jewha watershed, to compare the effect of LULC and climate changes on water availability.
However, the change has an adverse impact in tropical regions like Ethiopia since it is found in the tropics, where climate variability is a major problem, for its rainfed agriculture. Variability differs from location to location due to overall circulation and different topographical features. This study investigated the climate change impact at diverse agro-climatic zones of the Jewha watershed (part of the lower awash basin) which is the cause of flood threats and irrigation water scares for the area.
Therefore, there should be measures to adapt to climate variability at the local level. However, there was a limitation of the evidence of what was going on at the local scale due to the complexity of the environmental process.
Climate change impacts should include LULC (Cullingworth & Nadin, 2020), which may interact with the climate system. Changes in LULC types were correlated with the water balance components (Besha et al., 2024). Increasing water demand follows population growth, economic development, and changing consumption patterns. Global water demand has increased by 600% over the past 100 years (Boretti & Rosa, 2019). Due to this, agricultural expansion with rapid population growth in Ethiopia is one cause of environmental degradation (Wassie, 2020). This population growth leads to a high demand for water, but the water resource is also affected by both climate and land use changes (Okello et al., 2015). In the Jewha watershed, known for high climate variability involving droughts and floods, climate variability is likely to intensify the existing challenges. Hydrological models are the principal tools used to explore the potential impact of climate change on water resources (Zhao et al., 2018). To quantify the potential impact of climate change, the SWAT model has been used. This tool was selected based on its performance in the simulation of changes (like, climate and land use) at the watershed level (Wu et al., 2015; Zhang et al., 2015).
Materials and Methods
Study area
Jewha watershed is a rift valley escarpment of the lower Awash Basin with altitude ranges of 1,118 to 3,200 m.a.sl. Geographically it is located at 11°55′N latitude and 37°20′E longitude (Figure 1) and has an average annual rainfall of 1,007 mm, and yearly mean minimum and maximum temperatures of 16.5°C and 31°C, respectively. The agro-ecology of the watershed is characterized by a lowland or “Kola” (<1,500 m), midland or “Weyna Dega” (1,500–2,500 m), and highland or “Dega” (2,500–3,000 m), and Cold highland “Wurch” (>3,000 m; Toma et al., 2017). The slope gradient ranges between 0 to 10, 10 to 15, 15 to 30, and 30 to 99 are 21.15, 6.35, 19.89, and 52.60, respectively. The soil type of the area is Vertisols (VR), Leptosols (LP), and Cambisols (CM) with percentages of 9.16, 24.35, and 66.49, respectively.

Map of Jewha watershed (the Study Area).
Climate
The study area is getting a bimodal distribution type of rainfall. The major rainfall is in June, July, and August.
The miner rainfall is from February to April (Figure 2).

The average monthly rainfall and runoff distribution of the Jewha watershed.
The district’s population estimated to 130,183.59 based on increase rate of 9.97% over the 1994 census in 2007 estimated in 2017. Kewet district has a population density of 150.64, greater than the Zone average of 115.3 persons per square kilometer.
Approach and methodology
Methodological flow chart
Model selection
The SWAT model is an open-source model with a wide and rising number of model applications crossing from watershed to mainland aspects. The model isolated the watershed into different sub-watersheds and further divided into hydrological reaction units (HRUs) with similar land use management, slope, and soil characteristics. HRUs are the fundamental units of the watershed where significant hydrologic parts, including evapotranspiration, surface run-off, peak rate of run-off, groundwater flow, and sediment yield may be calculated (Mustefa Abdule et al., 2023).
To investigate the impact of climate change and land use/cover change on hydrology and water resources, hydrological modeling techniques are currently the most widely used, and these methods can be mainly divided into three categories: statistical models, conceptual hydrological models, and distributed hydrological models.
Distributed hydrological models; such as the SWAT model, TOPMODEL model, and VIC models, are large-scale basin models that have been widely used recently. As a typical distributed hydrological model, the SWAT model is globally used because the input variables can be easily obtained, it has high computational efficiency, it provides long-term watershed simulation, and it is open-sourced (Liu et al., 2017).
Data sources
Meteorological data were used to simulate hydrologic processes within SWAT. It is challenging to obtain high-quality meteorological data for this type of watershed. The study was done based on meteorological data from global climate sources. Such data may replace observational data or sources available in regions where data is scarce for hydrological modeling purposes. Due to the scarcity of measured data near the watershed, weather data were derived from the climate forecast system reanalysis (CFSR). The CFSR data was collected from the SWAT team at the University of Texas (Dhanesh et al., 2020). In SWAT, the study area is divided into sub-basins, and each sub-basin is divided into hydrological response units (HRUs) with homogeneous characteristics (e.g. topography, soil, and land use). SWAT inputs required data for this study, including a numerical elevation model (DEM), soil properties, LULC, meteorological data (WGEN), and runoff data (Jewha gauging station site).
Weather data
The daily data required by the SWAT model were collected from two CFSR stations, including minimum and maximum temperatures, precipitation, wind speed, and relative humidity. This data was interpolated onto the DEM grids using the integrated weather generator of the SWAT model, which describes the weather conditions in the model simulations.
DEM
The United States Geological Survey (USGS) SRTM (Shuttle Radar Terrain Mission) digital elevation model (DEM) with a resolution of 30 m × 30 m is used for this study (Figure 3).

Methodological flow chart.
Soil data
Data on soil properties were obtained from the soil map of Addis Ababa University’s water and land resources. The soil name and magnitude include Vertisols (VR) covers (9.16%), Leptosols (LP) covers (24.35%), and Cambisols (CM) covers (66.49%; Figure 3).
LULC data
LULC data were one input used for impact evaluation for the Soil and Water Assessment tool (SWAT) model. Based on data availability satellite images in 1984, and 2015 were used to evaluate climate and LULC changes. Landsat images with path (168) and row (53) were obtained from the United States Geological Survey (USGS; https://earthexplorer.usgs.gov). Cloud-free satellite images in 1984, and 2015 were taken for LULC classification. The land use was classified into five categories (i.e. Forest, Agriculture, Shrubland, Grassland, and Bare land) using semiautomatic classification method in QGIS version 2.16. The classification were done by performing atmosphere correction of the satellite images and further postprocessing (classification) activities were done.
The LULC prediction was performed using the Modules for Land Use Change Evaluation (MOLUSCE) method in free QGIS software. This model simulates 10-year intervals at a time. Predictions were made in 10-year intervals in 2025, 2035, and 2045 based on 2015.
Surface runoff data
Daily runoff measured at the Jewha gauging station from 1985 to 2005 was collected from the Ethiopian Ministry of Water Energy and Irrigation (MoWEI). This data is used to calibrate and validate the SWAT simulated data using SWAT CUP 2012. The runoff data from 1985 to 1997 was used for calibration and 1998 to 2005 for, validation.
Methods of data analysis
The procedure for estimating the impacts of possible future climate and land use change on hydrological behavior is as follows: (1) Preprocessing of input data, (2) SWAT simulation by using inputs such as; DEM, land use map, soil map, weather parameters input (WGEN), and slope, that derived from the DEM (3) parametrization and sensitivity analysis (4) calibration and validation by using observed river flow.
Sensitivity analysis
Sensitivity analysis was carried out to examine the relative changes in the model output concerning the changes in model input variables. Baseline data was established to determine output variables using the SWAT-CUP model itself. Each variable was varied within the prescribed range keeping others constant. The output values were then analyzed for the variations concerning the base values. From sensitivity analysis, it was possible to determine which variables needed to be precisely estimated to make accurate predictions in the watershed yields. The Hangreaves-Samani method (Aouissi et al., 2016) was used in this study to estimate potential evapotranspiration depending on the availability of the data.
The literature recommended that three quantitative statistics, Nash-Sutcliffe efficiency (NSE), percent bias (PBIAS), and R2, be used in model evaluation (Golmohammadi et al., 2014). Sensitivity analysis was conducted using a Global sensitivity analysis method (van Griensven et al., 2006; Tables 1 and 2).
General Performance Rating for Recommended Statistics for a Monthly Time Step.

SWAT Parameters Sensitivity Ranks According to the Simulated Output.

Scenario generation
To analyze the climate and LULC changes impact on runoff, observed data was used from 1985 to 1997 and 1998 to 2005 for calibration and validation respectively. The effects of LULC and climate changes on surface runoff were evaluated by comparing the SWAT outputs of 12 scenarios. Each scenario represented about one decade, and each simulation required a LULC map and a meteorological data set. If the LULC map and the meteorological data were within the same decade (i.e. the 1984s, 1995s, 2005s, or 2015s), the simulation results would represent real runoff or a baseline affected by the combination of LULC and climate changes. Alternatively, varying one driving factor while holding others constant simulates the effects of the variable factor on runoff (Li et al., 2009).
For this study, to assess the response of stream flow to combined LULC and climate variability in the 1984s and 1995, the simulation of the 1984s (1984–1994) which is used as a reference period or baseline, should be based on the LULC of (1995) and climate years of (1984–1994). The simulation of the 1995s (1995–2004) should be based on the LULC years of (1995) and climate years of (1995–2004). The difference between the first and second simulations represents the combined effects of LULC and climate variability on stream flow. The third simulation of LULC was based on the climate years (1984–1994) and the LULC in the next period, or the LULC (2005). The difference between the first and third simulations is the effect of the LULC change on stream flow. Similarly, the difference between the first simulation and the fourth simulation based on the LULC year (1995) and climate (1995–2004) represents the impact of climate variability on stream flow.
Meteorological data from 1984 to 2015 were selected and split into four periods (i.e. 1984–1994, 1995–2004, and 2005–2015) during which the land use maps represented the land use pattern in 1984, 1995, 2005, and 2015, respectively. However, on a combination of 3 periods of climate data and 4 land use maps, 12 modeling experiments were designed to quantify the contributions of land use and climate variability to hydrological variations in the study periods. Scenarios S1 to S4, S5 to S8, and S9 to S12 represent 1984 to 1994, 1995 to 2004, and 2005 to 2014, respectively.
The above scenarios were for climate variability and LULC change studies. For climate change of the 30 years, the LULC of 1984 and 2015 and climate years (1984–2015) were simulated. Watershed Models are often used to simulate future climate variability. However, literature, for example (Lafon et al., 2012) stated that simulations of temperature and precipitation show significant bias due to systematic model errors or discretization and spatial averaging within grid cells, which hampers the use of simulated climate data as direct input for climate impact analysis. The SDSM model is used to extract and bias-correct data from global and regional climate models, which is highly recommended by the literature (Maraun, 2016; Teutschbein & Seibert, 2012). The derived weather data from climate forecast system reanalysis (CFSR) near the Jewha watershed was used for this study.
Result and Discussion
The results show the impact of climate and LULC changes on surface runoff. Runoff is affected by climate and LULC changes like; agricultural expansion and forest degradation in the study area due to the LULC change. Between 1984 and 2015 the agricultural land was expanded by 12%. The reason for this change is the decrease in vegetation cover, which decreased by 11.3% during the same period. The agricultural land had increased from 38.7% in 1984 to 51.4% in 2015 (Figure 4). LULC change and climate variability problems were known in the study area. The combined effect and individual contribution of climate and LULC change were investigated in the study. The classification of LULC classes in the study area was evaluated in the study periods, in 1984 and 2015. The LULC prediction was made for the next 2045 (Figure 5).

Jewha watershed Digital Elevation Model (a) and Soil map (b) respectively.

The LULC map of the years 1984 and 2015, respectively.
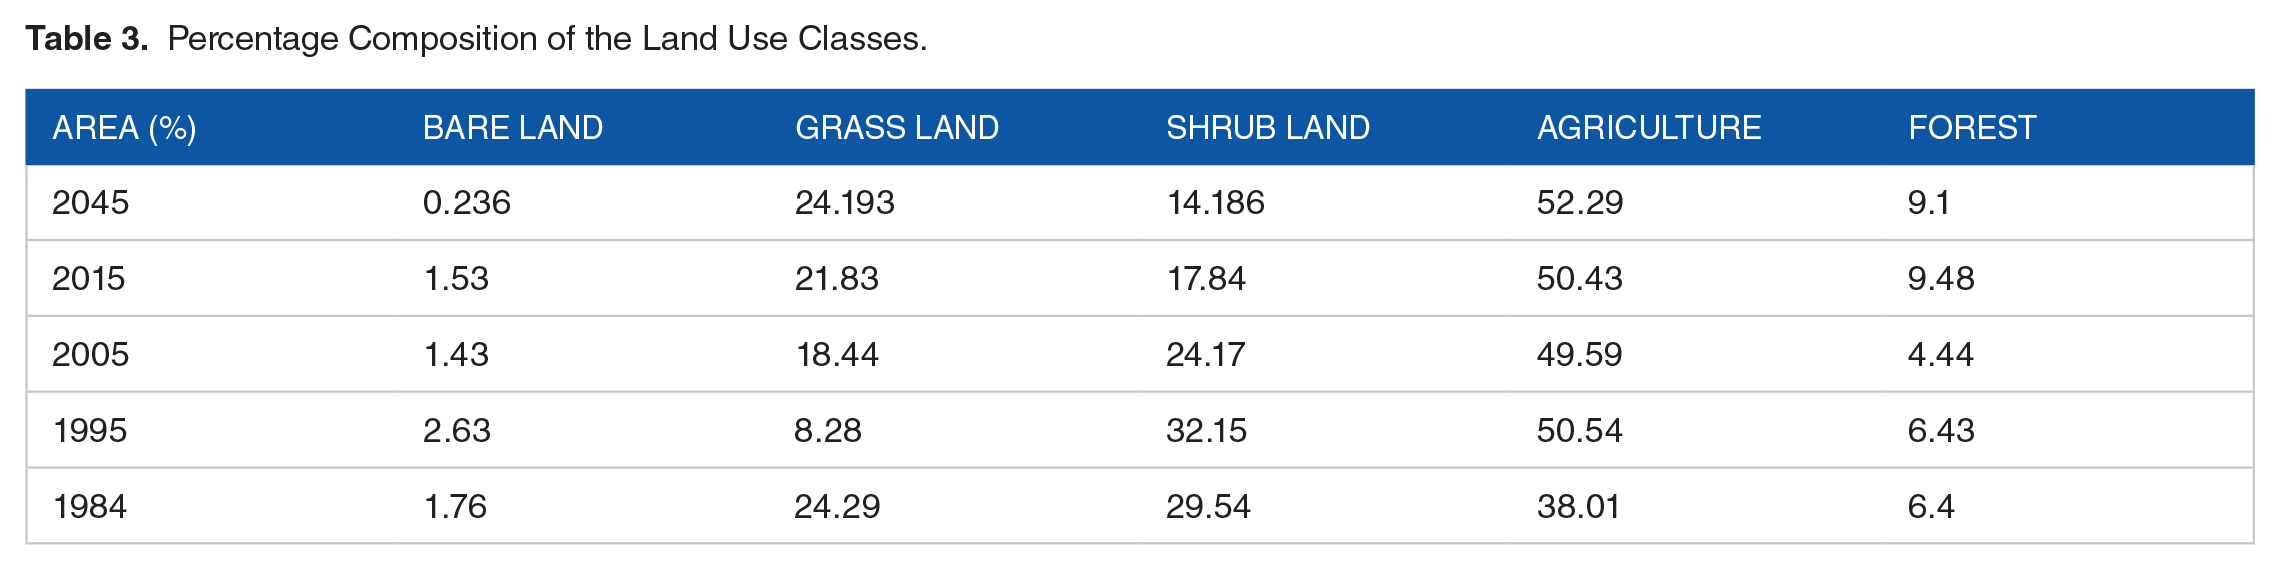
The LULC classes, including vegetation cover (Forest and shrubland), experienced a shift from 34.87% in 1984 to 23.62% in 2015 (Table 3). The agricultural sector, which was 38.67% in 1984, changed to 51.44% in 2015. The prediction values of agriculture and grassland are 52.29 and 24.193, respectively. Meanwhile, the prediction value of shrubland decreased to 14.186 in 2045 (Figure 6).
Percentage Composition of the Land Use Classes.
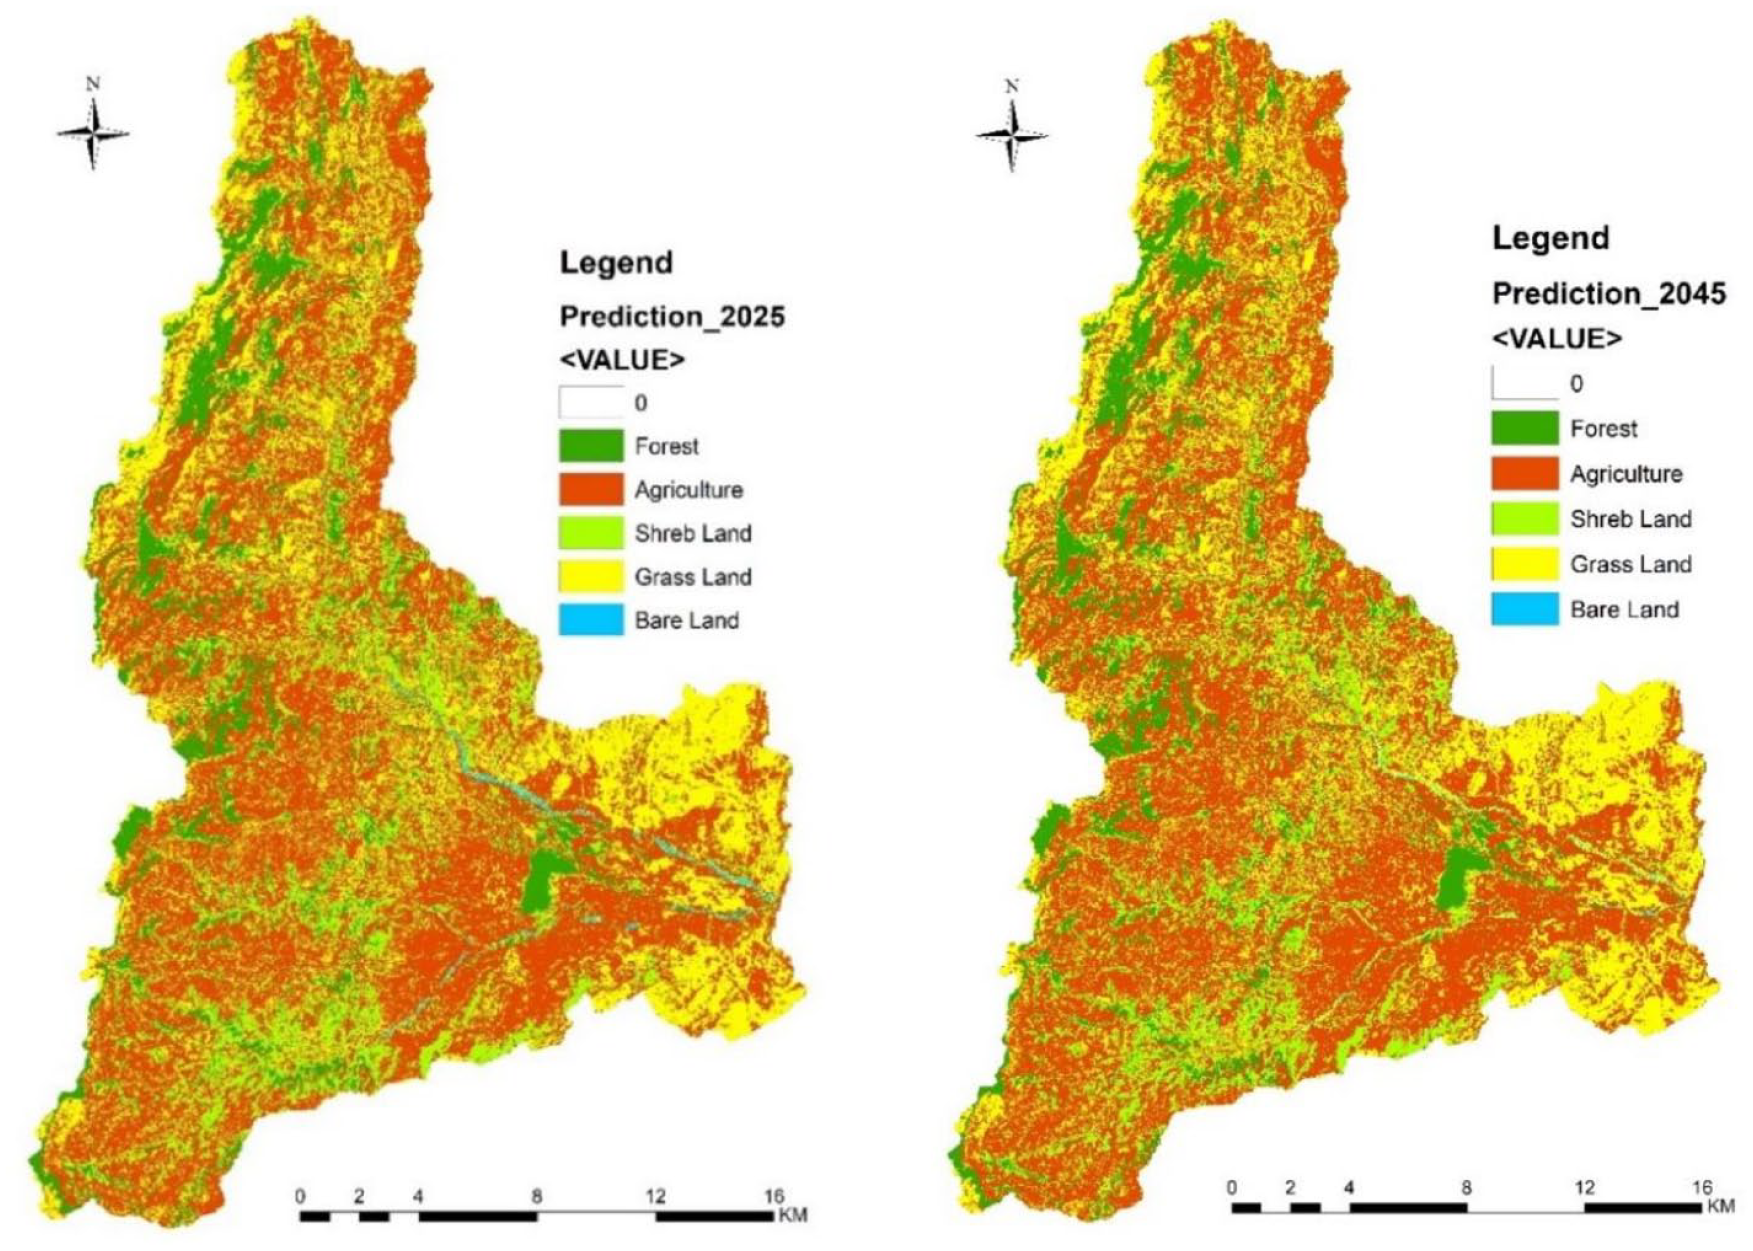
The LULC change prediction in years, 2025 and 2045 based 2015.
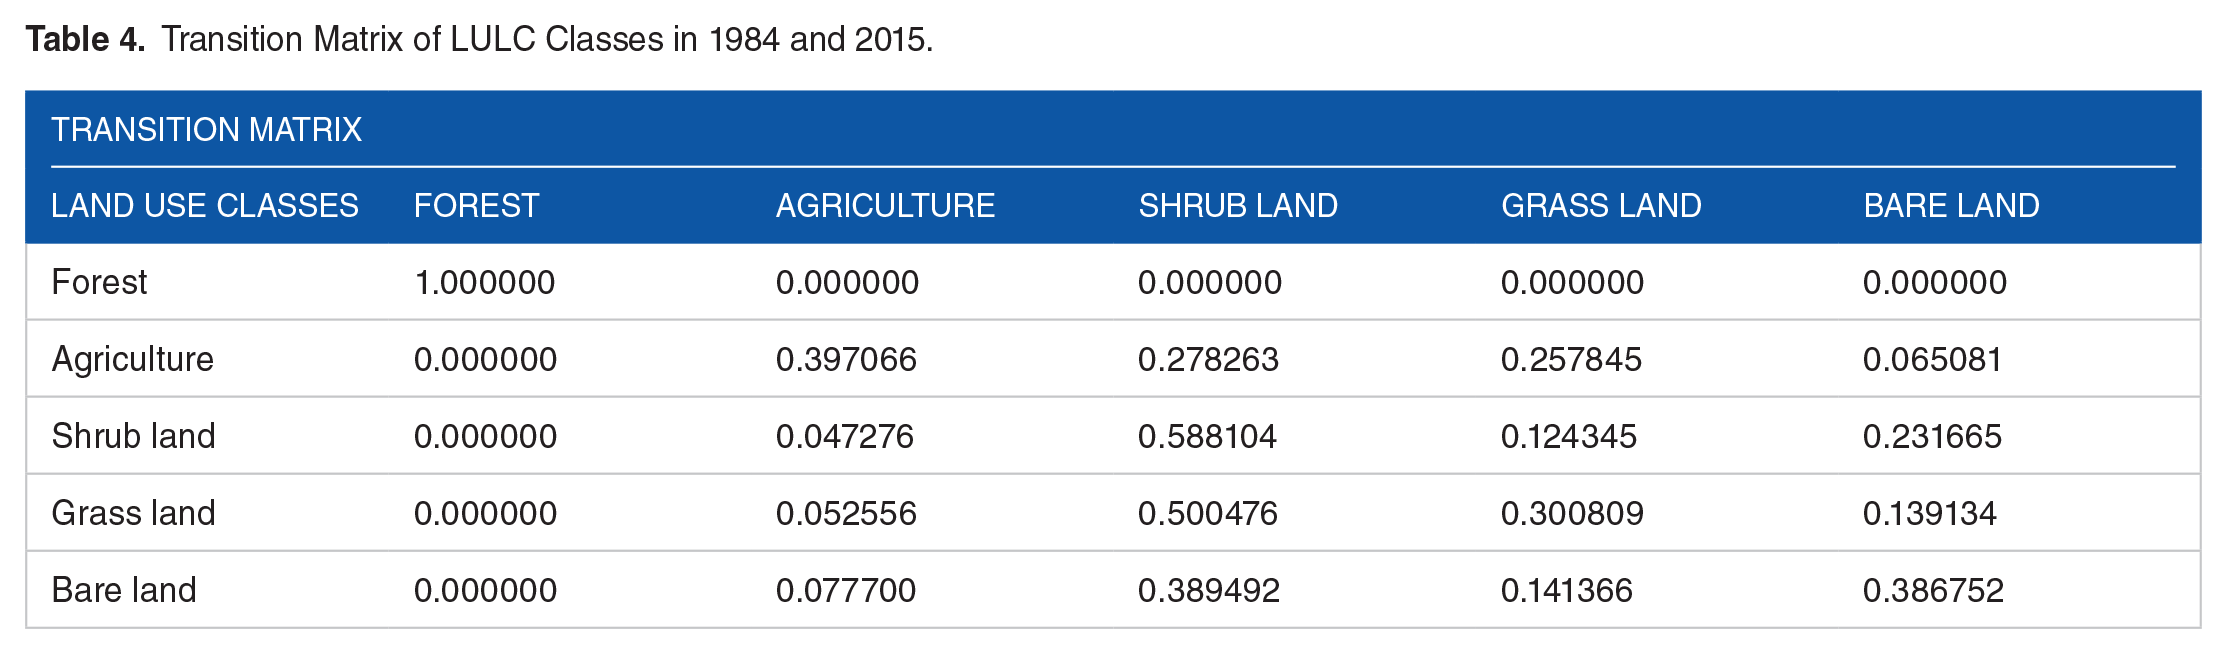
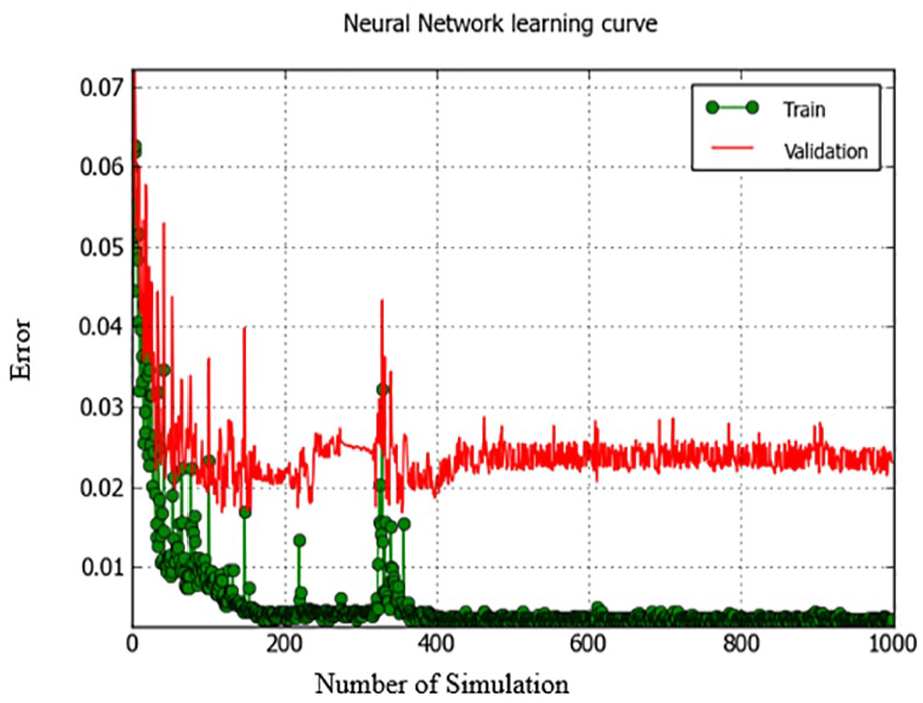
Artificial Neural Network modeling simulates LULC prediction for future land use change analysis. The simulation period is for 1,000 times (Figure 7). the confusion matrix of the prediction is shown in Table 4. The prediction value shows that agricultural expansion will be done unless mitigation measures are taken.
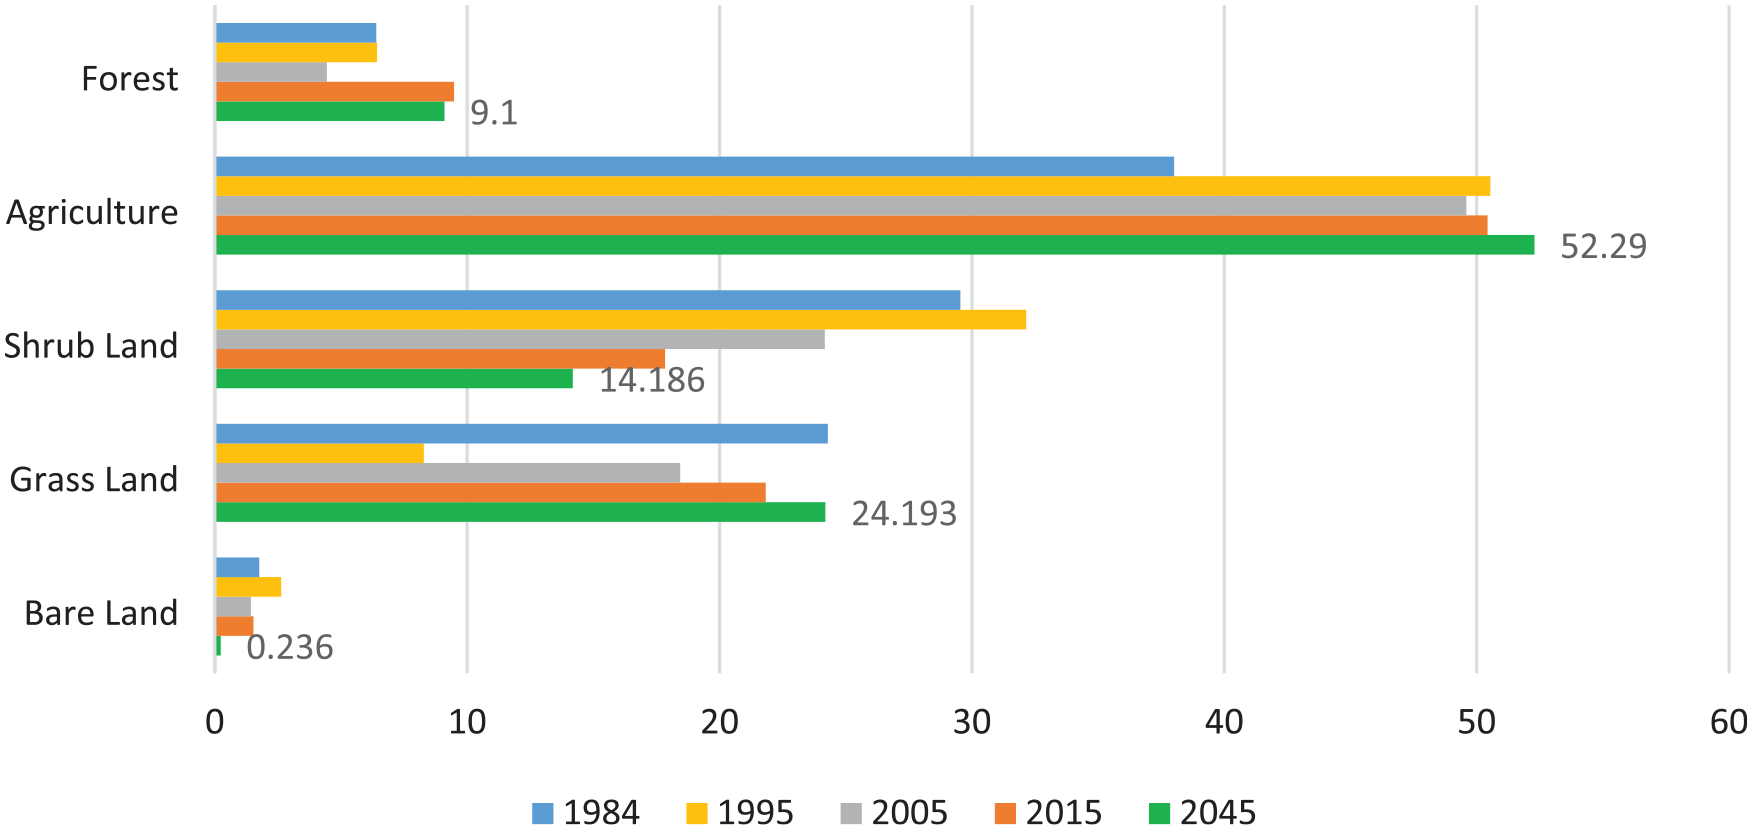
Percentage of LULC composition of the Jewha watershed in 1984, 1995, 2005, 2015, and 2045.
Transition Matrix of LULC Classes in 1984 and 2015.
Sensitivity analysis
The Jewha watershed outlet (sub-watershed number 18) was used to simulate the total monthly stream flow at each outlet in the entire watershed. The model’s performance in simulating hydrological variables was evaluated using statistical tests in the SWAT-CUP.
The results of Nash-Sutcliffe Efficiency (NSE), percent bias (PBIAS), and coefficient of determination (R2), which is within the acceptable range of the statistical values, are .98, 16.9, and .9, respectively (Table 5). Based on the p-value and t-test values, the final sensitivity test generated a graphical representation of the sensitivity hierarchy of the parameters presented in Figure 8.
Summary Statistical Values of (R2), (NSI), and (PBIAS) in Monthly Time Step.

Transition Potential Modeling of Artificial Neural Network (Multi-layer Perceptron) Method.
The classification of parameters according to their sensitivity is based on their increasing hierarchical position. Based on the analysis, the most significant parameters for the study area are revealed.
Model calibration and validation
Calibration and validation aimed to maximize model efficiency and ultimately utilize parameter values obtained through those calibration techniques. The calibration was done by observed flow from 1985 to 1997 (Figure 9). The validation took place from 1998 to 2005 (Figure 10). The simulation and observed runoff variables have an accuracy level of R2 = .9, PBIAS = -16.9, and NSE = 0.98.
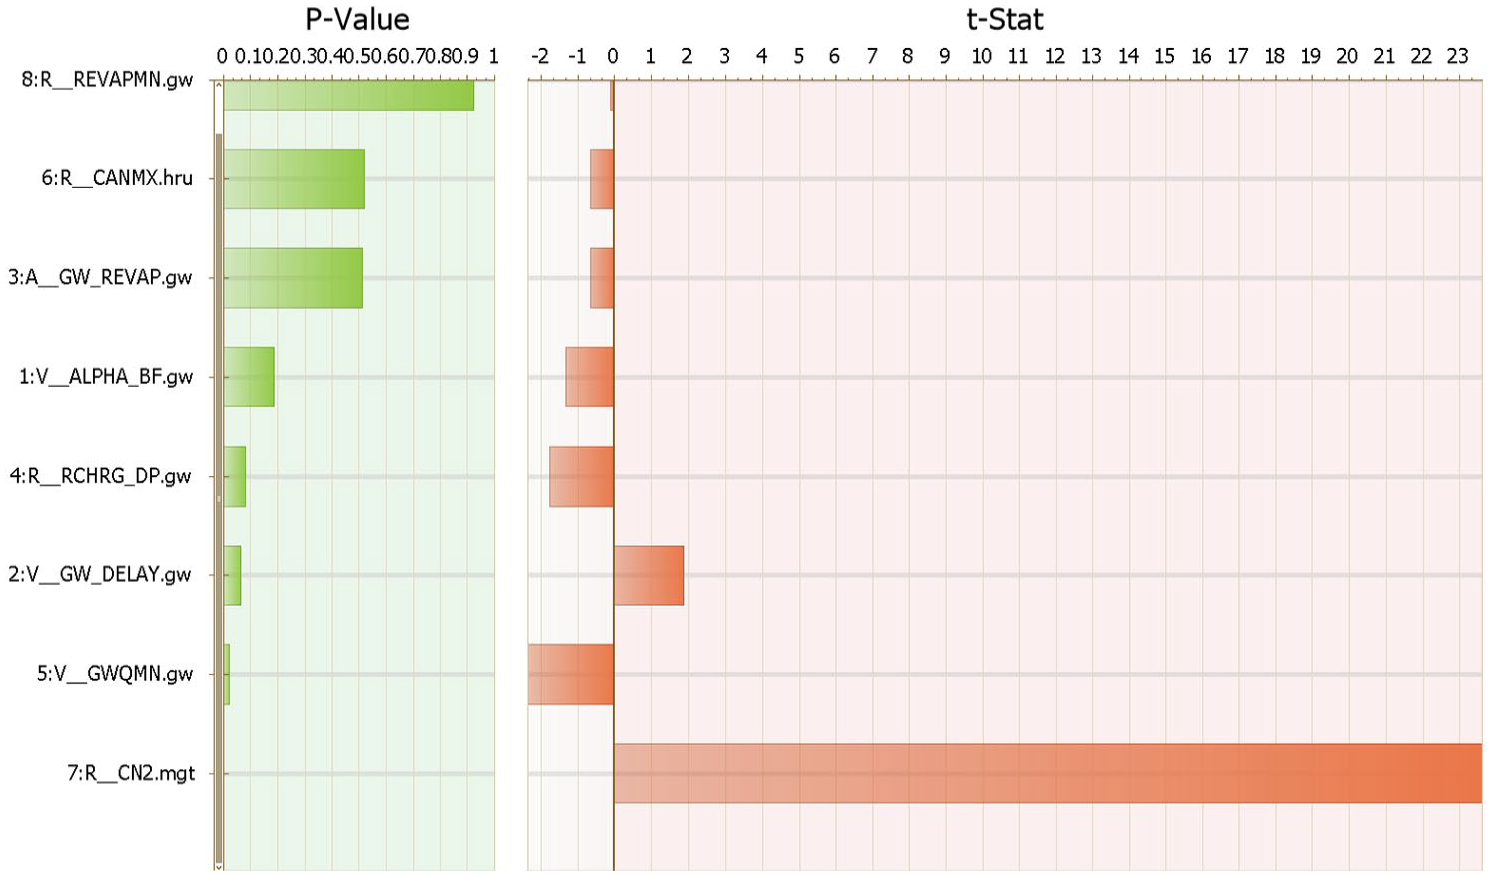
List of sensitive parameters in Jewha watershed and their p-value and t-stat.

Calibration result of runoff data from 1985 to 1997 of Jewha watershed.
Impact of LULC and Climatic variability on runoff under hypothetical scenarios
LULC change and climatic variability are the two most important factors of watershed hydrology. To assess the impact due to these factors, analyzed by making one-factor constant at a time. Land use can be studied by constant climate variable inputs (WGEN). In the same way, climate impact was analyzed by making LULC data constant in the SWAT simulation. was compared with the different climatic conditions. Rainfall with hydrological components such as surface runoff, groundwater discharge, and evapotranspiration simulated by SWAT with varying land use patterns and climatic conditions is presented in Tables 6 to 8. Table 6 shows the different hypothetical scenarios S1, S2, S3, and S4, implying only the impact of land use change on climatic conditions from 1984 to 1994. Similarly, Tables 7 and 8 exhibit the hypothetical scenarios. Hypothetical scenarios represented by S5 to S8 and S9 to S12 are climatic conditions from 1995 to 2004, and 2005 to 2015, respectively.
Average Annual Hydrological Components in Different Land Use Classes With Climatic Conditions (C1).

Average Annual Hydrological Components in Land Use Classes With Climatic Conditions (C2).

Average Annual Hydrological Components in Different Land Use Classes With Climatic Conditions (C3).

By comparing the baseline scenario S1 (land use, 1984; climatic 1984–1994) with S2 to S4, it was found that there is an increase in surface runoff (1.59, 10.62, and 23.58 m3/s in 1995, 2005, and 2015, respectively) in S2, S3, and S4 scenarios. However, a decline in groundwater levels of 3.05, 5.19, and 12.36 mm) may be due to a slight decrement in shrub-land, and an increase in ET by 0.8, 2.5, and 6.2 mm) was found (Table 6). Similar results (increase in runoff and ET, and decrease in groundwater) were observed in different hypothetical scenarios of S5 to S12 although with different magnitudes (Tables 7 and 8). The decline in vegetation (natural forest, plantation forest, and shrub land) cover (34.87% in 1984–23.68% in 2015) and the increase of cultivated land (38.67% in 1984–51.44% in 2015) may be a reason for increasing runoff and decreasing groundwater. The slight decrement in runoff and ET and increment in groundwater in 1995 may be due to the increment in shrubland and plantations (Table 6). The results assume the only effect of land use change between the given hypothetical scenarios in the Jewha watershed.
To see more about the individual effects of LULC and climate change, follow the steps in the table below. Tables 7 and 8 show the impact of only LULC on the runoff. Tables 9 and 10 showed only the effects of climate variability on the runoff.
Formulation of Scenarios to Evaluate the Effect of LULC Change On Runoff.

Effect of LULC Change On Runoff under Each Constant Climate (C1, C2, and C3) in m3/s.

The changed runoff due to LULC in 1984, 1995, 2005, and 2015 with climate scenarios C1, were 1.59, 10.62, and 23.58 m3/s, respectively. The runoff in the climate conditions C2 and C3 at each LULC is shown in Figures 11 to 13.

Validation result of runoff data from 1998 to 2005 of Jewha watershed.

The graph shows the effect of LULC change on runoff.
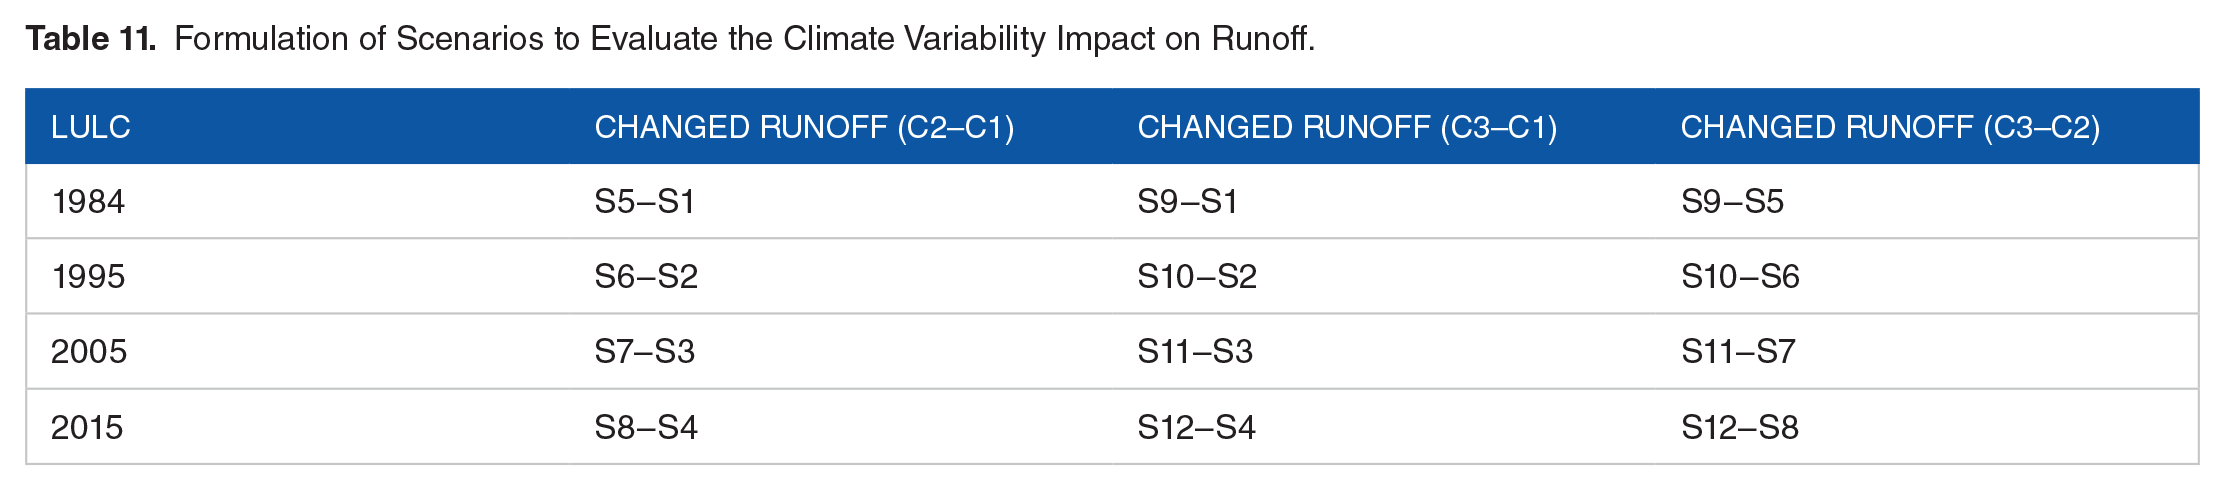
In this study, it is also important to assess the impact of climatic variability on the hydrology of the Jewha watershed. Due to the limitation of meteorological data within the watershed, we used global climate data for the weather generator (WGEN). Comparisons of climate and LULC changes were made using hypothetical scenarios (S1, S5, and S9), where similar land use (1984) was compared with different climatic conditions (1984–1994, 1995–2004, and 2005–2015). The result exhibits that a decrease in precipitation by 203.7 mm (with scenarios S1 and S5) causes a decrement in runoff by 26.83 m3/s, whereas, an increase in rainfall by 381.6 mm (with scenarios S5 and S9) causes an increase in runoff by 96.37 m3/s (Table 11 and 12).
Formulation of Scenarios to Evaluate the Climate Variability Impact on Runoff.
Effect of Climate Variability on Runoff With Constant LULC Condition.

The obvious distinctions between S1, S5, and S9 indicate impacts only caused by climate variability. The repeated trial (scenarios S2, S6, and S10; S3, S7, and S11; S4, S8, S12) also shows that an increase in rainfall causes an increase in runoff and a decrease in rain causes a decrement in runoff. The outcomes of hypothetical scenarios explained that both LULC and climatic variability have an impact on the hydrology of the Jewha watershed. It also has to be assumed that the combined effects of land use change and climate variability are not a simple addition of the individual impacts owing to the complex interactions between land use change and climate variability (Li et al., 2009).

The graph shows the effect of climate change on runoff with different climatic conditions.
The negative sign indicates the change is in decreasing order. Whereas, the positive sign indicates increasing order. This decrement in runoff comes from precipitation, which is lower in scenario (C1) which was 610.7 mm than in scenario (C2; 814.4 mm).
Prediction of LULC change
Since climate change studies need a longer time, it was analyzed in another scenario by simulating the climate inputs from 1984 to 2015. The land use inputs are 1984 and 2015. The land use inputs are 1984 and 2015.
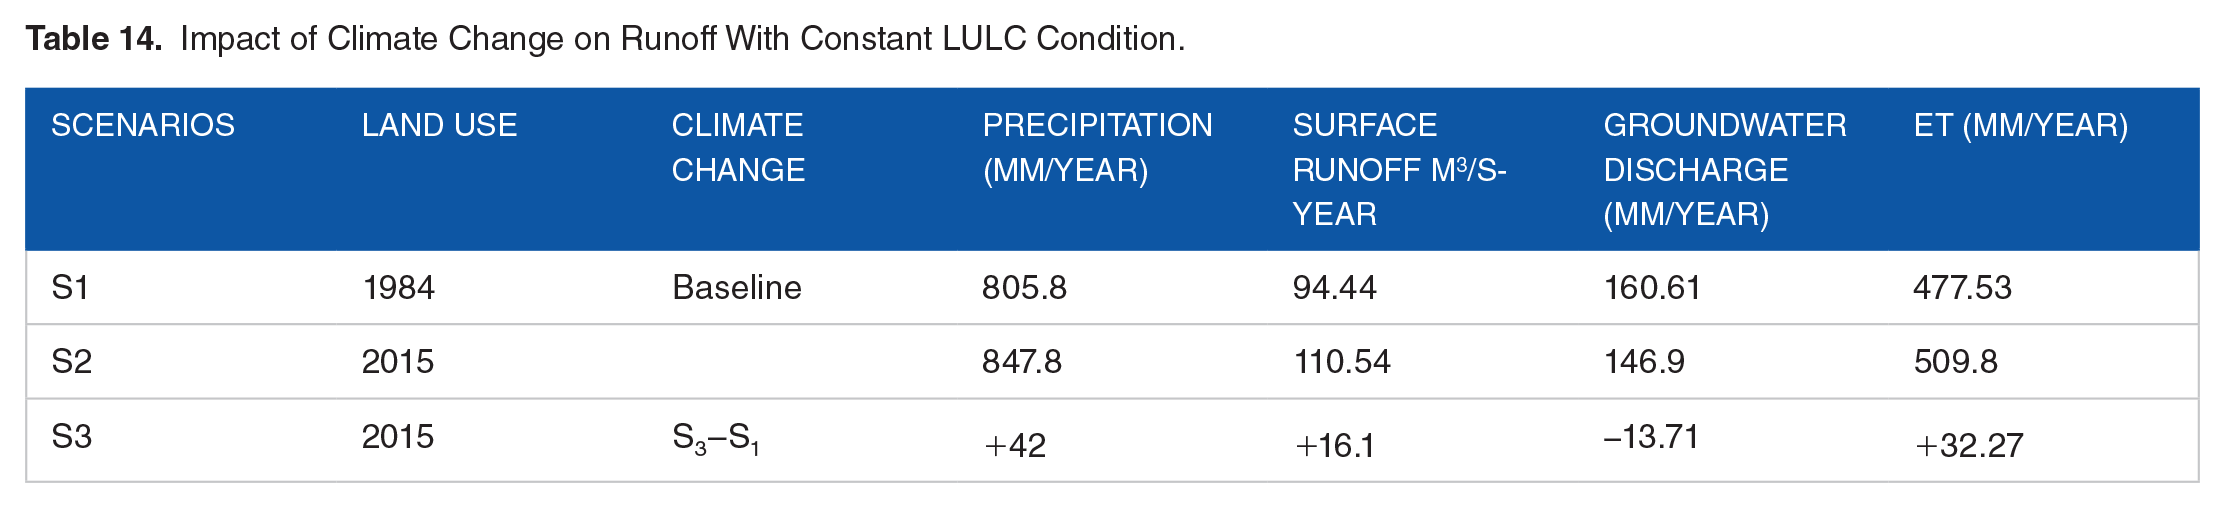
The above (Table 13) shows the analysis of climate change impact from 1984 to 2015. In comparison to the simulation from 1984, climate change resulted in a 16.1 mm3/s increase in surface runoff in 2015. This may be due to the precipitation that increased by 42 mm annually. The evapotranspiration also increased by 32.27 mm. The groundwater discharge decreased by 13.71 mm (Table 14). The (+) sign shows the difference is increased and the (−) sign is decreasing order.
Formulation of Scenarios to Evaluate the Climate Change on Runoff.

Impact of Climate Change on Runoff With Constant LULC Condition.
In addition to predicted the LULC for 2045, a climate change analysis from 1984 to 2015 was conducted. The result of the simulation in constant climate data, the impact of LULC change on runoff is shown in Table 15 above. In the comparison of 1984 and 2015, surface runoff increased by 30.34 m3/s in 2015 due to changes in the LULC. This is due to increased precipitation by 33.4 mm, whereas groundwater discharge decreased by 17.09 mm. This may be due to a decrease in vegetation cover in the area. The evapotranspiration increased by 8.2 in 2015 when compared to 1984 (Table 15).
Impact of LULC Change on Runoff With Constant Climate Condition.

Conclusion and Recommendations
Conclusion
The spatial and temporal variability of LULC change and climate variability in the Jewha watershed mainly affect the runoff change. The spatio-temporal variability of the LULC classes, such as vegetation cover (natural forest and shrubland), which was 35.94% in 1984 changed to 27.32% in 2015. Were as cultivated land, which was 38.01% in 1984 increased to 50.43% in 2015. This caused the groundwater discharge has decreased by 17.09 in 2015 as compared with 1984. The ground discharge also decreased by 13.71 mm/year due to climate change (ET increased by 32.27 mm/year)
The variability of runoff, due to climate change was increased by 16.1 m3/s in 2015 as compared with 1984. This is due to increased precipitation of 42 mm in 2015 as compared with 1984. In general, both climate and land use affect the runoff in the Jewha watershed. Based on this result, the following recommendations were made.
Recommendations
The existing vegetation cover should be maintained, and management practices should be done to rehabilitate the degraded land in the sloppy area of the upper watershed. For example, sub-watershed 22 has a high sediment load due to agricultural activities in the high slope area, which is more than 30% (Annex 1).
From observation in the lower watershed, water scarcity exists in the irrigation areas. Therefore, irrigation efficiency should be improved, and future research should be done on this topic. Because the area has high irrigation potential.
The agricultural practices should be improved to production that enhances vegetation cover like coffee plantations and other fruits. Since the area receives a bimodal type of rainfall, it helps to improve productivity while maintaining the environment for future generations and the current downstream water-stressed area.
Footnotes
Annex 1: Map of Sub-Watershed 22 That Has a High Sediment Load Due to Agricultural Activities
Acknowledgements
We all thank God for the time and serve us day and night. I thank my family for their support. I would thank you! My advisor, prof. Tenalem Ayenew and Satishkumer Belliethathan supported me with this research work to be done. Next, I acknowledge all the institutions for their financial support. These are Addis Ababa University and Debre Markos University. I also thank my friends for supporting me through suggestions and recommendations. This manuscript is available on the Pre-print server: ![]() .
.
Author Contributions
Dereje Gebrie Habte: wrote the first draft. Prof. Tenalem Ayenew: Edited and commented. Satishkumar Belliethathan (PhD): Organized and facilitated.
Declaration of Conflicting Interests
The author(s) declared no potential conflicts of interest with respect to the research, authorship, and/or publication of this article.
Funding
The author(s) received no financial support for the research, authorship, and/or publication of this article.