
Abstract
Most urban water catchments are confronted with the challenges of eutrophication and other anthropogenic-related pollutants that can pose human health threats. To assess the suitability of using such anthropogenically polluted dam water for agricultural purposes the study monitored the co-existence of microcystins (MCs), metal pollutants, and anionic surfactants in irrigation canals and farm dams around Roodeplaat and Hartbeespoort Dams in South Africa. Field sampling was conducted four times between June 2019 and March 2021. The enzyme-linked immunosorbent assay (ELISA) method, a Hanna (HI96769) anionic surfactant portable photometer, and the inductively coupled plasma mass spectrometry (ICP-MS), were used to detect and quantify microcystins (MCs), anionic surfactants, and metals respectively. The results indicated that the water exceeded the guidelines for pH, EC, TDS, and nitrates. Eutrophication-related parameters such as MCs, chlorophyll a, and anionic surfactants were also relatively high. The Principal Component Analysis (PCA) showed the co-occurrence of MCs with EC, TDS, Pb, Cu, Al, and Ni in Hartbeespoort Dam-derived water, whereas pH and turbidity co-occurred with MCs in Roodeplaat Dam water. Such co-occurrences suggest that these parameters can be routinely monitored in place of MCs and this can be crucial in developing countries where resources and skilled manpower could be lacking.
Introduction
Aquatic ecosystems are vulnerable to anthropogenic activities and disturbances, and pollution of these ecosystems impacts all forms of life. Among the negative impacts of contamination of surface waters include human diseases, deaths of aquatic organisms, decline in fishing activities, severe water shortages, and high costs of water treatment (Teixeira de Souza et al., 2021). Of particular interest are water reservoirs, which are ecosystems of interest since they are man-made and possess both natural and artificial phenomena (Padedda et al., 2017). These reservoirs are built to give humans services such as irrigation and drinking water, aquaculture services, hydroelectricity, managing floods, leisure, and tourism.
Technology advancement, human settlement, and industrialization have all accelerated the pollution of ground and surface water systems, soil, sediments, and air with harmful contaminants and chemicals (Isiuku & Enyoh, 2020). For example, agriculture contributes sediments and nutrients to aquatic ecosystems, urbanization introduces vast quantities of solids and organic contaminants and industries are large contributors of inorganic pollutants (Dalu & Froneman, 2016).
Among the most important global environmental challenges facing aquatic ecosystems is eutrophication (Padedda et al., 2017). Eutrophic conditions promote oxygen deficiency as a result of the excessive organic matter emanating from algal blooms that cannot be fully degraded, high levels of toxins produced by cyanobacteria, production of bad odors and tastes (Padedda et al., 2017). Eutrophic waters also have problems of turbid waters, incidence of fish deaths, biodiversity loss, and loss of aesthetic value (Matthews & Bernard, 2015).
South Africa is renowned for having sound water policies and legislation, however, the severe deterioration of the country’s water quality is a subject of concern (Griffin et al., 2014; Kruger et al., 2022).
The country’s leading water quality challenges are eutrophication, salinity, sedimentation, and microbial pollution (Roux et al., 2010). Over the last few years, acidification of surface waters as a result of a long history of poorly regulated gold mining in the country has also added to the burden (du Plessis, 2017).
Agriculture plays a significant role in the country’s economy. Much of the water allocated to the agriculture sector goes to commercial agriculture (Pindihama & Gitari, 2020). The profitability and sustainability of this industry rely on the acceptability of the quality of water used to irrigate the crops and poor water quality can lead to lower yields and products of unacceptable quality.
Metals are naturally occurring in the environment. However, their environmental pollution is exacerbated through their continuous discharge in industrial effluents, wastewater treatment plants, agricultural activities and erosion, mining effluents, and waste dumps (Nde & Mathuthu, 2018). On the other hand, anionic surfactants are a common constituent of many detergents due to their low cost and ease of synthesis. Anionic surfactants are discharged into aquatic ecosystems via untreated and treated wastewater, and they are not easily degraded under anoxic conditions such as those found in hypereutrophic water bodies (Pindihama & Gitari, 2023). Such hypereutrophic conditions are also a commonplace of harmful cyanobacterial blooms, which produce a variety of cyanotoxins such as microcystins (MCs) which pose a risk to both aquatic organisms and human health (Ge et al., 2021).
The Crocodile (West) and Marico catchment located in the North West Province in South Africa and covers parts of Gauteng is renowned for its poor water quality and hypertrophic water bodies (Pindihama & Gitari, 2020). The Crocodile and Marico rivers are the two main rivers in the catchment and these supply water to dams such as the Hartbeespoort, Rietvlei, Roodeplaat, and Bospoort Dams. Anthropogenic activities have severely altered these two rivers, with intense agriculture and mining activities having had unprecedented impacts on the water quality of these rivers (Nde & Mathuthu, 2018).
Surface water from the Crocodile and Marico rivers is mainly used for agriculture, domestic, industrial, and mining purposes and the poor quality of the water could have serious negative impacts on sectors like agriculture which rely on good water quality for their sustainability. The study thus investigated the suitability of using water derived from the Crocodile West and Marico water catchment for agricultural purposes by determining the co-existence of microcystins (MCs), metal pollutants, and anionic surfactants in irrigation water (canals and farm dams) around Roodeplaat and Hartbeespoort dam sites. Emphasis was also placed on the Principal Component Analysis of the variables monitored to identify a few simple parameters that can be reliably used for routine monitoring to assess the suitability of such water for agricultural purposes. The findings can assist in supporting water quality management and pollution control in the catchment and long-term mitigation of potential negative impacts of using such water for agricultural purposes.
Materials and Methods
Site Description
Hartbeespoort and Roodeplaat Dams situated in the North West and Gauteng Provinces of South Africa respectively, were selected as the sampling sites. These two dams are important reservoirs in the country. The Hartbeespoort is found along the Crocodile River and 90% of its inflow is derived from this river. The Crocodile River derives much of its inflow from the Magalies watershed and is a tributary of the Limpopo River system (Batayi et al., 2020). Water from the Hartbeespoort Dam is mainly used for irrigation, domestic uses and the dam is also used for recreational purposes. The Crocodile River drains from predominantly industrialized and highly populated areas and is subject to extreme levels of pollution.
The Roodeplaat Dam on the other hand receives water from three major rivers namely the Hartbeespruit, Pienaars, and Edendalespruit Rivers. The Dam is located about 22 km northeast of Pretoria City, South Africa (Figure 1 shows the location of the two dams). The three inflowing rivers and the dam itself are highly contaminated by the human activities taking in and around them. The dam and its inflowing rivers are considered hyper-eutrophic and they receive effluent from two main wastewater treatment plants, urban discharge from households, industrial effluent, and agricultural run-off upstream of the Roodeplaat Nature Reserve (Marchand et al., 2012). Water from the dam is mainly used for irrigation, domestic and industrial purposes.

Location of Roodeplaat and Hartbeespoort dams in the crocodile west and Marico water catchment.
Sampling
Sampling, which involved monitoring of physicochemical parameters in situ and collection of water samples for ex situ analysis was conducted in June 2019, September 2019, February 2020, and March 2021 (with the major breaks in between due to COVID-19-related restrictions). Water samples were collected from farm dams and irrigation canals. Seven sampling sites (H1, H2, H3, and H4 around the Hartbeespoort Dam site and R1, R2, and R3 around the Roodeplaat Dam site) were selected for water sampling (Table 1). Figure 1 shows the location of the two dams and, Figure 2 shows the sampling points.
Description of the Sampling Stations.


Study area with selected irrigation canals/farm dams sampling points at Roodeplaat and Hartbeespoort dam sites.
Glass amber bottles (100 mL) were used for microcystins (MCs) and anionic surfactants sampling and plastic HDPE (250 mL) bottles were used for metals, chlorophyll a, and nutrients (dissolved orthophosphates and nitrates) sampling. A 3 mL dose of 30% (v/v formalin) was added to each sampling bottle for anionic surfactants before sampling to preserve the samples from biodegradation.
All water samples were collected from farm dams and irrigation canals from a depth of approximately 0.5 m using a sampling rod. All water samples for metals determination were acidified with a drop of nitric acid (HNO3) to prevent the precipitation of the metal species. All samples were properly labelled, collected in triplicates, and kept in cooler boxes packed with ice for transportation to the laboratory for further processing and/or extraction (where applicable), and analysis.
Physicochemical Parameters Monitoring
A Jen-way pH/Cond meter (model 430) (United Kingdom) was used for the in situ monitoring of the water physicochemical parameters such as temperature, pH, total dissolved solids (TDS), and electrical conductivity (EC). A TB200 portable turbidimeter model (#TB200-10) was used to measure the turbidity of the water in situ. All meters were calibrated according to the manufacturer’s instructions before use.
Determination of Nutrients, Microcystins, and Chlorophyll a
The levels of nutrients (dissolved orthophosphates and nitrates) in the samples were determined using Spectro-quant® Merck Pharo 100 model No: 07531-45 (Merck KGaA 64293 Darmstadt, Germany), using the photometric test kits supplied by Merck (Germany).
Chlorophyll a was used to estimate the levels of algal biomass in the water samples. Chlorophyll a was determined using the hot ethanol extraction method according to Lawton et al. (1999). Spectrophotometric analysis of absorbency wavelength was done on a Spectro-star Nano (BMG LABTECH, 601-1106, Germany), and chlorophyll a levels were calculated according to Lawton et al. (1999).
The enzyme-linked immunosorbent assay (ELISA) method was used to determine the levels of total microcystins (MCs) in the water samples. The ELISA Microcystin Plate Kits (ENVIROLOGIX INC. (Kit Lot: 071499 Cat No: EP 022) were used for the assay according to the instructions that come with the kits and a microplate reader Spectro-star Nano (BMG LABTECH, 601-1106, Germany) was used to quantify the MCs after the assay.
Determination of Anionic Surfactants
The levels of anionic surfactants in the water were determined ex situ using the HANNA methylene blue active substances assay (MBAS) test kits according to the supplier’s instructions. The assay is a colorimetric test that relies on the detection of anionic surfactants in the sample by methylene blue provided in the kits. The levels of anionic surfactants such as sodium dodecylbenzene sulfonate (within a range of 0.0 to 3.5 mg L-1) are then measured on a HANNA HI96769 Anionic Surfactant Portable Photometer (Hanna Instruments, South Africa).
Determination of Metals
The acidified water samples collected from the field were kept at 4 °C in a refrigerator, and 10 mL of the samples were transferred into 15 mL centrifuge tubes, labeled accordingly, and sent to the Stellenbosch University Central Analytical Facility for determination of cations using the Inductively Coupled Plasma Mass Spectrometry (ICP-MS) analysis.
Data Analysis
Data was captured into a Microsoft Excel (2013) spreadsheet and was later imported into SPSS version 28.0 for bivariate correlation analysis and into GraphPad Prism 10 for principal component analysis (PCA). Compared to other statistical techniques, PCA is a robust method that does not need data to be normally distributed and uncorrelated variables (Bensoltane et al., 2021). PCA helped to group the data and give hidden relationships between the variables monitored.
Results and Discussion
Water Quality
The physicochemical characteristics of the water are summarised in Tables 2 and 3.
Physical and Chemical Parameters for Different Monitoring Stations Studied.

Note. Values represent mean ± standard deviation & Min–Max.
Department of Water Affairs & Forestry (DWAF, 1996). **Food and Agriculture Organization (FAO) guidelines of 1985 (Ayers & Westcot, 1985).
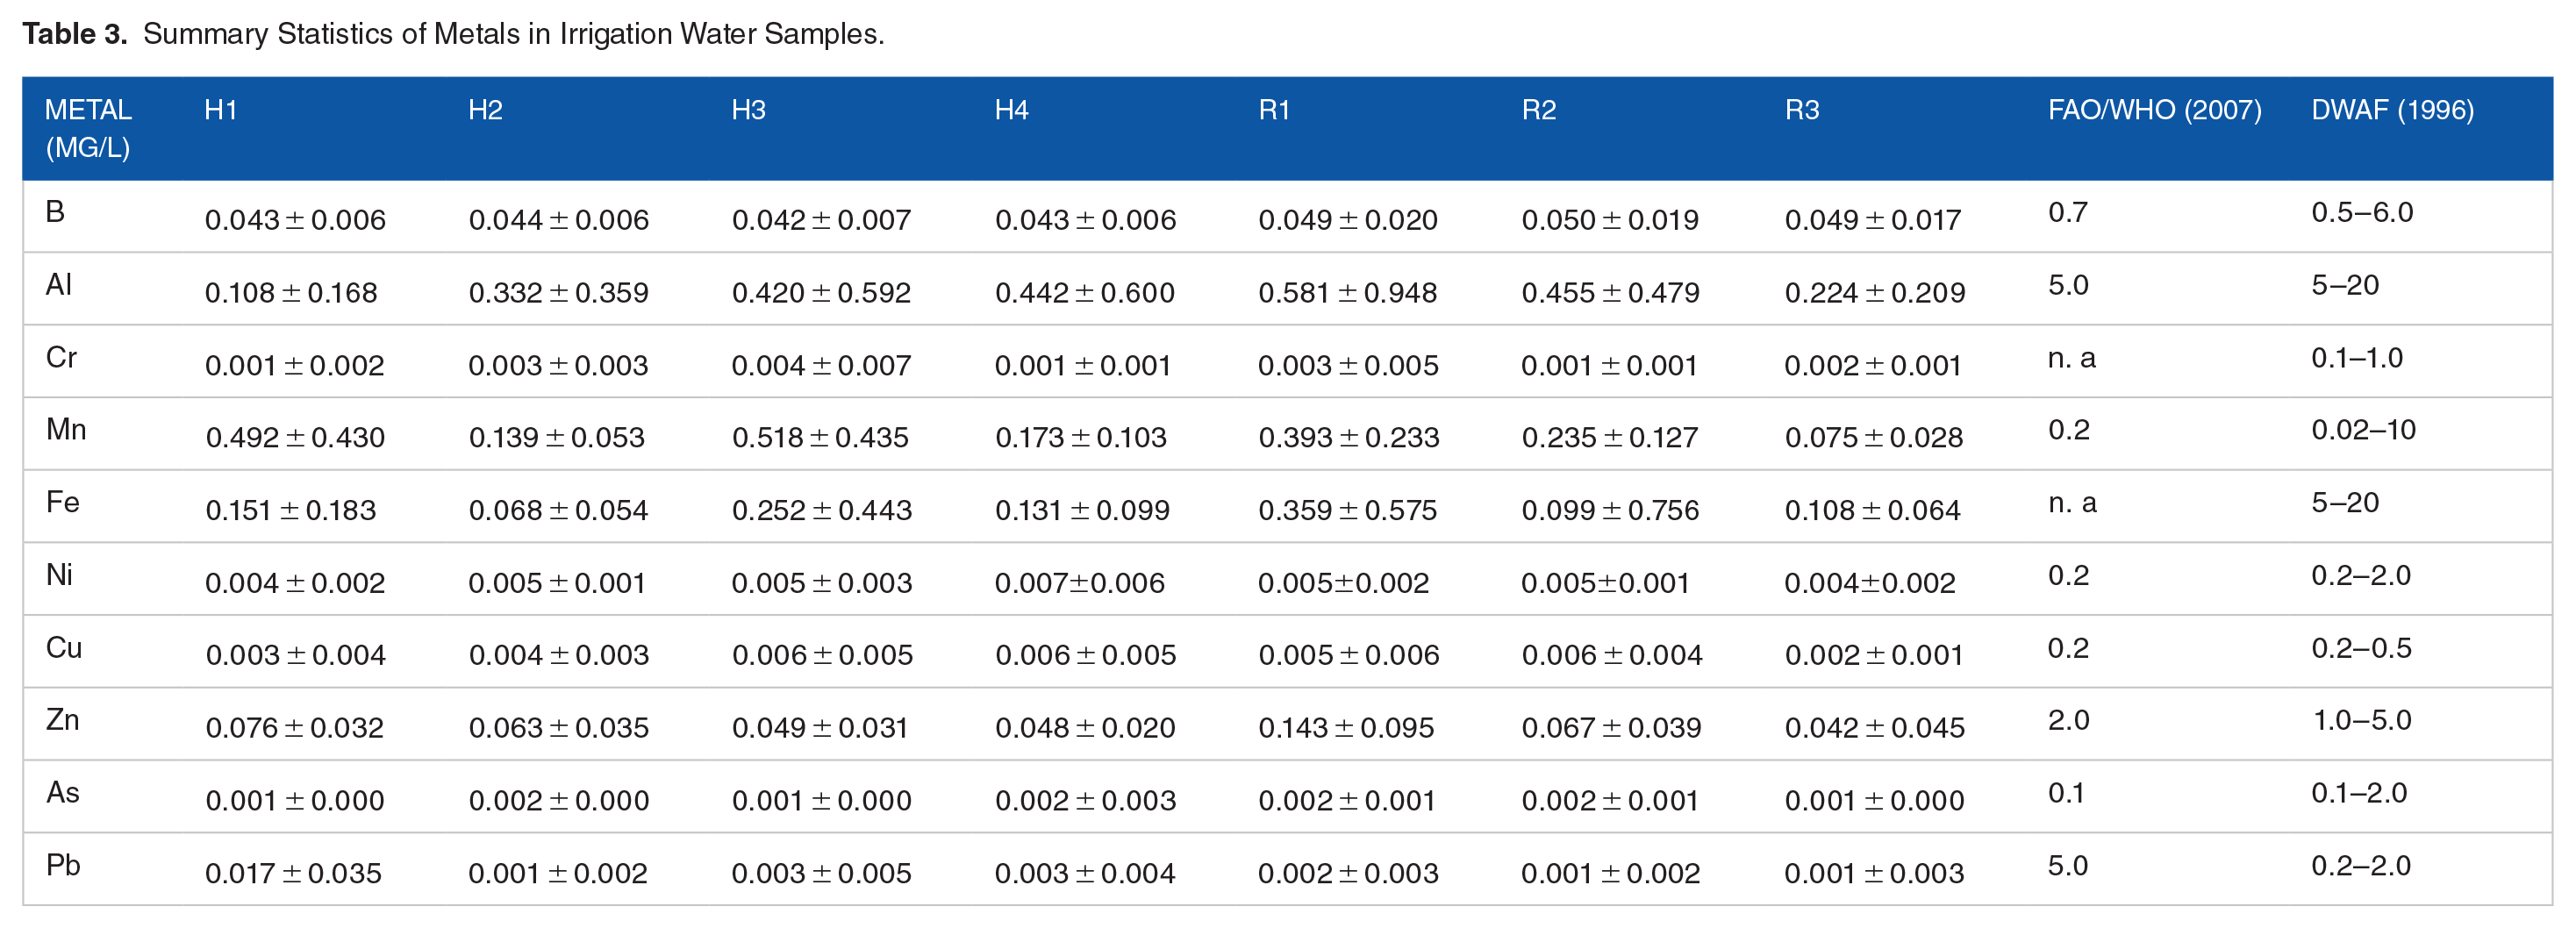
Summary Statistics of Metals in Irrigation Water Samples.
PH
The mean pH of the water ranged from 7.24 ± 0.63 to 9.72 ± 0.86, indicating that the water derived from the two dams is slightly neutral to alkaline. The mean pH of all the three sampling points from the Roodeplaat site and one out of the four sampling points (H4) exceeded the South African guideline for irrigation waters (DWAF, 1996). Irrigating plants with water having a pH above 8.4 can have serious implications on the plants’ health and ultimately affect the crop’s yield and quality (Hopkinson & Harris, 2019). Such alkaline pH may also promote the excessive proliferation of harmful algal blooms in the water (Edokpayi et al., 2014). This was also supported by Mbiza (2014) who found that pH ranging between 6 and 9 tends to favor cyanobacterial dominance. The findings of this study tend to suggest that the pH levels found throughout our sampling period, ranging between 6 and 10, suited the dominance of cyanobacteria.
TDS and EC
The mean TDS and EC ranged from 280.95 ± 146.46 (sampling point R2) to 453.50 ± 347.16 mg L-1 (sampling point H4) and 493.00 ± 267.14 (R2) to 732.50 ± 541.95 (H4) µS cm-1 respectively. The observed TDS and EC levels revealed that two out of three canals and three out of four farm dams sampled exceeded the recommended thresholds for water intended for irrigation water (DWAF, 1996). The mean TDS and EC levels recorded, exceeded the South African guidelines for irrigation waters (see Table 2) in all six sampling points, with higher TDS and EC levels observed at the Hartbeespoort Dam sampling site compared to the Roodeplaat Dam site. These high TDS and EC levels indicate the presence of salts such as chloride, calcium, potassium, nitrate, bicarbonate, carbonate, and magnesium at high concentrations in the irrigation water which might have implications on the quality and health of the irrigated produce. High levels of salts may result in soil sodicity (DWAF, 1996; Edokpayi et al., 2014) and may reduce water available for plant uptake even in wet soils (Mezgebe et al., 2015).
Temperature
The mean water temperature across the sampled points ranged from 18.88 ± 4.14 to 22.95 ± 7.08 °C. A pattern of low-temperature levels in the winter (June), moderate in spring (September), and high in summer (February) was observed over the sampling period in both sites and this was obviously due to the seasonal temperature variations. Findings from previous studies show that temperatures above 20 °C (O’Neil et al., 2012) or 23 °C (Conradie & Barnard, 2012) favor harmful cyanobacterial blooms in the water. In another study, X. Wang et al. (2016) reported a direct proportion between temperature and Microcystis biomass in the water column. The water temperature in the two study sites can thus be said to be ideal for the growth of cyanobacterial blooms. There are no set thresholds/guidelines for water temperature in water intended for irrigation.
Turbidity
The mean levels of turbidity in the water ranged between 1.64 ± 1.18 to 245.27 ± 305.60 NTU. Turbidity levels were generally higher at the Roodeplaat Dam site compared to the Hartbeespoort Dam site. Turbidity levels were also higher in the summer sampling compared to the other three seasons and this could be due to the presence of silt, suspended algae, clay, micro-algae, and fine organic matter suspended in the irrigation canals due to run-off as a result of the rains during that time of the year. There are no guideline standards for turbidity in South Africa for water intended for irrigation.
Nutrients and Chlorophyll a
The mean levels of total nitrates in the irrigation water from the two dams ranged from 3.18 ± 2.92 to 12.34 ± 10.85 mg L-1, with the highest nitrate levels having been reported at point H2 in February (2020). Nitrate levels were generally higher at the Hartbeespoort site compared to the Roodeplaat site and two sampling points from the Hartbeespoort site had reported mean nitrate levels above the 5 mg L-1 threshold for irrigation waters (DWAF, 1996) and FAO (Ayers & Westcot, 1985).
The mean dissolved orthophosphate levels ranged between 0.45 ± 0.31 and 1.01 ± 0.55 mg L-1, with all the sampling points falling within the recommended FAO (Ayers & Westcot, 1985) guideline of 0 to 2 mg L-1 for irrigation water. Phosphate levels between 0.025 and 0.25 mg L-1 in a water body tend to support HABs and such levels of phosphates in a water body imply the water body is eutrophic (Balcıoğlu, 2019). Phosphate levels above 0.025 to 0.25 mg L-1 were reported in all the sampled sites throughout the monitoring period (Table 2).
Chlorophyll a was monitored to determine the trophic state and phytoplankton biomass. The mean chlorophyll a ranged between 19.83 ± 16.23 and 422.61 ± 575.75 µg L-1. Generally, chlorophyll a was higher at the Roodeplaat Dam sampling site compared to the Hartbeespoort Dam site. Six of the seven sampling points (except for H3) were above the 30 µg L-1 of chlorophyll a, thus within the hypereutrophic state (Kansas Department of Health and Environment [KDHE, 2011]). Chlorophyll a is normally used to represent the algal biomass of a water body (Ramaraj et al., 2013). Like many other countries, South Africa does not have any limits for cyanobacteria and cyanotoxins in irrigation water or water for agricultural purposes (Pindihama & Gitari, 2020).
Microcystins
The mean total MC levels in the irrigation water samples ranged from 0.21 ± 0.12 to 6.04 ± 5.90, with higher levels of MCs in Roodeplaat Dam water compared to the Hartbeespoort Dam water. The concentrations were well below the MC levels previously reported in other studies 580 µg L-1 and a maximum level of 14,400 µg L-1, such as Van Ginkel (2004) and Conradie and Barnard (2012). Median concentrations as high as 580 µg L-1 and high reaching 14,400 µg L-1 have been previously reported for the same dams (Van Ginkel, 2004; Turton, 2015) . The huge drop in levels of MCs reported in the current study compared to the previous studies can be attributed to the huge efforts and measures that have been put in place by authorities to clean up the two dams and reduce the levels of nutrients reaching them. Despite much lower concentrations of MCs being reported in this study, there are no guidelines for these toxins in irrigation water in South Africa, but there could be an inherent risk when such water is used for irrigation purposes since these toxins can be bio-accumulated by plants.
Anionic Surfactants
Table 2 shows the levels of anionic surfactants recorded in the monitored sites. The mean levels of anionic surfactants in the monitored sites ranged from 0.16 ± 0.17 to 1.03 ± 1.52 mg L-1. Many countries in the world, including South Africa, do not have regulations for anionic surfactants in aquatic ecosystems and agricultural waters. Anionic surfactants in surface waters typically range between 0.001 and 20 mg L-1 (Wang et al., 2015). The levels of anionic surfactants reported in this study were within this range during the sampling period. Even though the levels we reported in this study were relatively low, levels as low as 0.02 to 1.0 mg L-1 have been reported to significantly impact aquatic organisms since these compounds are known to alter cell membranes and promote the uptake of other contaminants.
Metals
The levels of metals in the irrigation water were monitored to evaluate the metals of importance in these highly disturbed aquatic environments and determine metallic elements of importance to study and monitor. The levels of metal species observed in the irrigation water in Table 3 were all within the acceptable limit set by DWAF (1996) and the Food and Agriculture Organization of the United Nations (FAO) and the World Health Organization (WHO) (FAO/WHO), (2007) in Chiroma and Ebewele (2014) for water meant for irrigation purposes.
Compositional Relation
Correlation matrices generated by PCA are and helpful in preliminary data reduction of parameters. Getting rid of variables assists with reducing costs for sampling collection and analysis, minimizing time and equipment required, and also excluding some redundant factors that may result in over-emphasis of the findings. Table 4 acknowledges the interactions and correlations between the monitored parameters (values marked with asteriks).
Spearman Correlation Matrix of the Parameters Monitored .

Correlation is significant at the .05 level (2-tailed). **Correlation is significant at the .01 level (2-tailed).
Principal Components
The results of principal components analysis for water samples are summarized in Tables 5 and 6 and Figure 3. The PCA monitored the physical and chemical parameters to help characterize the patterns and groups formed. The analyzed matrix consists of 20 principal components (PCs) representing the 20 physicochemical parameters monitored at seven different sampling points (two different sites: Hartbeespoort and Roodeplaat sites) over the four sampling events of the study. Table 5 shows that much of the total variance is explained by the first 3 PCs, PC1 (23.80%), PC2 (18.62%), and PC3 (14.80%), which account for 57.22% of the total variance.
Total Variance of Water Samples Explained by The Principal Components.

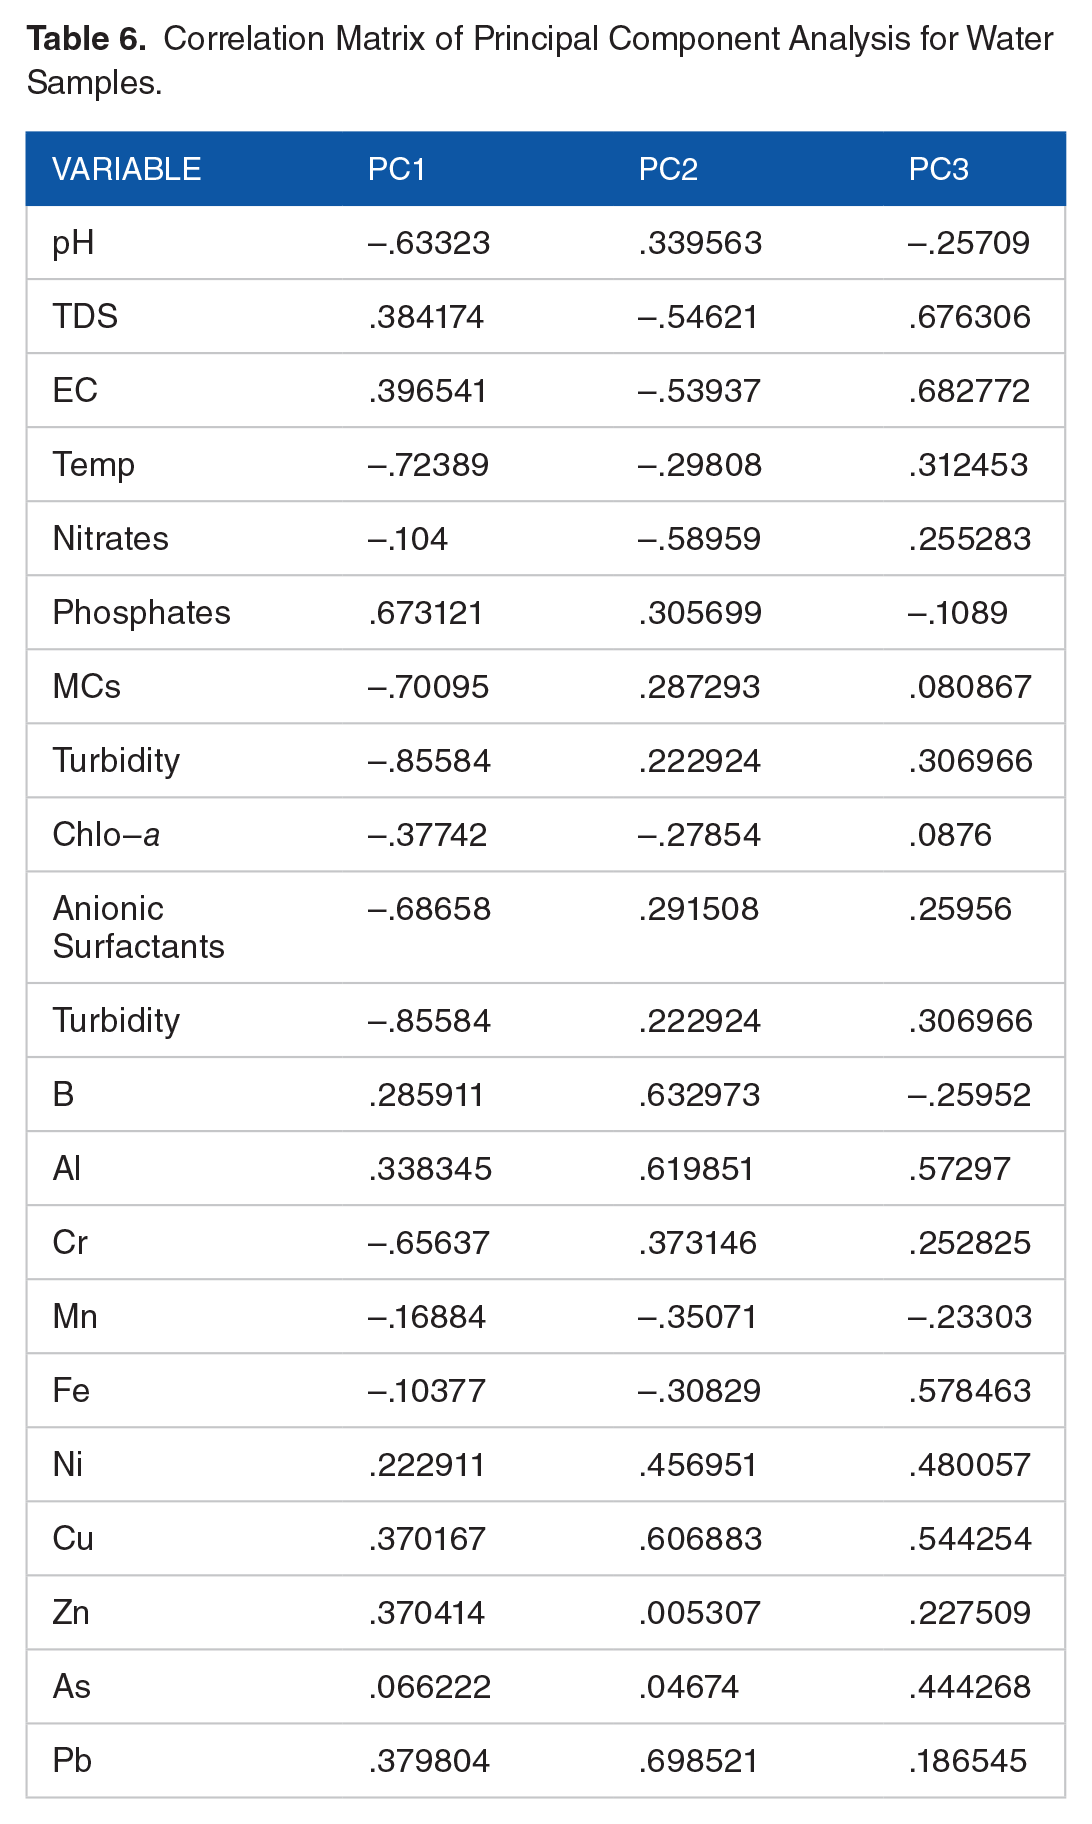
Correlation Matrix of Principal Component Analysis for Water Samples.

Result of the Principal Component Analysis (PCA) carried out on the physical and chemical variables monitored in water at the different sites throughout the study: (a) Loadings between variables and principal components PC1 and PC2; (bi & bii) Bi-plots showing the distribution of the sampling sites concerning their physical and chemical characteristics in the principal components plane PC1 X PC2.
The first principal component, as given in Table 5 and Figure 3a, has a variance (eigenvalue) of 4.761 is contributed by TDS, EC, phosphates, B, Al, Ni, Cu, Zn, and Pb, and only phosphates contributed more than 0.5. The second PC, PC2, has an eigenvalue of 3.723 and is mainly contributed by metals Pb, B, Al, Cu, and Ni. Other contributors to PC2 are pH, phosphates, MCs, anionic surfactants, and Turbidity. The bi-plots (Figure 3bi and bii) show that sampling points from the same dam site are located close to each other, indicating they have similar principal component scores. The bi-plots (Figure 3b) differentiate the two sampling sites with respect to the physicochemical characteristics. More specifically, sampling points from the Roodeplaat Dam site have relatively lower PC1 scores and somewhat higher PC2 scores.
The positive side of PC1 coordinates largely represents the Hartbeespoort sampling site characterized by high loadings of TDS, EC, and metals such as Pb, Cu, Al, and Ni. The negative side of the PC1 isolates largely the Roodeplaat site and is mainly characterized by high PC scores of pH, MCs, anionic surfactants, and turbidity.
When creating Water Quality Indices, one must choose parameters from the principal components created and selected. It is not the scope or intent of the current study to come up with a suitable Water Quality Index for the study areas or come up with variables of crucial importance but to suggest a few variables that can be representatives of the study area.
Based on the principal components reported here, selecting variables such as EC, TDS, and any one of the metals such as Pb, Cu, Al, and Ni seems adequate to understand the pollution statutes of the irrigation water derived from the Hartbeespoort Dam. Future long-term monitoring and development of a Water Quality Index for irrigation water can thus be suggested. For the irrigation water derived from the Roodeplaat Dam, use variables such as pH and turbidity, which could be adequate. Even though variables such as MCs and anionic surfactants were found to closely correlate with these two, their complexity to measure and the resources required make them less desirable.
Similar to our findings, Lukhabi et al. (2023) reported that Water Quality Indices in an African context prioritize chemical parameters such as heavy metals, followed by physical parameters and nutrients. Lukhabi et al. (2023) reported constraints in resources such as human capital, finances, and infrastructure as reasons for choosing these parameters.
Previous studies have applied PCA for water quality assessments and reliably reduced the number of variables. Similar to our application in this study, Ou et al. (2017) used PCA to study three- year water quality data for monitoring stations in Florida and managed to reduce the number of stations from 22 to 19. In another study, Iticescu et al. (2019) used similar multivariate techniques to study the Danube region, one of the largest basins in the European Union. From the 18 physicochemical parameters they studied, Iticescu et al. (2019) used PCA to establish the correlation between the variables, reduce the number of variables, and establish seasonal gradients in the data. In another related study, Zavareh et al. (2021) found atmospheric temperature, turbidity, and water temperature as the critical variables to represent the stream water quality of the Virginia, Maryland (U.S.A) watersheds.
All these studies discussed here demonstrated the applicability of PCA in establishing associations among variables, predicting the potential sources of pollutants and reducing the number of variables/datasets. However, it is important to mention that the use of PCA and other Water Quality Indices as suggested here, is limited to:
region specificity,
distortion in the event of extreme weather conditions such as excessive rains or temperatures,
episodic events such as oil or other pollutant spills or excessive discharges and
the existence of other emerging contaminants, such as pharmaceuticals, nanoparticles, etc., is not considered here.
Based on these findings, PCA was used to characterize the primary physicochemical data of this water catchment area and generate a set of new independent principal components. The PCA suggests that in these hyper-eutrophic and severely polluted water conditions, the monitoring of a few simple parameters such as TDS, EC, pH, and a few metals such as Pb, Cu, Al, Ni, and Cu can be adequate to understand the pollution status of the irrigation water being derived from these two dams.
Conclusion
The current study assessed the water quality of the irrigation water derived from the Hartbeespoort and Roodeplaat Dams. The two dams are found in the Crocodile (West) and Marico catchment which is renowned for its poor water quality and hyper-eutrophication levels. The irrigation water was found to exceed the permissible guidelines for parameters such as pH, EC, TDS, and nitrates. Other eutrophication-related parameters such as MC levels, chlorophyll a, and anionic surfactants were also found to be relatively high, even though there are no guidelines for these in irrigation water locally. The study also used principal component analysis (PCA) to evaluate these highly contaminated water bodies in a bid to come up with a few principal components and variables that can be monitored routinely but still represent all the other variables of concern in these waters. Using this statistical technique, the most representative variables for the Hartbeespoort Dam-derived waters were EC, TDS, and any of the metals such as Pb, Cu, Al, and Ni. For the Roodeplaat Dam water, variables such as pH and turbidity were deemed adequate. The use of such parameters can be applied to develop a custom-made Water Quality Index (WQI) that can be used to monitor and assess the human impact on the irrigation water derived from these two dams. The use of such a technique to assess the water quality of such anthropogenically polluted waters can be very essential, particularly in developing countries such as South Africa, where resources, equipment, and skilled manpower could be lacking. Such WQIs can be easy to carry out since they will not need the monitoring of variables such as MCs and anionic surfactants, which require sophisticated and costly assays/techniques. Such narrowing of the parameters required to assess water quality can prove to be resource-saving and accurate, but they hugely rely on the catchments being studied and the expertise of selecting the indicator variables/parameters.
Footnotes
Acknowledgements
The authors are deeply indebted to the personnel at the Department of Water Affairs, Resource Quality Services (Roodeplaat Dam office), and the Hartbeespoort Irrigation Board for assistance with sample collection and access to the study sites.
Author Contributions
GP: Conceptualization, Methodology, Data curation Roles/Writing—original draft; Writing—review & editing, Investigation; Methodology. SS: Conceptualization, Methodology, Data curation Roles/Writing—original draft; Writing—review & editing, Investigation; Methodology. WG: Conceptualization, Data curation Roles, Supervision; Funding acquisition; Investigation; Resources; Writing—review & editing. RM: Conceptualization, Data curation Roles, Supervision; Funding acquisition; Investigation; Resources; Writing—review & editing.
Declaration of Conflicting Interests
The author(s) declared no potential conflicts of interest with respect to the research, authorship, and/or publication of this article.
Funding
The author(s) disclosed receipt of the following financial support for the research, authorship, and/or publication of this article: Funding for this study was granted by the South African, Water Research Commission (WRC) Project No: K5/2972 and the National Research Foundation (NRF), through the NRF Postdoctoral Fellowship Award: PSTD2204234440.
Data Availability
All datasets used in this study are available upon reasonable request from the corresponding author.