
Abstract
This study deals with the effects of flooding on alluvial soils and riparian forests in the basins and sub-basins of southern Québec (Canada). These riparian environments are sensitive to hydroclimatic variations, which may increase with current climate change, which is why it is important to analyse them. The study areas were divided by flood frequency based on government maps that show flood recurrence intervals of 0 to 20 years and 20 to 100 years. Woodlands located outside of the floodplains were also analysed for comparison to measure and better determine the effect of floods on soils and forest stands. Soil depletion is found in the frequent-flood zones (FFZ), which results in lower total organic carbon (mean values of 1.9%-3.7% in FFZ vs 3.2%-5.9% in no-flood zones [NFZ]) and total nitrogen (mean values of 0.1%-0.2% in FFZ vs 0.2%-0.3% NFZ). Field observations and measurements show that the aboveground biomass (plant litter) is reduced or absent from the active flood zones. The structure and composition of tree stands are relatively comparable from one zone to another, but a slightly lower rate of small (5-10 cm dbh [diameter at breast height]) and intermediate (10-15 cm dbh) trees can be noted in FFZ, and tree diversity (Shannon index) and species richness are also slightly lower. The mechanical action of water in trees during floods and the burial of seedlings through the accumulation of fine alluvial deposits could negatively impact forest regeneration in active floodplains.
Introduction
In the current context of climate change, there is increasing interest in the effects of hydroclimatic variations on soils and forest floodplains.1-4 The alluvial soils and composition of riparian vegetation are largely a function of hydrological flow regimes and the various disruptions associated with such regimes.4-6 Alluvial soil development is subject to erosion and sedimentation cycles that alter soil and pedogenesis processes. 7 Floodplain vegetation communities are also thus largely affected by their tolerance to water stress and their capacity to maintain and regenerate following flood events.5,8 Riparian vegetation develops according to hydrological and edaphic conditions, which are in part affected by fluvial geomorphology, slopes and substrate (surface roughness), riverbank height, and all other disruptions associated with the hydrological regime.9,10 Fluvial erosion caused by successive floods may alter the soil’s nutrient cycling and affect litter production, while simultaneously modifying the plant cover.11-13 These changes may result in soil depletion and negatively affect nutrient accumulation and other soil properties. It is known that concentrations of organic carbon and nitrogen, which mainly result from the decomposition of plant residues, are critical to soil quality and fertility.14,15 Frequent flooding may adversely affect the accumulation of ground biomass and soil development and, as a result, modify soil processes and geochemical cycles. 16 Soils that play a crucial role in global C and N cycles are key to the proper functioning of terrestrial ecosystems, in addition to constituting significant carbon reserves.17,18
Frequent floods and heavy flooding also negatively impact the vitality of floodplain forests.12,19 For instance, heavy floods can cause damage to and destroy trees while limiting the establishment of certain species.11,13 The recruitment rate of tree seedlings can also be affected by frequent floods. 20 The flood regime and sediment mobility are responsible for the configuration of floodplains, edaphic conditions, and soil properties,4,21 with each species reacting differently to these dynamic river environments. Forest populations vary depending on soil and sediment properties, as well as microtopography and elevation, which are gradually shaped by successive floods.1,5,11 In this respect, each species reacts differently to these various conditions. For instance, during major flood events, some tree species will more quickly take advantage of open spaces to become established,11,22 whereas Fraxinus pennsylvanica and Acer rubrum will be more competitive (eg, high production of samaras) than other species for colonizing open spaces in large floodplains,8,22 and some species adapt well to inundated zones.13,19 It can be noted, moreover, that the distribution pattern of riparian forest stands is often structured based on flood frequency, thus favouring a vegetation mosaic and plant diversity.23,24 A dynamic change in the forest cover may occur along longitudinal and lateral gradients in floodplains based on flood intensity and frequency.10,12 A change in the hydrological regime, in particular an increase in flood frequency, requires vegetation to once again adapt to these new conditions.25,26
The study area covers the lower portion of the Coaticook and Massawippi rivers and the middle portion of the Saint-François River (Southern Québec, Canada). The aim of this study is to better understand the dynamics of the forest populations and soil development affected by frequent flooding, especially in recent decades, and which take the form of an increase in the flood frequency in southern Québec.27,28 The soil study and the dynamics associated with these forest systems are based on an analysis of aerial photographs (since 1945), which are used to monitor changes to these riparian environments. This analysis shows a recovery of the forest cover after the 1950s for most of the study areas (eg, Coaticook, Massawippi, Richmond, and Windsor), and the forest recovery took the form of an extension and densification of the forest cover easily visible along the floodplains or near riparian areas. Specifically, the aim of this study is to (1) measure the effects of floods on alluvial soils and the composition and structure of tree communities in the areas affected by successive flooding; (2) analyse the soil properties (eg, soil acidity, soil organic carbon, total nitrogen, particle size) of alluvial and nonalluvial soils; and (3) compare tree stands (composition and structure) in alluvial plains with those outside of the floodplains. Other environmental variables, including soil conditions (eg, drainage, slope%), complete the analysis of the riparian environments.
Methods
Study area description
The study area is located in the south central Québec watershed and extends from the south shore of the Saint Lawrence River to northern Vermont in the United States (45°49″-45°17″ N; 71°50″-71°19″ W; Figure 1). This drainage basin has an average altitude ranging from 304 to 762 m, with the higher altitudes located on the US side (Adirondack Mountains). The Saint Lawrence Lowlands and the Appalachian Mountains are the 2 major physiographic divisions that characterize this large drainage basin. 29 Several rivers in this large basin are subject to frequent and heavy flooding. The Coaticook, Massawippi, and Saint-François rivers, in particular, may experience flooding every 2 to 4 years (Table 1), depending on snow and rain conditions. This increase in floods is attributed to the clearing of forests to make way for farmland, 29 as well as an increase in precipitation in the last century. 33 An increase in flood frequency has in fact been noted over the last decades, especially since the 1970s.27,28 The Coaticook, Massawippi, and Saint-François rivers 32 can attain a mean annual discharge of 10, 11, and 205 m3/s, with peak discharges of 227, 135, and 2719 m3/s, respectively (Table 1). The hydrological data indicate that floods can be frequent but usually of a short duration (ie, a few days). This region is characterized by a humid continental climate with an average annual precipitation of 1113.5 mm, with deviations varying depending on the time of year.29,34 The average annual temperature recorded between 1981 and 2010 was 6.4°C, with highs in July (monthly average of 20.9°C) and lows in January (monthly average of −10.2°C). All the areas that were studied were found to have roughly the same climatic conditions. 34
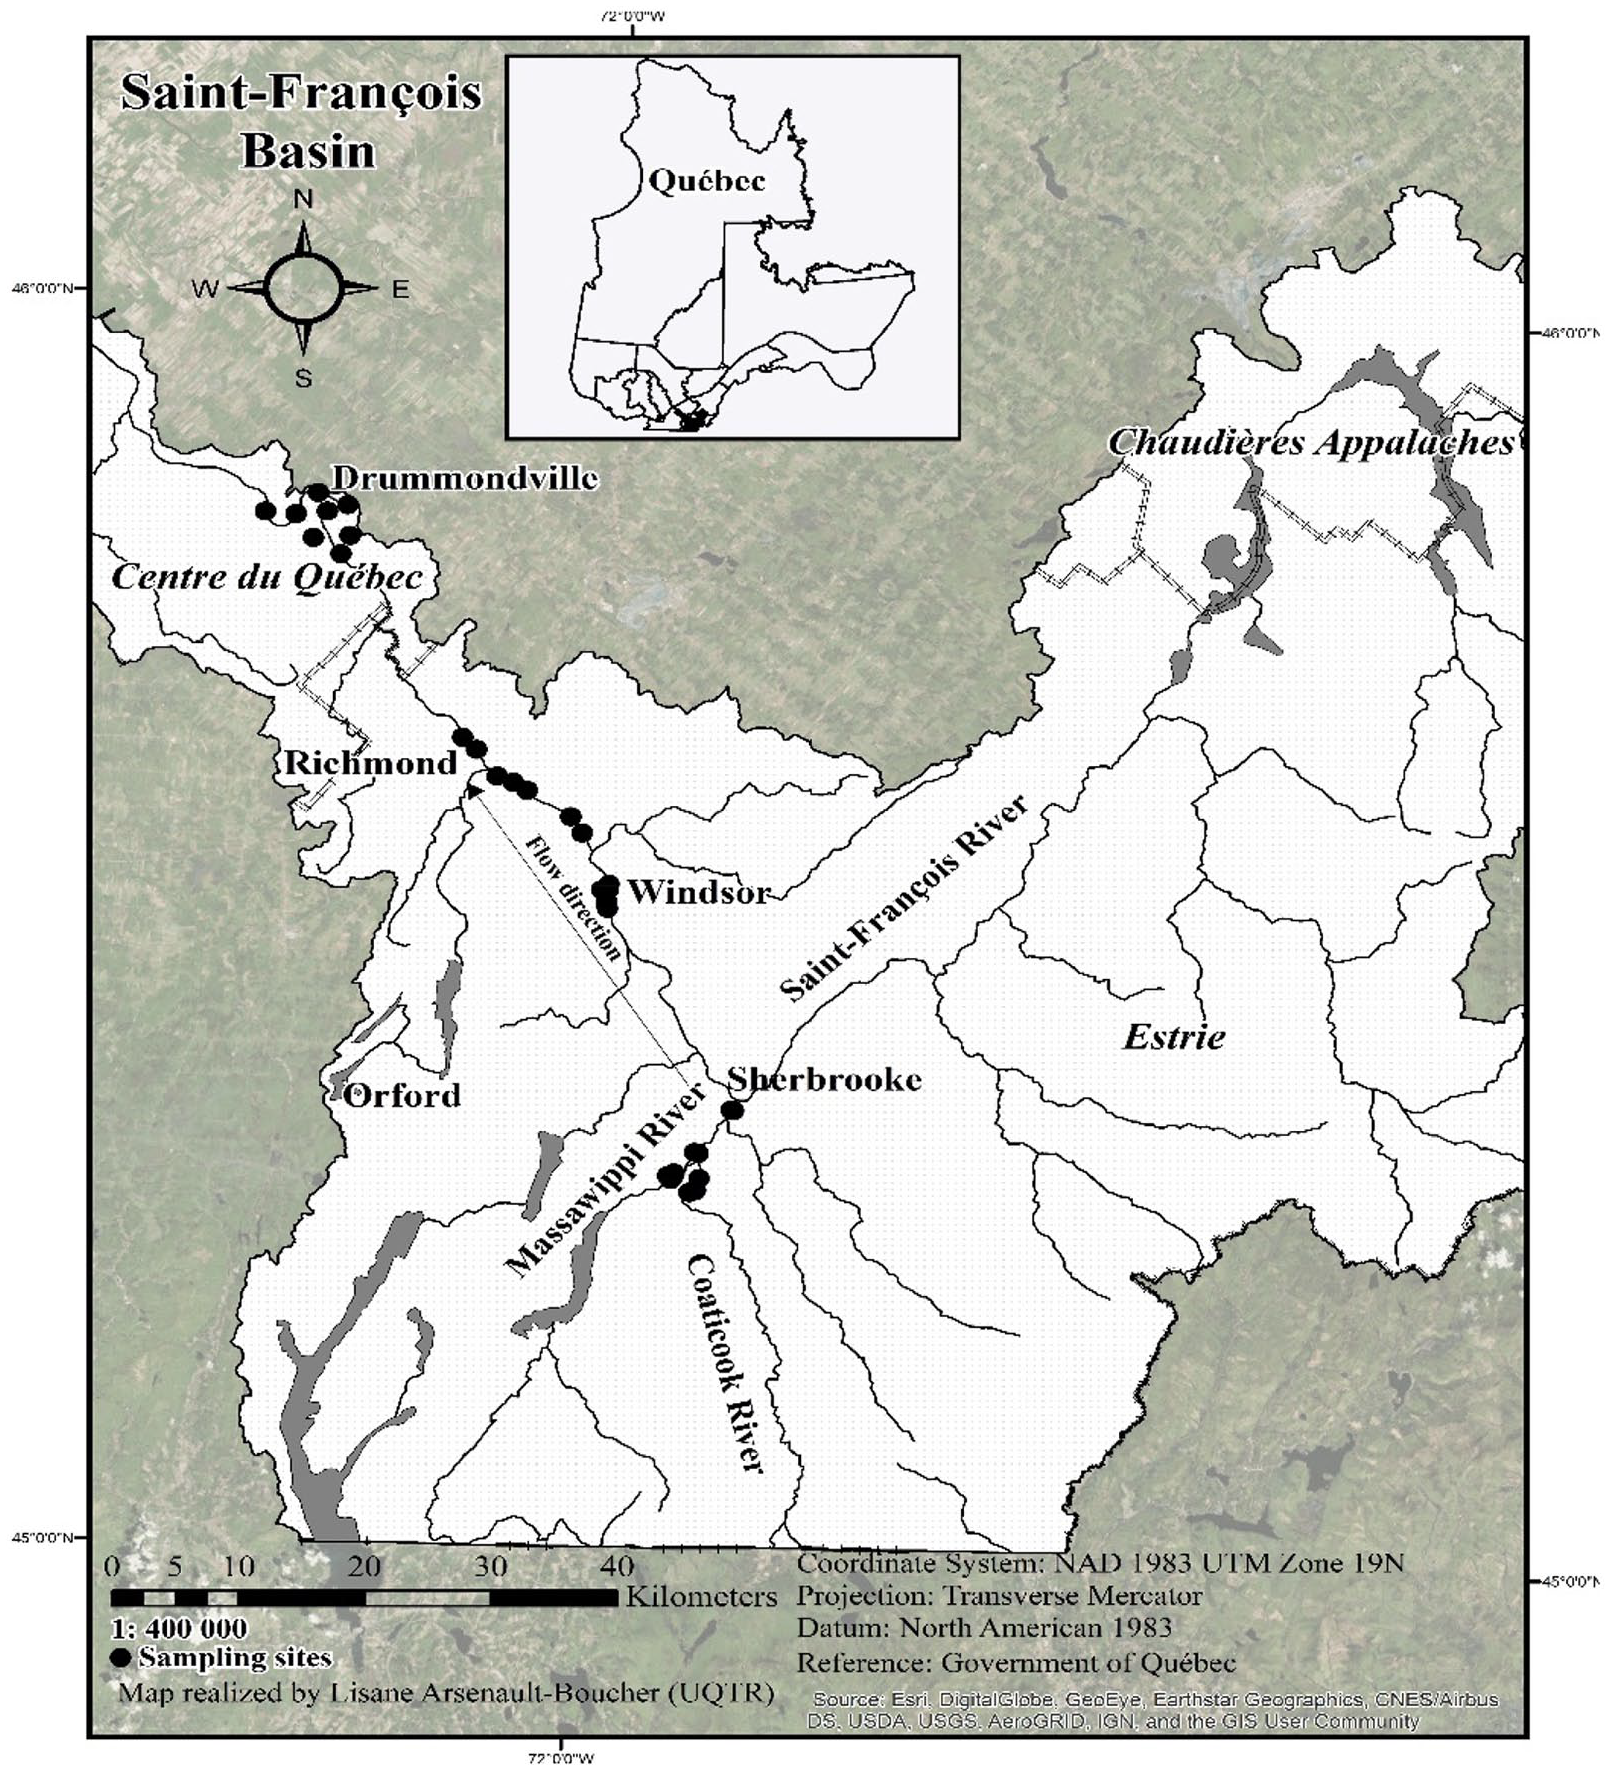
Location of sampling sites (total of 143) along the Coaticook, Massawippi, and Saint-François rivers in the watershed basin in southern Québec, Canada. The sites are distributed in the 2-floodplain zones (flood recurrence intervals of 0-20 years and 20-100 years) and outside the floodplains (no-flood zones).
Hydrological data of the Coaticook (COA), Massawippi (MAS), and Saint-François (STF) rivers, southern Québec, Canada.

Conseil de gouvernance de l’eau des bassins versants de la rivière Saint-François, 29 Ministère de l’Énergie et des Ressources naturelles du Québec. 30
Ministère des Richesses naturelles du Québec. 30
Centre d’Expertise Hydrique du Québec. 32
Compilation by the authors.
Large plains or low terraces made up of recent alluvial sediments can be seen along riverbanks. Glacial deposits, glaciolacustrine sediments, or reworked glacial tills are found at higher elevations. 29 With respect to the river terraces, the floodplain soils are categorized as Aquents (Gleysol) and Entisols (Regosol), whereas the nonalluvial soils are mainly characterized as Inceptisols (Cambisol) or Spodosols (Podzols).31,35 Forests are mainly found along riverbanks and characterized by stands of black and red ash (Fraxinus nigra Marsh., F pennsylvanica Marsh.) and red maple (A rubrum L.). The areas outside the floodplains are mainly characterized by mixed stands made up of sugar maple (Acer saccharum L.), red maple (A rubrum L.), balsam fir (Abies balsamea Mill.), and hemlock (Tsuga canadensis L.). 36 The region was subject to intensive logging, especially between the 1880s and 1920s. The current mixed forests are relatively recent (young to intermediate), with a small contingent of old trees.
Field sampling
Sampling was performed from June to September 2011, 2012, 2016, 2017, and 2018, along the riverbanks of the Coaticook and Massawippi rivers (downstream) and the Saint-François River (middle section). The tree stands were first selected through the analysis of aerial photographs using Geomatica software and Google Earth images to exclude sites affected by human activity (eg, trails, partial cuts). Woodlands in the largest areas were favoured to obtain maximum diversity. The tree stands were distributed along a transversal gradient (transect perpendicular to the bank) in wooded areas and spread out through the flood zones, ie, 2 flood risk zones: (1) zones with a flood recurrence interval of 0 to 20 years (frequent-flood zones [FFZ]); (2) zones with a flood recurrence interval of 20 to 100 years (moderate-flood zones [MFZ]); and (3) zones outside the floodplains (no-flood zones [NFZ]). The boundaries of each zone have been determined based on official flood risk maps (scale of 1:10 000) produced by Environment Canada and the Quebec Ministry of the Environment, and municipal land development plans.32,37 The flood risk maps are based on flood frequency, flow rates, and floodplain elevation, which allows for a precise flood gradient between the flood zones and NFZ. These government maps were developed to serve as a planning tool for municipalities facing a flood risk. The flood maps enabled a good distribution of tree stands (143 in total) to be established along the rivers. The tree stands are distributed as follows: 49 tree stands in the Coaticook sector (COA); 31 stands in the Massawippi sector (MAS); and 63 stands in the Saint-François sector (STF) (see also Supplemental Appendix).
Soil sampling
For soil sampling, the Canadian System of Soil Classification criteria were used in the field. 38 Litter thickness, drainage, soil texture and structure, and Munsell colour were noted. Soil samples were collected with an open-face soil auger at a depth of 0 to 20 cm in each tree stand and analysed in the laboratory to characterize their textural composition and chemical properties: acidity (pH), total organic carbon (TOC%), and total nitrogen (TN%). For the particle size analyses, the dry sandy fraction (>2 mm) was obtained by sieving, and the fine particles (<2 mm) were analysed using a laser particle sizer (FRITSCH ANALYSETTE 22 MicroTec Plus), based on an interval class ranging from 0.08 to 2000 µm. The texture classes are those found in the Canadian System of Soil Classification 38 and correspond to those of the Food and Agriculture Organization-United States Department of Agriculture (FAO-USDA) international system. 31 Chemical analyses involved determining the pH in CaCl2 (0.01 M) using a 1:2 soil-solution ratio, 39 and the total organic carbon and total soil nitrogen were determined with a TruMac Series (Leco) analyser. For the characterization of the biomass (plant litter), measurements of the litter thickness were made at each tree stand (each corner of the stands) using a graduated metal ruler (a total of 272 measurements). In addition, data on microtopography, slope (%), drainage class, and surface soil texture were recorded.
Tree stands
Tree stand measurements were made from 2011 to 2018 (summer and fall), and all the geographical coordinates for the sites were recorded on digital maps using GPS points (Universal Transverse Mercator [UTM] coordinates) measured directly in the field. In addition, several digital photographs were taken at each tree stand. Vegetation data were collected in tree stands with a surface area of 10 m × 20 m. The forest stand inventory includes the identification and number of tree species, and their diameters at breast height (dbh; in cm), including tree core samples for large-diameter specimens. Tree stratum data sampling was performed for each stand to identify the species,40,41 with each tree being measured 1.3 m from the ground. Trees more than 1 m in height were included in the total number of trees in each stand. The diameter of the tree species was measured with a circumferential tape (Forestry Supplies Inc, Jackson, MS), and the structure and basal area (BA) 42 of the trees were measured based on the total number of stems for each species per surface unit (200 m2). A total of 4397 trees were measured and identified in all the tree stands (see Supplemental Appendix for more details on tree stand distribution by zone and sector).
Tree ring analysis
The tree ring analysis was performed on the largest tree specimens across the 2 flood recurrence zones, as well as outside the flood zones. Breast height increment cores (using Haglöf Sweden borer model/5.15 mm) were taken at dbh (1.3 m) to determine the age of the largest trees. 43 One to 2 specimens was selected in each tree stand to obtain the age of the oldest individuals. Only healthy trees showing normal growth were sampled. In the laboratory, the tree core samples were numbered and dried on wooden stands, whereas the slices were air-dried. Once dried, the samples were sanded and polished with glass paper (coarse to fine) and a translucent stain was applied to the samples to make the tree rings easier to read. In the laboratory, the annual growth rings were counted using a binocular loupe (40×) and Velmex micrometers (0.001 mm). 44 The tree ring specimens were counted at Université Laval’s Laboratory of Dendrochronology (Québec, Canada). A total of 146 tree cores were used to determine the age of the selected trees.
Statistical treatment
Descriptive statistics were calculated for all the data (eg, soil properties, stems, tree diameter, basal area), and various statistical analyses and tests were applied to the soil and vegetation variables. A logarithmic transformation was used for the data matrix for the statistical tests (eg, Shannon index, Tukey test).45,46 Soil properties such as total organic carbon content (TOC%), total nitrogen (TN%), C:N ratio, pH, textural classes, and soil litter measurements were compiled in Excel files for statistical analysis processing. A logarithmic transformation was also applied to the soil variables to standardize the data. A 1-way analysis of variance (ANOVA) was used to compare the soil variables and identify significant values based on the 3 zones that were studied (FFZ, MFZ, and NFZ). Tukey honestly significant difference (HSD) test was then used to determine the significant differences between all the soil variables. The Shannon diversity index and ANOVA were used to assess the diversity of the tree species and the species richness of the tree populations based on the 3 zones (FFZ, MFZ, and NFZ). Constrained correspondence analysis (CCA) was used to determine the influence of the environmental variables on species composition. In total, 9 environmental variables were analysed (pH, TOC%, TN%, C\N, Clay%, Silt%, Sand%, Litter, Zone), but only 4 variables (pH, Clay%, Silt%, Zone) were significantly related to the modifications to species composition based on backward selection using a permutation test (1000 repetitions). Another permutation test (2000 repetitions) was also performed to determine which CCA axes were significant. The first 2 axes account for a total of 10.4% of total deviance (ie, variability in the communities). Processing and analysis were performed using R statistical software 45 and a vegan package 46 for vegetation. A confidence interval of 95% (P = .05) was applied for the statistical analysis.
Results and Discussion
Soil properties
Soil data analysis shows significant differences between alluvial and nonalluvial soils (Table 2 and Figure 2). The pH values obtained for the subsurface soils (0-20 cm in depth) indicate differences between the 3 zones (FFZ, MFZ, and NFZ; Figure 2A). The NFZ soils had the highest acidity levels with the average values of 3.60 to 4.21, compared with those of 4.69 to 5.16 and 4.28 to 4.49 for the FFZ and MFZ soils, respectively (Table 2). The most acidic soils are found in the NFZ with a minimum value ranging between 2.66 and 3.18 (pH). The Tukey HSD test confirms a significant difference for each of the 3 zones (FFZ vs NFZ: P < .001; MFZ vs NFZ: P < .046; FFZ vs MFZ: P < .001). The ground biomass (plant litter), which is substantially greater in the NFZ, may be contributing to soil acidification through a greater input of organic matter. The biomass decomposition process produces organic acids with an effect on surface soil pH levels. 15 The average value of litter thickness in the NFZ is 3.69 cm, compared with 1.10 and 1.75 cm in the flood zones (Figure 2A). The differences observed in litter thickness for the 3 study zones are confirmed by statistical analysis, which provides significant values between the FFZ and NFZ (P < .000). This absence or virtual absence of litter that is attributable to successive floods results in surface soil depletion that generates a reduction in the nutrient input, making the soil less fertile. Low soil fertility can hinder tree establishment and affect succession dynamics. 47 The total organic carbon (TOC%) content in soils is also relatively low in flood zones. The mean TOCs in the surface of alluvial soils range from 1.9% to 3.7% (FFZ) and 3.02% to 3.2% (MFZ), and the values range from 3.2% to 5.9% for the NFZ soils. The Tukey HSD test results show that there is a significant difference (P < .000) between the FFZ and NFZ regarding TOC% of the subsurface soils. These concentrations are higher in the NFZ than in the flood zones (Figure 2B). With respect to the total nitrogen content (TN%), a significant difference is also observed between the FFZ and NFZ soils. The mean content obtained for alluvial soils is 0.2% (FFZ) and 0.1% (MFZ), compared with 0.3% for NFZ soils (Table 2). The statistical analysis shows that TN% concentrations in the NFZ differ significantly from the other values obtained for the floodplain soils (P < .001). The values obtained for the C:N ratio reflect also what is obtained for each zone, with mean values varying between 12.86 and 28.90.
Chemical and physical properties of alluvial and nonalluvial soils.

Abbreviations: COA, Coaticook; FFZ, frequent-flood zones; MAS, Massawippi; MFZ, moderate-flood zones; STF, Saint-François; TN, total nitrogen; TOC, total organic carbon.
Soil samples (0-20 cm in depth) collected in tree stands.
Textural classes determined by Canadian System of Soil Classification. 38

Soil properties in subsurface soils (0-20 cm) according to the flood zones (FFZ, MFZ) and no-flood zones (NFZ): (A) pH and litter thickness (cm), (B) TN (%) and TOC (%), and (C) sand (%) and silt (%). FFZ indicates frequent-flood zones; MFZ, moderate-flood zones; TN, total nitrogen; TOC, total organic carbon.
Regarding texture, most of the soil samples analysed in the flood zones are made up of fine material, mainly fine sandy loam, loamy fine sand, and loam with high concentrations of silt and sand particles (Figure 2C). These fine textures are in fact a common feature of flood deposits.16,48 The percentages obtained range between 39.7% and 60.2% (silt) and 36.6% and 59.4% (sand) in FFZ, and 48.0% and 63.4% (silt) and 33.0% and 50.1% (sand) in MFZ. For nonalluvial soils, the values range between 41.3% and 58.2% (silt) and 38.1% and 56.9% (sand), although greater textural variability can be observed, ranging from coarse sand to finer sediment (sand, sandy loam, and loamy sand). This variability is explained by the diversity of the superficial deposits (eg, moraines and meltwater features) found outside the floodplain zones. In fact, it is not unusual to find gravel and pebbles in the matrix of these soils. However, the ANOVA did not reveal any significant differences in texture between the flood- and no-flood-zone soils. The dominant matrix mainly consisted of sand and silt with a very small proportion of clay.
In short, a significant difference was noted between alluvial and nonalluvial soils. The FFZ soils generally have a lower carbon and nitrogen content, and their ground biomass (plant litter) is not as thick as that of NFZ soils. If these conditions are maintained (more frequent floods), they may have an unfavourable effect on soil fertility and quality. A marked reduction in ground biomass can be noted, which contributes to soil depletion (eg, lower carbon and nitrogen content), thus affecting the input of nutrients for seedlings, for instance, which are often dependent on a sufficient input of nutrients to meet their growth requirements during the first few years.49,50
Recent work in the Richmond sector of the Saint-François River basin51,52 and other areas of the same basin 53 shows similar results, namely, that alluvial soils affected by frequent floods have lower organic carbon and nitrogen content. The surface horizons (0-20 cm), like the deeper horizons (60-100 cm), are characterized by lower C and N content explained by the marked absence of ground biomass and little input of organic carbon in flood sediments. Other work also shows that soils subjected to frequent floods in floodplain forests have lower organic carbon content and litter is virtually nonexistent, which contributes to depriving the soil from organic input.53-55 The study by Qin et al 56 mentions that ‘the surface soil of some low riparian woodlands is vulnerable to erosion from the periodic floods, which can wash away soil litter and thus affect accumulation of SOC’. In these highly dynamic environments, the combined effects must therefore be considered between fluvial erosion that erodes the soil surface and sediment input, which has the effect of rejuvenating the soil by superimposing different sediment layers.
Besides the insufficient input of nutrients in the soils of active floodplains (FFZ), there are also the mechanical effects of floods which can not only contribute to the uprooting of seedlings due to current speed, but also cause them to be buried through the inflow of sediment deposited when flood waters recede (Figure 3). Also, it was noted that in FFZ herbaceous plants such as ostrich fern (Matteuccia struthiopteris) and stinging nettle (Urtica dioica), which densely populate the alluvial plains, may hinder the regeneration and survival of young tree stems, which are choked by the dense deployment of leaves and the lack of sunlight. 16 The lack of space and sunlight creates conditions that are not favourable to the germination of seedlings, which require a minimum number of years of growth to develop their root system and survive in their environment. The regeneration of the tree stratum in disrupted environments requires a certain degree of stability and a sufficient establishment period to enable the seedlings to survive. 50

(A) Accumulation of fine alluvial sediments (silt and sand) deposited during the flood recession (August 2011, Q48, STF/right bank). (B) Presence of ostrich ferns (Matteuccia struthiopteris) lying on the ground by flood current. Flood and sediment supply are detrimental to the maintenance and survival of tree seedlings. Young trees may also be damaged by floods.
Tree population
Table 3 presents the dominant tree species inventoried in the flood zones (FFZ, MFZ), NFZ, and sectors (COA, MAS, and STF) (see Supplemental Appendix for a compilation of all the tree species). Balsam fir (A balsamea) is the dominant species (794 individuals) for all the tree stands, followed by ash (F nigra and F pennsylvanica), maple (A saccharum and A rubrum), yellow birch (Betula alleghaniensis), and eastern hemlock (T canadensis). Roughly the same species are dominant in the FFZ, although B alleghaniensis and Thuja occidentalis are under-represented in the STF sector. Ash (F nigra and F pennsylvanica), balsam fir (A balsamea), maple (A rubrum and A saccharum), black cherry (Prunus serotina), and blue beech (Carpinus caroliniana) are also dominant in the MFZ. Finally, balsam fir (A balsamea), red maple (A rubrum), and eastern hemlock (T canadensis) are dominant in the NFZ. In the COA sector, there are a large number of A balsamea, F nigra, and T occidentalis in the FFZ, whereas F pennsylvanica is the most dominant species in the STF sector.
Spatial distribution and stem number (n/200 m2) of the dominant tree species in all tree stands.

Abbreviations: COA, Coaticook; FFZ, frequent-flood zones; MAS, Massawippi sector; MFZ, moderate-flood zones; NFZ, no-flood zones; STF, Saint-François.
Table 4 lists the characteristics of the tree stands based on the flood zones and NFZ. Balsam fir (A balsamea) is the dominant species for all sites and sectors. It is heavily represented (441 individuals) in the NFZ, with a relative frequency of 10%. This species also occurs frequently in the FFZ, with a relative frequency of 6%. F nigra and F pennsylvanica are also present everywhere in the flood zones, with the values of 5.2% and 6.2% (FFZ) and 2.2% and 1.7% (MFZ), respectively. T occidentalis is also a species found in FFZ, with 190 individuals (4.3%), compared with 96 (2.2%) for the NFZ. However, it is virtually absent from MFZ, where only about a dozen individuals were inventoried. The statistical analyses on tree stands regarding diversity and species richness do not reveal any significant difference between the 3 zones that were studied (FFZ, MFZ, and NFZ), although the FFZ visually have a slightly lower number of tree species than the other 2 zones (Figure 4). For species diversity (Shannon diversity index), a P-value of .341 was obtained compared with a P-value of .155 for species richness (confidence interval of 95%).
Data on tree population in flood zones (FFZ, MFZ) and no-flood zones (NFZ).
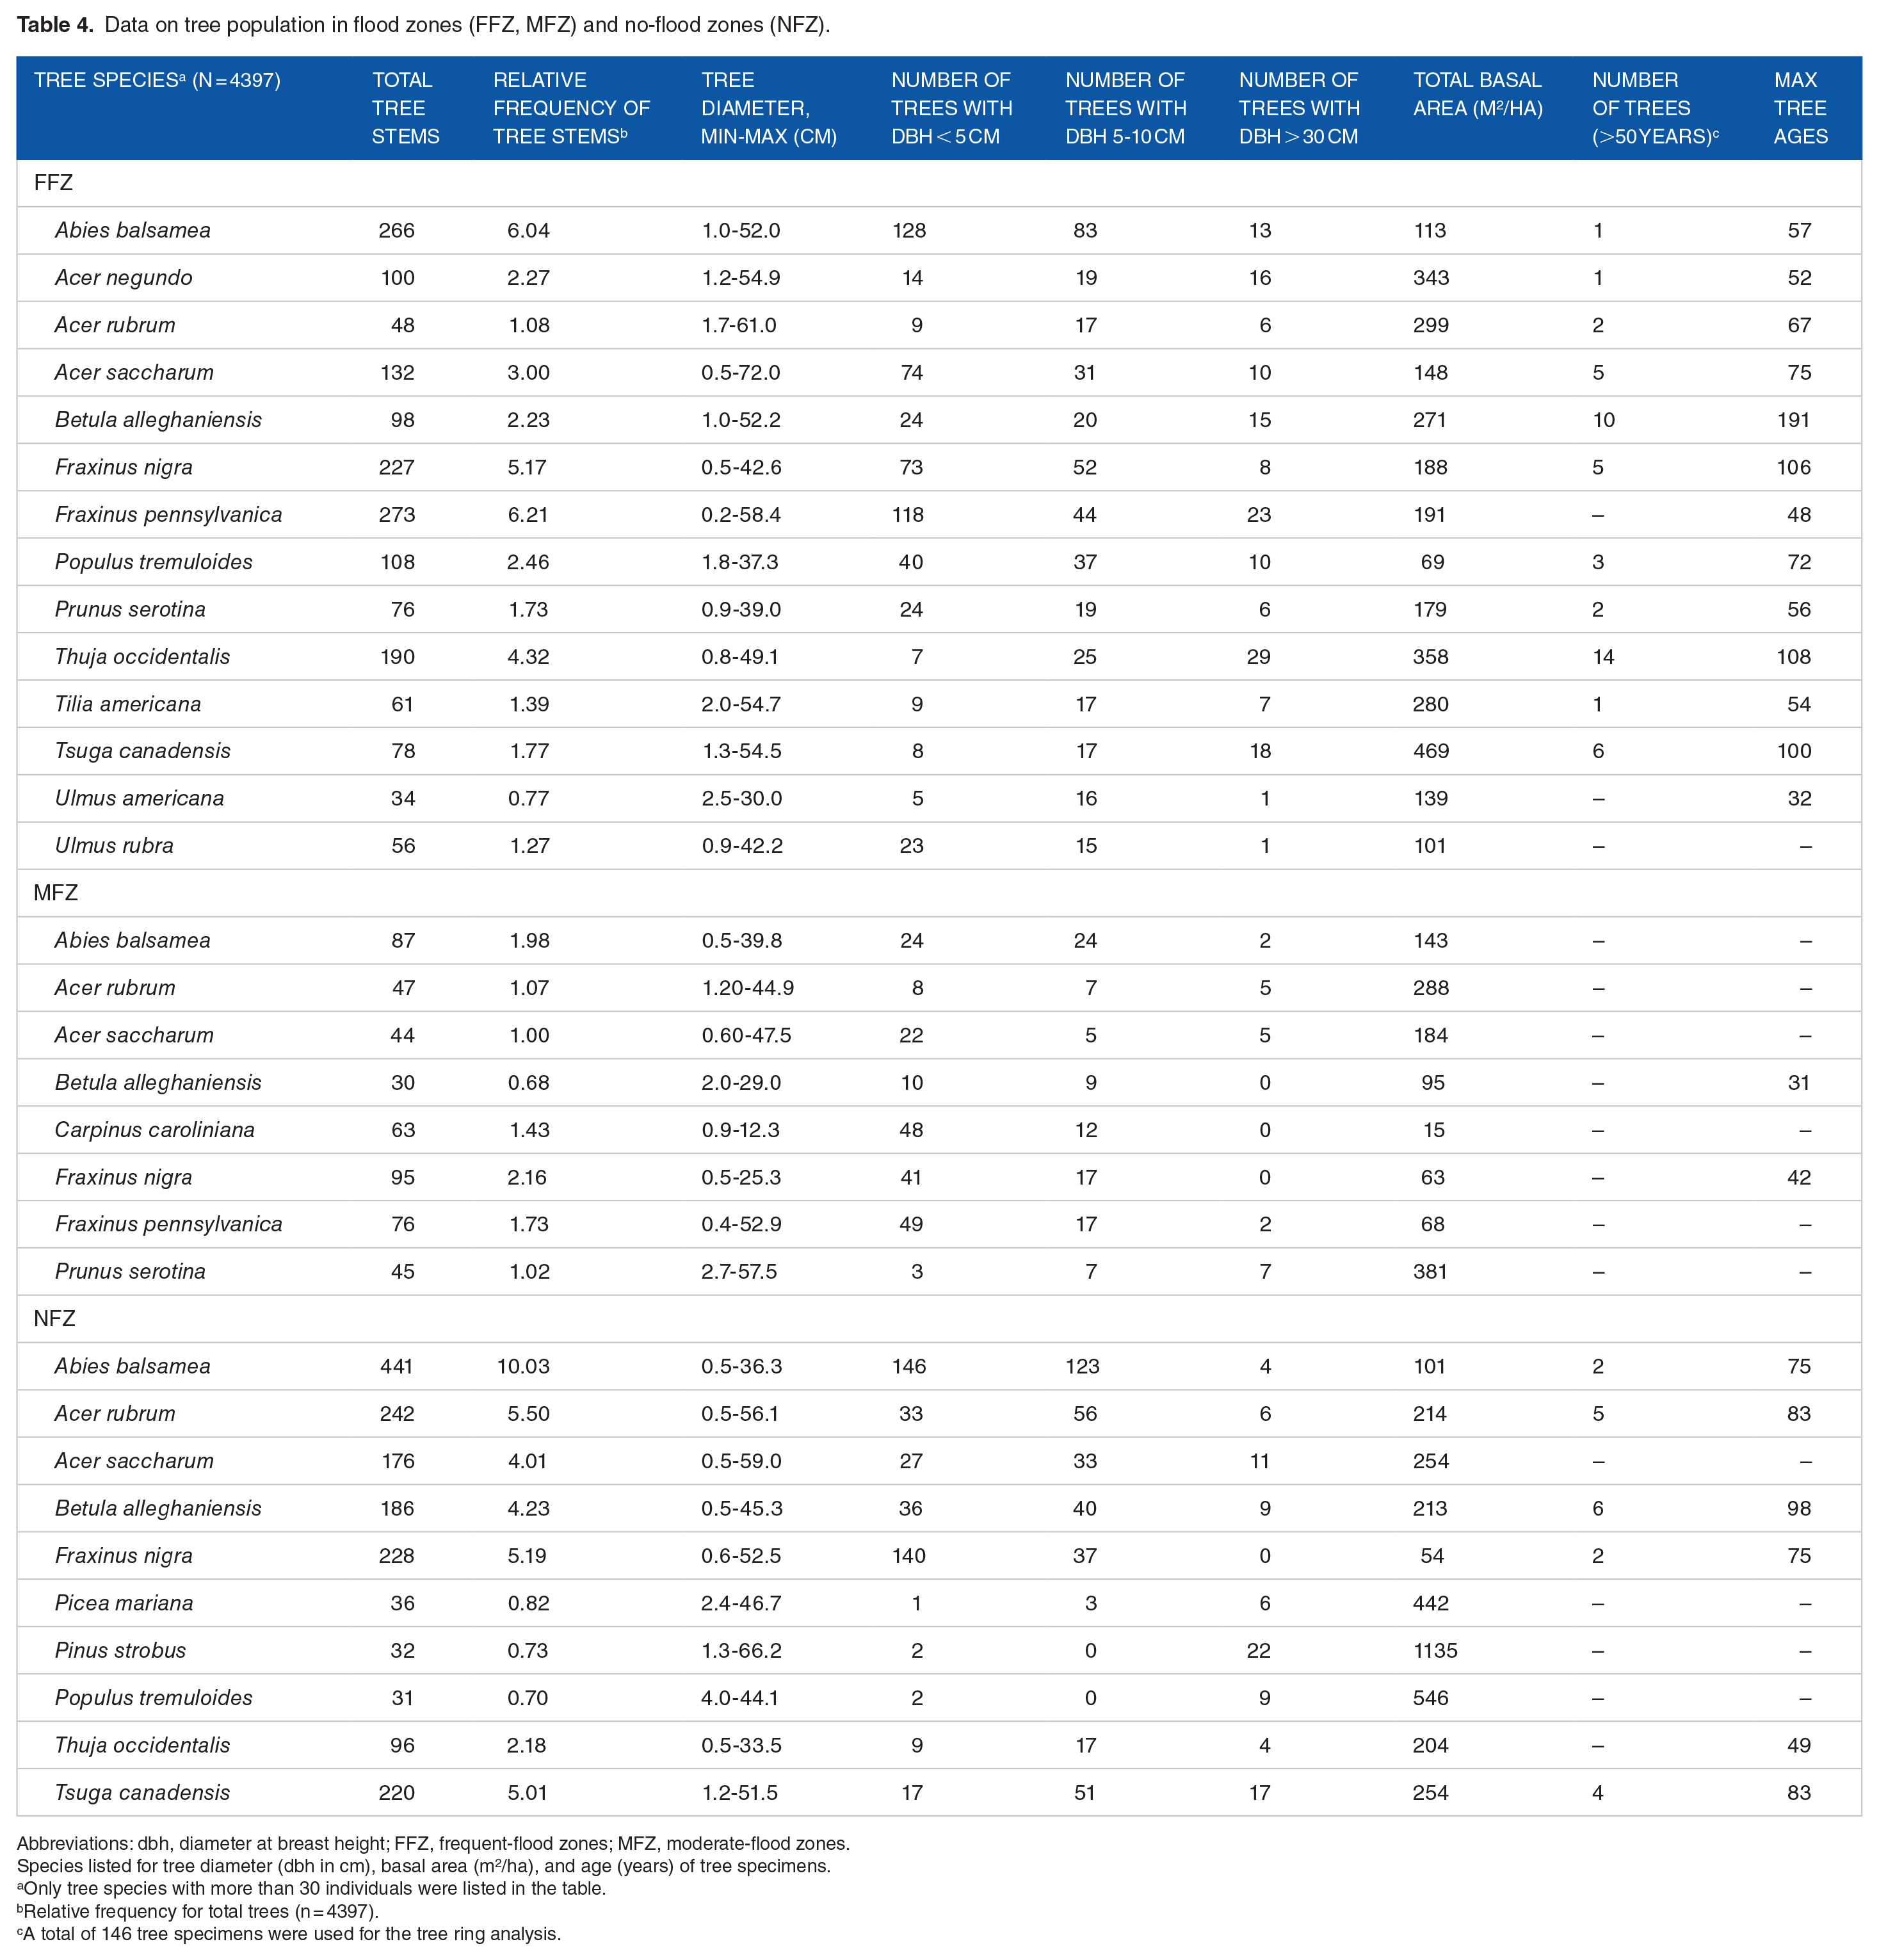
Abbreviations: dbh, diameter at breast height; FFZ, frequent-flood zones; MFZ, moderate-flood zones.
Species listed for tree diameter (dbh in cm), basal area (m2/ha), and age (years) of tree specimens.
Only tree species with more than 30 individuals were listed in the table.
Relative frequency for total trees (n = 4397).
A total of 146 tree specimens were used for the tree ring analysis.
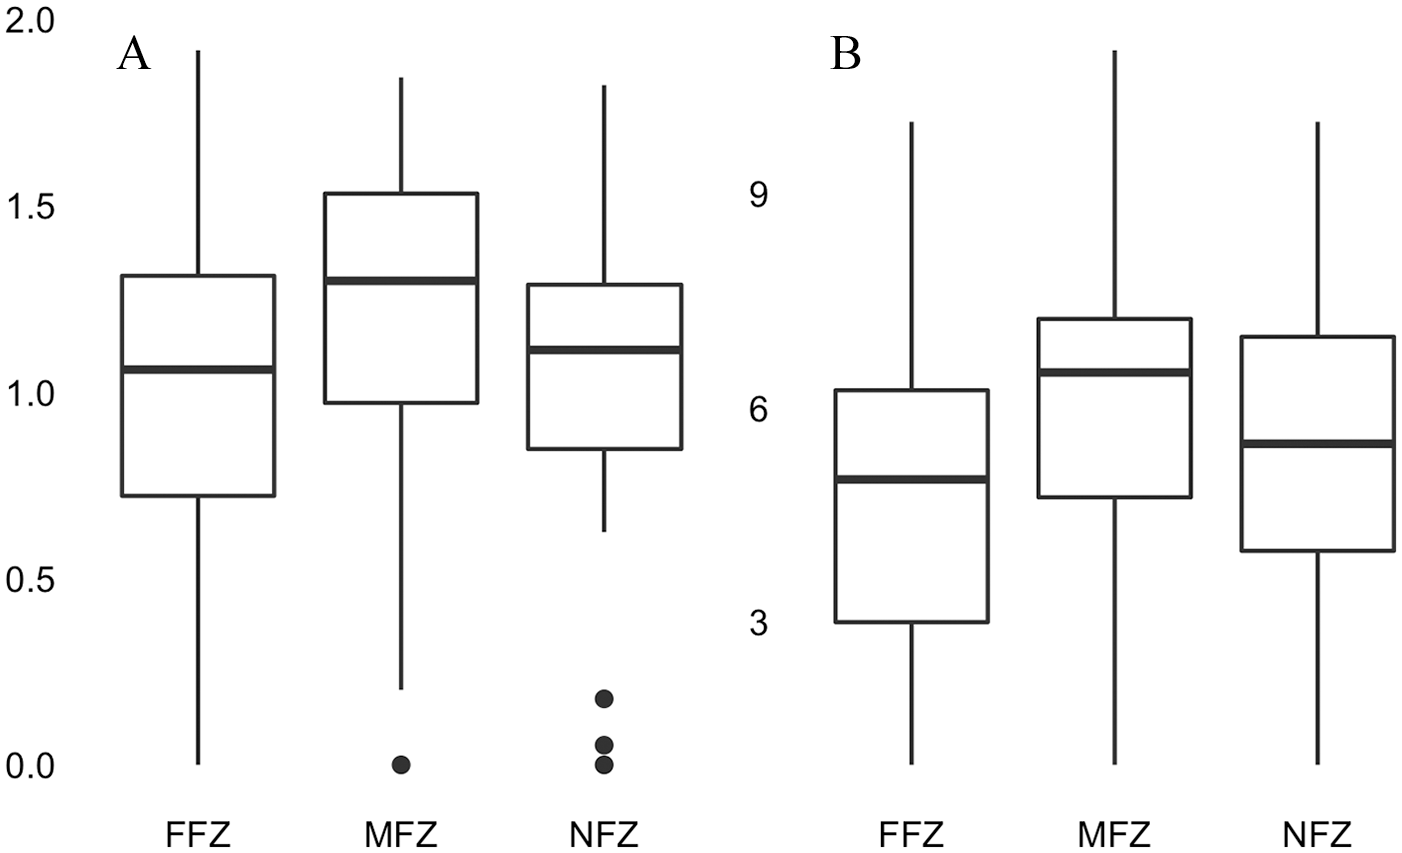
(A) Tree diversity (Shannon index) according to the flood zones (FFZ and MFZ) and no-flood zones (NFZ). (B) Tree species richness (ANOVA) according to the flood zones (FFZ and MFZ) and no-flood zones (NFZ). ANOVA indicates analysis of variance; FFZ, frequent-flood zones; MFZ, moderate-flood zones.
Diameter and basal area
The resulting tree diameter values are relatively comparable for all the tree stands (Table 4). Species like A rubrum, A saccharum, Pinus strobus, and P serotina are among the species with the largest diameters. In examining the diameter classes (<5 cm, 5-10 cm, and >30 cm dbh) for each inventoried species, small-diameter trees (<5 cm dbh) appear to be mainly dominant in all the tree stands. The species most frequently represented are A balsamea, F nigra, and F pennsylvanica, with larger-diameter species (>30 cm dbh) mainly consisting of T occidentalis, F pennsylvanica, P strobus, and T canadensis. However, a slightly lower number of trees with 5 to 10 cm dbh are noted in FFZ. T occidentalis, T canadensis, and Acer negundo can also be seen to have a greater number of large-diameter trees (dbh in cm), whereas A balsamea, F nigra, F pennsylvanica, Ulmus americana, and U rubrum have a more limited number of such individuals. Smaller (5-10 cm dbh) and intermediate (10-20 and 20-30 cm dbh) tree diameters are slightly under-represented in the FFZ. Finally, the maximum diameter measured is 72 cm (dbh) on a sugar maple (A saccharum), found in a floodplain (FFZ) in the STF sector. Figure 5 presents a good overview of the size of the main trees inventoried in the tree stands.
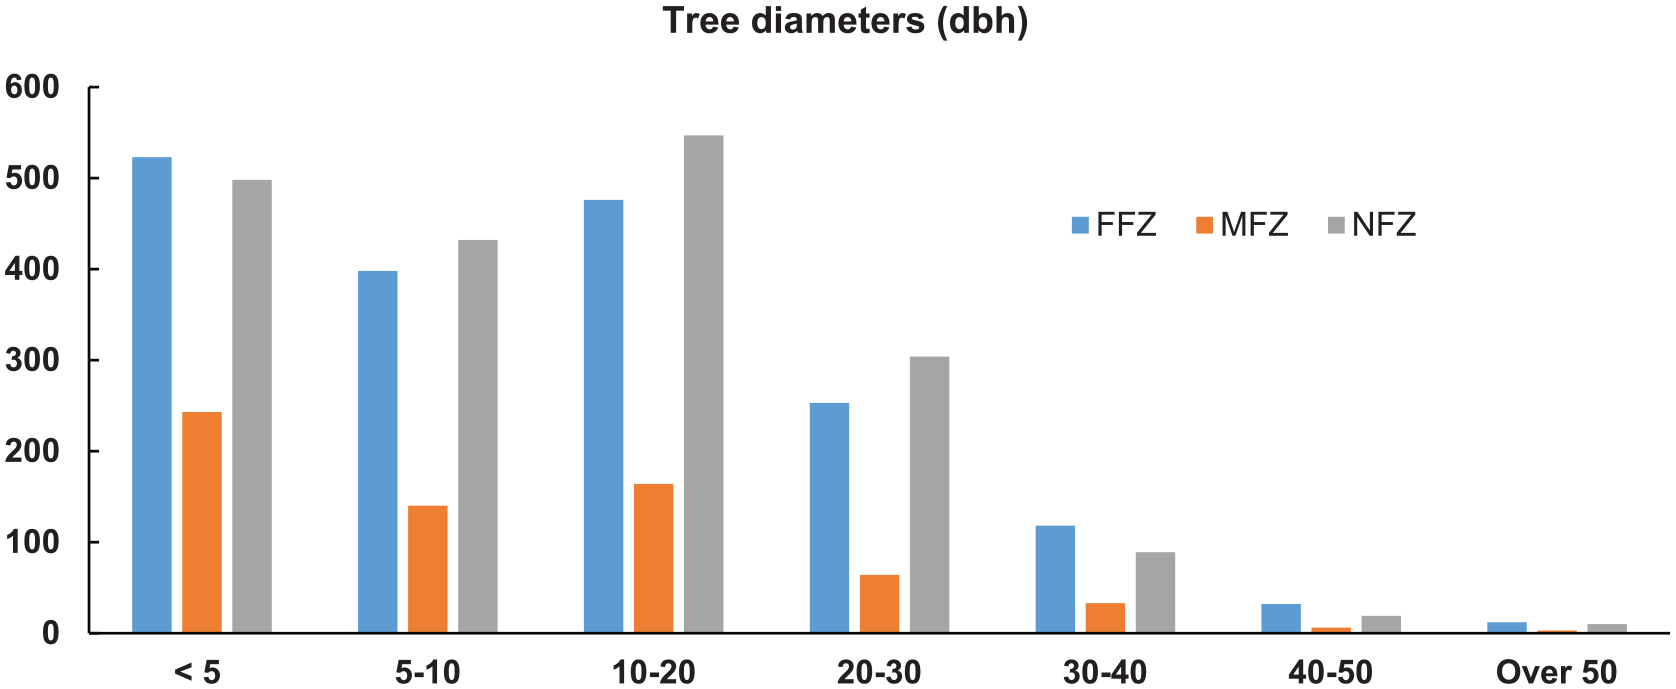
Distribution of the individual trees by diameter class (cm) in flood zones (FFZ, MFZ) and no-flood zones (NFZ). dbh indicates diameter at breast height; FFZ, frequent-flood zones; MFZ, moderate-flood zones.
The highest main values from the basal area (BA) measurements mainly include species such as T canadensis, T occidentalis, P serotina, and A negundo for the flood zones, whereas species such as P strobus, Populus tremuloides, and Picea mariana have the highest values for the NFZ (Table 4). Regarding the total basal area for each species, it can be noted that T occidentalis and F pennsylvanica are dominant for the flood zones, whereas T canadensis and A rubrum have the highest values for the NFZ.
Tree ages
The ages of the mature trees that were analysed for all the tree stands are presented in Table 4. Species such as B alleghaniensis, F nigra, P tremuloides, and T canadensis account for the oldest specimens (eg, 100, 106, and 108 years). The oldest specimens that were analysed include B alleghaniensis, which is 191 years old (Table 4). In examining the size of all the tree specimens, it can be seen that the forest stands contain more small trees (<5 cm dbh), although there are a certain number of mature individuals that can be more than 90 years old. Some species such as B alleghaniensis and T occidentalis have the greatest number of mature trees. In short, the age structure of riparian tree stands reveals an irregular inverted curve distribution showing a predominance of small trees with a subdominance of mature trees. The same observation can also apply for the tree stands in the NFZ, with a high contingency of small trees (<5 cm dbh). However, tree strata between 0 and 30 cm (dbh) are generally higher in the NFZ. Finally, several bent or fallen trees were observed in active floodplains, which is due to riverbank erosion caused by floods, resulting in an unstable substrate and weakened root system, contributing to an increase in the mortality rate of trees in the riparian fringe. The trees most affected are located less than 5 m from the riverbank, and erosion occurs during strong currents. Conversely, when waters recede, a fine layer of sediment (silt and fine sand) is deposited on the flat part of the slope (~0.5-4.5 cm in thickness, depending on the location) and covers low-lying vegetation and tree seedlings. These fluvial processes (erosion vs sedimentation) that act concomitantly may more significantly transform the composition and structure of current forest stands.11,19
Environmental variables and tree species composition
The statistical analyses (CCA) conducted to determine the relationships between environmental variables and tree species composition revealed that only 4 variables are significant and account for tree stand composition. These variables are soil acidity (pH), Clay%, Silt%, and the location of the tree stands by zone. The first 2 axes explain the total 10.4% in tree stand variability that was observed (Figure 6). The first axis (CCA1) is the greatest gradient in the significant variables, showing the distribution of the zones and species based on soil acidity. Soils with a high pH are mainly found in the FFZ (to the left of the graph), whereas soils with a low pH (to the right) are mainly found in the NFZ. In general, the FFZ contain species such as A negundo (ACNE) and Acer saccharinum (ACRI), and the NFZ Pinus rubrum (PIRU) and P strobus (PIST). Note that the less acidic soils are mainly found in the FFZ, whereas the more acidic soils dominate the NFZ. The second axis (CCA2) concerns the MFZ (at the top) and those with a stronger clay content (at the bottom). The MFZ are mainly colonized by species such as Fraxinus americana (FRAM) and Fagus grandifolia (FAGR), whereas soils richer in clay are mainly composed of U americana (ULAM) and T occidentalis (THOC). Note that some species such as A negundo (ACNE) and F nigra (FRNI) are largely associated with the FFZ that are characterized by soils more often saturated with water and with frequent flooding. A negundo is in fact often associated with disrupted environments 57 and is found in the FFZ. Soil conditions such as soil acidity and texture appear to be important elements for understanding species distribution based on the 3 zones under study. These variables must also be correlated with other environmental variables (eg, slope, drainage, parent material) which influence tree species composition.
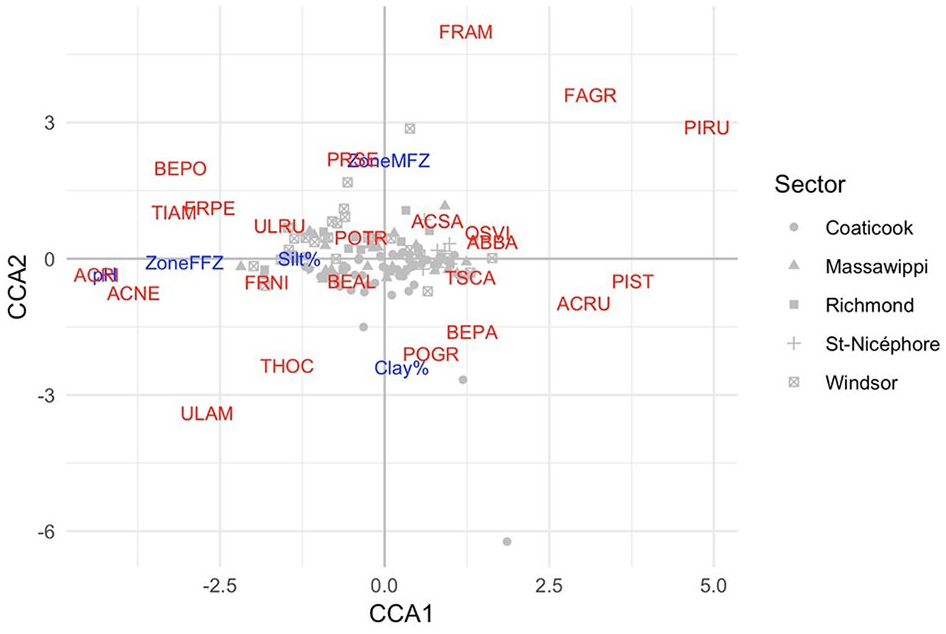
Canonical correspondence analysis (CCA) showing the distribution of tree species with environmental variables for all zones (FFZ, MFZ, and NFZ). The 2 axes (CCA1 and CCA2) whose values are significant represent 10.37% of the total deviance (ie, variability in communities). ACNE indicates Acer negundo; ACRI, Acer saccharinum; FAGR, Fagus grandifolia; FFZ, frequent-flood zones; FRAM, Fraxinus americana; FRNI, Fraxinus nigra; MFZ, moderate-flood zones; NFZ, no-flood zones; PIRU, Pinus rubrum; PIST, Pinus strobus; THOC, Thuja occidentalis; ULAM, Ulmus americana.
There are various studies that show that some soil properties could have a direct or indirect influence on the occurrence of certain tree species,58,59 whereas other studies indicate that the influence of soil on tree communities is low or less pronounced.1,23,56 It is true that soil-vegetation relationships meet a multitude of environmental conditions that sometimes make it difficult to determine links between biotic and abiotic variables. For instance, studies by De Jager et al 1 revealed no significant association between the occurrence of certain species of trees and soil properties (eg, pH, organic matter, texture). Conversely, the occurrence of certain species is more associated with flood inundation duration, in particular for A saccharinum and F pennsylvanica, which are more tolerant of long-term floods (>40 days). For this study, site topography influences flood duration and frequency, with low-lying floodplains being most affected. Other studies have shown that certain forest floodplain vegetation communities are more strongly correlated with certain soil properties (eg, pH, organic matter content).58,59 For instance, Burke et al 58 showed that communities consisting of Quercus lyrata Walter are most often found in sites with less acidic soils with a lower organic carbon content. The study by Roberston 59 shows that topography plays a key role in tree species composition. Because of the positioning on the riverbanks, qualified as species-elevation associations, combined with variations in the hydrological regime, significant species variation can be seen along the point bar and elevation gradient.
Other work carried out in floodplain forests shows that the rate or recruitment of tree species is lower in FFZ.7,24,60 For instance, the study by Berthelot et al 24 conducted in southern Québec shows that the rate or recruitment of tree species (seedling <1 cm dbh) in frequently flooded forests is lower than that in the NFZ, with mean density values (10 m2) for young stems of 1.20 compared with 2.26. Other work also shows that tree species regeneration is lower in FFZ and reduces vegetation in the ground layer and can reduce tree stem density for certain species.7,61,62 In addition, the discontinuity of the canopy causes an increase in the amount of light and facilitates the establishment of less shade-tolerant species. 7 Studies by Pierce and King 20 also show a lower recruitment rate of plant species subjected to the stress of floods, in particular by the input of alluvial sediments that affect germination, namely, for seedlings (eg, Q lyrata Walt.). In short, the mechanical effect of floods that create less favourable conditions for the establishment of seedlings, combined with the deposition of sediment during flood recession, makes the survival and maintenance of young tree species more difficult, not to mention other disrupting factors (eg, competition, low soil nutrients).
The riparian environment affected by ‘frequent floods’ seems to generate less favourable conditions for maintaining forest stand diversity and vitality (tree damage, premature tree death, low recruitment).20,62 The results of this study show that the forest stands found in the FFZ are not any richer in tree species than the other 2 zones (MFZ and NFZ) and even have slightly lower values, whereas greater diversity would have been expected. The MFZ are those with a slightly higher diversity of tree species, although the comparative values remain modest. These zones, often referred to as ‘intermediate flood disturbance frequencies’, show intermediate levels of species richness and productivity. 51 They form a type of continuum between the FFZ and the NFZ, thus benefitting from a greater diversity of species due to being adjacent to the other zones. Regarding species richness, roughly the same distribution pattern can be seen, ie, comparable richness from one zone to another, with a slight difference for the zones less affected by flooding. Regarding the tree community structure, many similarities can be observed between the 3 zones with a high contingency of very small trees (<5 cm dbh) and some mature trees. However, a decrease in the number of young and intermediate tree diameters (5-10, 10-20, and 20-30 cm dbh) can be noted in the flood zones. It is likely that floods affect the establishment of trees or their survival rate remains precarious. The lower occurrence of young or intermediate trees seems to be related to flood frequency, which was particularly high during the 1970s and 2000s. 27 In fact, there has been an increase in precipitation over the last 30 years in southern Québec,33,63 which naturally increases the risk of flooding.
Conclusions
This study deals with soil properties and forest stands in flood zones and NFZ. The results reveal that tree stand structure and composition is relatively comparable from one zone to another, although much greater diversity in tree species was expected in the FFZ. The MFZ, often qualified as ‘intermediate flood disturbance frequencies’, appear to have the most species of trees. Regarding the forest stand structure, no significant differences were noted between the zones, with a predominance of young trees (<10 cm dbh) and smaller representation of mature trees. However, a decrease in the number of young and intermediate tree diameters (5-10, 10-20, and 20-30 cm dbh) can be noted in the flood zones. Regarding soil characteristics, there was a marked difference between the soils from the NFZ and those from the FFZ, with the latter having significantly lower carbon and nitrogen contents. This soil depletion appears to be attributable to the frequent floods that prevent the accumulation of plant litter and make the soil less fertile. Furthermore, the erosion and sedimentation processes result in soil depletion, which can affect seedling survival and maintenance. If these current conditions (frequent floods) are maintained, it is possible that forest stands will experience a dieback period and forest regeneration will be compromised over the long term. To determine the long-term effects of an increase in floods on the forest cover, changes to these stands would have to be followed over a long period, namely, a few decades. This would provide, for instance, a better understanding of the dynamics of the stands and their pattern of adaptation, and to consider more efficient or lasting protection or restoration measures.
Footnotes
Acknowledgements
The authors sincerely thank Ann Delwaide (U. Laval) for the dendrochronological analysis, Charles Martin (UQTR) for support with statistical analysis, and Vernhar Gervais-Beaulac, Simon Demers, Guillaume Jeanmoy-Turcotte, Stéphanie Lavoie, Dominic Savoie, and Joan Vallerand (UQTR) for fieldwork assistance. The authors would also like to thank anonymous reviewers for their suggestions in reviewing the manuscript.
Funding:
The author(s) disclosed receipt of the following financial support for the research, authorship, and/or publication of this article: The authors would like to acknowledge the financial support from the Natural Sciences and Engineering Research Council of Canada (NSERC-RGPIN).
Declaration of conflicting interests:
The author(s) declared no potential conflicts of interest with respect to the research, authorship, and/or publication of this article.
Author Contributions
DS-L, LA-B, and J-SB contributed to the fieldwork, analysis of the data, and editing of the manuscript. LA-B and J-SB participated in the fieldwork, contributed to data analysis, and participated in the revision of the manuscript.
Supplemental Material
Supplemental material for this article is available online.