
Abstract
Epigenetic age is a biological age estimate based on nuclear DNA methylation patterns. Epigenetic clocks measure biological age by analyzing predictable changes in DNA methylation sites associated with aging. This study introduces EpigeneticAgePipeline, an R package that streamlines the estimation of epigenetic age metrics including Horvath, Horvath skin and blood, Hannum, PhenoAge/Levine, GrimAge (V1 and V2), and DunedinPACE plus additional acceleration metrics based on all other clocks. Quality control includes detection P-value filtering (sample- and probe-level), bead-count thresholds, and Illumina quality control intensity checks. EpigeneticAgePipeline supports Illumina Infinium methylation microarrays (HumanMethylation27, HumanMethylation450, HumanMethylationEPIC/EPICv2, and Human Methylation Screening Array). It offers functionalities including data preprocessing, normalization, cell count imputation, residual generation accounting for principal components and batch effects, and extensive visualizations for improved interpretability. Validation was performed using GEO data set GSE237561, confirming the accuracy of the pipeline. EpigeneticAgePipeline provides an integrated workflow from raw data to advanced statistical analyses and visualizations, improving usability over existing tools. In addition to the traditional clocks mentioned, the package also integrates a set of additional epigenetic age clocks (PedBE, Wu, TL, BLUP, and EN). Future updates will include emerging epigenetic age measures to maintain relevance in this evolving field.
Keywords
Introduction
The field of epigenomics has led to the understanding that environmental factors can significantly influence our genome and how particular regions of our genome are regulated and expressed. As the field has expanded, research into the association of epigenetic features, human health, and disease risk, as well as aging has emerged, leading to the concept of epigenetic age and the creation of epigenetic age clocks. Epigenetic clocks are computational tools that estimate biological age by analyzing specific DNA methylation patterns that are associated with cellular aging across the genome. These clocks use measures of DNA methylation, chemical modifications that regulate gene expression without altering the underlying DNA sequence, to provide insight into the aging process. This is important because epigenetic age may be a better measure of an individual’s health status than chronological age alone. EpigeneticAgePipeline aims to build off the functionality of other well-established R packages such as dnaMethyAge, 1 methylclock, 2 and minfi 3 to provide additional functionality and significantly improve usability.
The aim of this article is to showcase the complete workflow performed by the package, from data preprocessing to visualization. This comprehensive approach emphasizes the seamless integration of functionalities, highlighting the distinct advantages of EpigeneticAgePipeline compared to other tools that typically require multiple separate steps to achieve similar outcomes.
What makes EpigeneticAgePipeline unique is that it integrates the entire workflow, including data preprocessing, epigenetic age calculations, and downstream visualization tasks/final analysis into 1 seamless pipeline. The package allows for direct input of raw intensity data (intensity data file [IDAT]) files (27K, 450K, EPICv1/v2, and MSA microarray), which are then processed via sample and probe-level detection P-value filtering, bead-count thresholds at both the sample and probe level, Illumina control intensity checks, and the removal of cross-reactive probes and sex probes.4-8 Alternatively, users can input their own preprocessed methylation beta values. The package also allows for residual generation to account for cell count data and batch effects that arise during methylation data collection. Residual generation also includes the option to regress out principal components (PCs) generated from the methylation data set to account for additional sources of variation in the data. Cell proportion estimation is also included, allowing the user to specify tissue type and methodology.
Furthermore, EpigeneticAgePipeline provides a range of visualizations, including various correlation and distribution plots that enhance the data’s interpretability. These features, combined with the foundational functionalities of other well-established R packages, allow EpigeneticAgePipeline to fill a unique niche in computational epigenetics.
Methods
EpigeneticAgePipeline generates 6 common epigenetic age clocks, which include Horvath clock 9 and Horvath Bayesian Neural Network (BNN) clock, 10 Horvath skin and blood clock, 11 Hannum clock, 12 PhenoAge/Levine clock 13 and GrimAge (V1 and V2 based on their published surrogate panels).14,15 We have also included the PC versions for each of these clocks. 1 In addition to these 5 common clocks, the pipeline also generates the PedBE clock, 16 the Wu clock, 17 the Telomere Length (TL) clock, 18 the BLUP clock, 19 and the EN clock. 19 Each 1 analyzes the methylation pattern of a unique set of CpG (Cytosine-phosphate-Guanine) sites, which allows for more specific estimations depending on the tissue type and/or phenotype. Along with epigenetic age estimation, the package allows for the generation of DunedinPACE, 20 which reflects the pace of biological aging and age acceleration for each of the generated clocks.
When raw IDATs are provided, the pipeline performs detection P-value filtering at 2 levels: (1) sample-level retention if the mean detection P-value is < .05 and (2) probe-level retention only if the detection P-value is < .01 across passing samples. Bead-count filters exclude samples with >.05 low-bead observations (bead count < 3) and drop probes with >.05 low-bead observations among retained samples. Default parameters concerning detection P-value and bead-count filtering can also be modified by the user. Illumina control intensity metrics are assessed via minfi, where samples with mean log2 intensity of mMed and uMed < 10.5 are removed. 3 The pipeline then removes known cross-reactive probes and sex-chromosome probes. For each of the microarray formats accepted (27K, 450K, EPICv1/v2, MSA), a separate list of previously identified cross-reactive probes is removed during this process.21-24 Currently, there has been no formal study that compiled a list of cross-reactive probes for the MSA platform; however, due to its similarity to EPICv2, we used the EPICv2 list.
To handle replicate probes in newer EPICv2/MSA array formats targeting the same legacy CpG, beta values are collapsed by probe-ID prefix using betasCollapseToPfx from the sesame R package, yielding a single averaged beta per CpG prior to clock computation. 25
To calculate cell proportion estimates, the package supports Constrained Projection (CP) and Robust Partial Correlations (RPC) style generation for adult blood, cord blood, saliva, placenta (first and third trimester), and frontal cortex cells.26-33 Buccal cell proportions are also supported using the HEpiDISH (from EpiDISH R Package) hierarchical approach by first deconvolving epithelial, fibroblast, and immune fractions with a solid-tissue reference, then partitioning the immune fraction into blood cell subtypes.27,34,35
For all clocks except DunedinPACE, the package provides 3 variations of epigenetic age acceleration: (1) the difference between Epigenetic Age and chronological age, (2) residuals from Epigenetic Age ~ Age + estimated cell proportions, and (3) residuals from Epigenetic Age ~ Age. These are analogous to the age accelerations provided by methylclock. 2
In designing EpigeneticAgePipeline, we implement a curated set of epigenetic aging measures intended to cover the major classes of DNAm aging estimators that dominate comparative disease, mortality, and aging research.
Systematic reviews and large comparative studies consistently emphasize a core family of clocks spanning first-generation chronological age predictors (eg, Horvath, Hannum), phenotypic/mortality-trained clocks (eg, PhenoAge, GrimAge), pace-of-aging measures (eg, DunedinPACE/DunedinPoAm38), and DNAm-based telomere length estimators (DNAmTL). We therefore prioritize these families for conceptual coverage and practical relevance.36-40 We also include pediatric postnatal clocks (PedBE and Wu) to support child/adolescent cohorts and nonlinear (BNN) chronological predictors.41,42
The original Horvath clock was one of the first epigenetic clocks created and remains a commonly used epigenetic age measure. The clock uses a set of 353 CpG sites trained on 27K/450K arrays and is designed to be used on a wide range of tissue types. We also included a Horvath BNN clock, which generates a BNN using Horvath CpG sites to predict age. It has been shown to be slightly more accurate than default Horvath in predicting age. The second original epigenetic clock is the Hannum clock. This clock relies on a set of 71 CpG sites trained on a 450K array and is primarily designed for use on blood samples. Both the Horvath and Hannum clocks have been shown to be significant predictors of age- and age-related conditions. After the creation of the Horvath clock, the Horvath skin and blood clock was developed using a set of 391 CpG sites trained on 450K/EPICv1 array types for better estimations from skin, blood, saliva, human fibroblasts, keratinocytes, buccal cell, endothelial cell, and lymphoblastoid cell inputs. Another epigenetic age clock included is the Levine/PhenoAge clock, which was created as a potential outperformer of other clocks concerning predictions of age-based phenotypic outcomes; it uses a set of 513 CpG sites trained on 27K/450K/EPICv1. GrimAge is a measure primarily designed for blood samples, with versions 1 and 2 based on a set of 1030 CpGs, difference being that version 2 uses an additional 2 DNAm (DNA methylation) surrogates. The surrogates are DNAm log(C-reactive protein) and DNAm log(Hemoglobin A1c), which allows GrimAge2 to outperform the first in mortality prediction. 15 GrimAge has been shown to predict a high Mortality Hazard Ratio compared to other common epigenetic age measures. The PedBE clock uses 94 CpGs and was trained primarily on buccal epithelial samples (children and adolescents) profiled on 450K/EPIC platforms. It is optimized for pediatric tissues and has been used to track developmental timing and age acceleration in childhood cohorts. The Wu clock uses 111 CpGs and was trained on pediatric blood using 27K and 450K arrays. It provides highly accurate age estimates in children and has been applied to investigate developmental and clinical outcomes in pediatric populations. The TL clock uses 140 CpGs trained on blood using 450K and EPIC arrays to estimate leukocyte telomere length. It has been used to identify associations between shorter telomere length and advancing age and is related to aging-related morbidity. The BLUP clock uses 319 607 CpGs trained on blood and saliva measured on 450K and EPIC arrays. It leverages genome-wide features to yield high-precision age prediction and robust performance across cohorts and tissues. The EN clock uses 514 CpGs trained on the same 450K/EPIC blood and saliva data sets as BLUP. The elastic-net (EN) clock provides a sparse, portable predictor with strong cross-platform accuracy and reliable performance in external data.
The DunedinPACE measure is a measure of the pace of biological aging, which has been known to show strong associations with phenotypic outcomes like morbidity, disability, and mortality. DunedinPACE was developed for use in blood samples and uses a set of 173 CpG sites.
Unless otherwise justified, we recommend applying each epigenetic age measure to the tissue type and age range in which it was originally trained and validated (see Table 1), as performance can degrade or become difficult to interpret outside that domain. Accordingly, EpigeneticAgePipeline documents the intended tissue and age context for every clock and is designed with the expectation that users will supply methylation data derived from those recommended sample types, treating out-of-domain applications as exploratory.
Implemented clocks in EpigeneticAgePipeline, their recommended sample/tissue contexts, and key alternative clocks excluded with rationale.

EpigeneticAgePipeline also incorporates residual generation to allow for correction of important confounding variables. Principal component analysis is performed on beta values, and residuals are generated adjusting for the first 5 PCs (default) generated on the methylation data. Samples that are beyond 3 times (default) the median absolute deviation in any of the first PCs are marked as outliers. Residual generation also incorporates adjustments for technical effects that commonly arise from methylation array measurements. The user may provide data for array variables such as Row, Column, Slide, and Batch. Depending on which ones are given, the model will dynamically construct a suitable formula for the regression (see Figure 1). There is also a built-in option to compute and adjust for cell count proportion estimates. Residuals generated when chronological age is set as a predictor for biological age effectively gives a measure of age acceleration.

Flowchart illustrating formula construction for the linear model during residual generation (generateResiduals function).
A series of plots and visualizations are also included in the final output to present the correlations between epigenetic age measures and chronological age as well as the distribution of epigenetic age estimates for every sample. Raw data are exported as a .txt file which can be used for further analysis.
Results
The package’s main function is the primary entry point for epigenetic age analysis. Users provide the directory containing methylation and covariate data, if available (eg, age, sex, smoking status, batch effects, etc), along with options for normalizing beta values, selecting the methylation array type, and processing raw or precomputed data. The function performs preprocessing steps, cell count generation, and the creation of a file containing beta values for downstream analysis. This function also supports parallel processing for efficient handling of large data sets and allows users to specify sample tissue assumptions during cell count generation.
The generateResiduals function is designed for advanced analysis following epigenetic age estimation. This function builds a linear model based on user-specified variables or PCs and outputs the corresponding residuals, which can be used for further investigation of epigenetic age-related patterns. Users can input custom formulas for the model, specify the type of methylation array used, and include additional covariates such as cell counts in the analysis. The function also supports the detection and removal of highly correlated variables (if enabled) and identifies outliers using median absolute deviation (MAD). As with the main function, this process can leverage parallel processing for efficiency and accommodates both adult and cord blood sample assumptions during cell count generation. To view a complete outline of the workflow for either the main or generateResiduals function (see Figures 2 and 3).
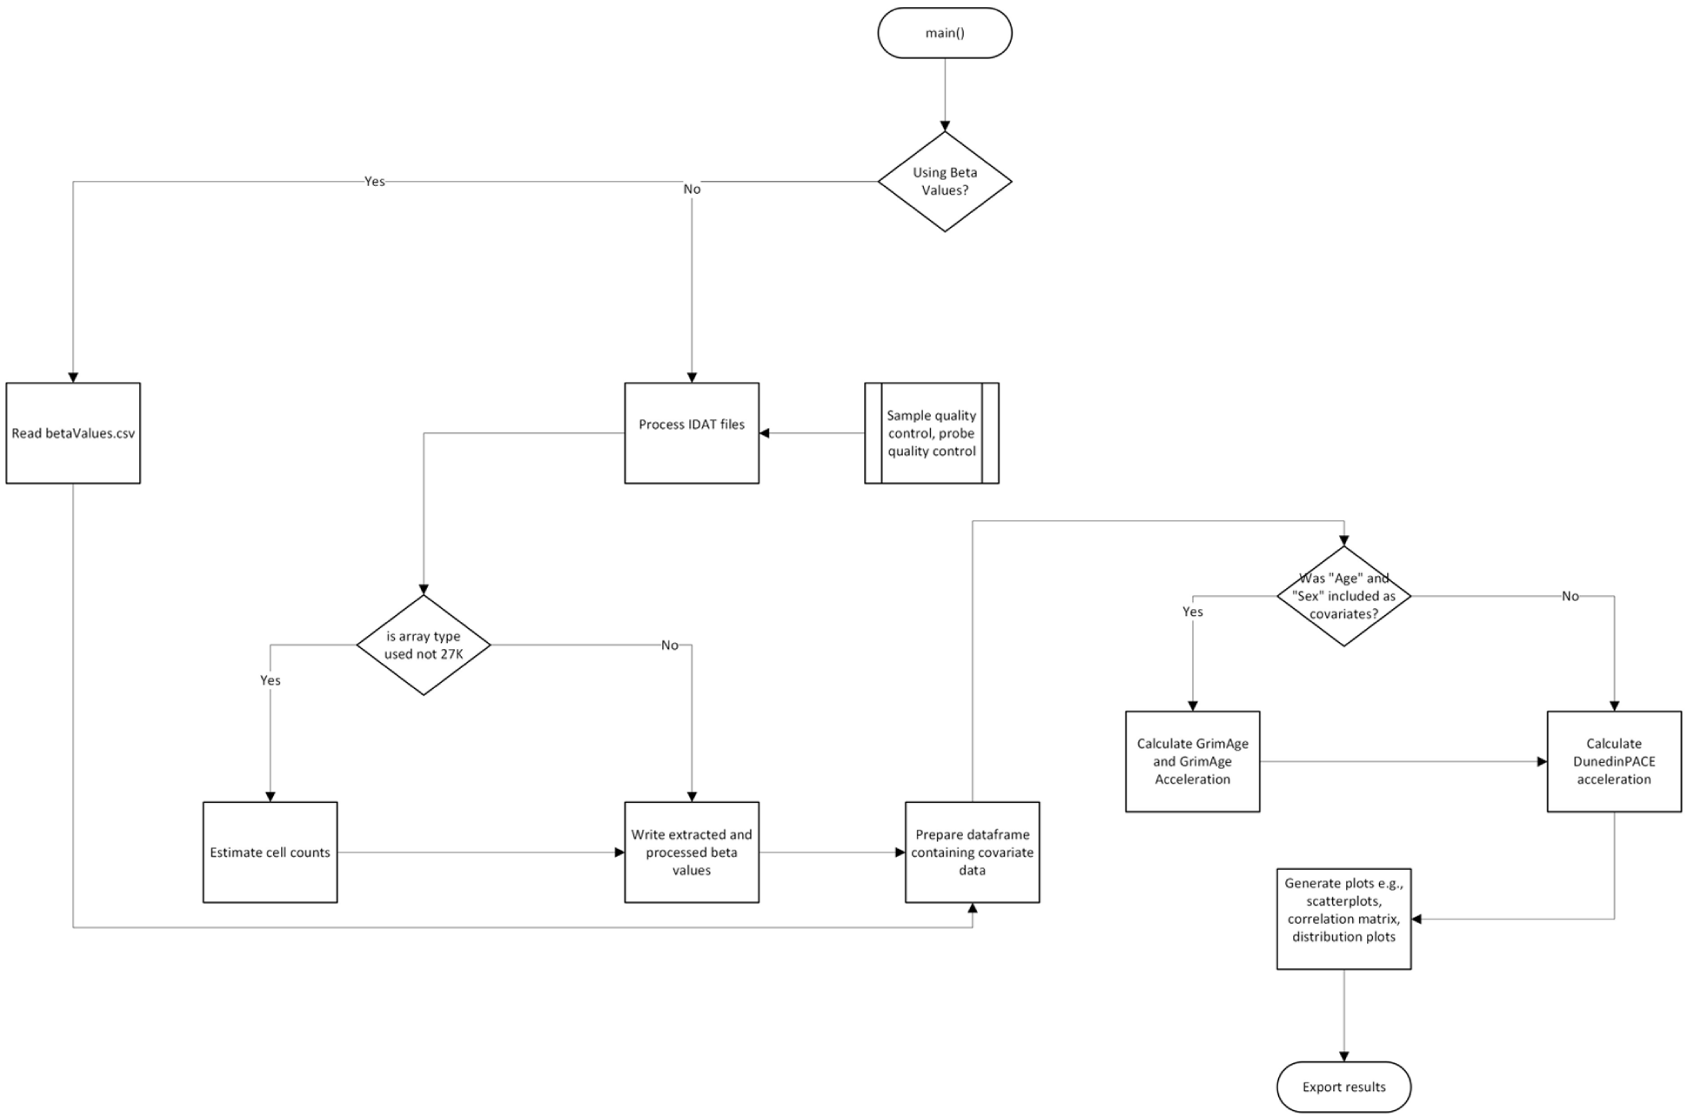
Workflow diagram illustrating the primary functionalities of the main() function.

Workflow diagram illustrating the primary functionalities of the generateResiduals() function.
To ensure the robustness of our pipeline, we first validated its implementation using the publicly available Gene Expression Omnibus (GEO) data set GSE237561. 55 This data set contains nuclear DNA methylation data for 126 samples: 92 measured using the 450K array and 34 using the EPIC platform. Since both methylation and phenotypic data are publicly available, we were able to compare our results against previously published findings. Specifically, a prior study investigating the relationship between clozapine use and epigenetic changes utilized this data set to calculate PhenoAge/Levine and DunedinPACE epigenetic age measures. 56 These epigenetic markers were incorporated into linear mixed models to assess whether clozapine use predicts epigenetic age or age acceleration. To validate our pipeline, we used all 126 samples and compared our computed PhenoAge/Levine and DunedinPACE measures against the published results. Our package generates these estimates using the methylclock and dnaMethyAge packages, respectively; this comparison, therefore, seeks to confirm the accuracy of our implementation. The full validation results can be found in the Supplementary Information. Following this validation, we applied our pipeline specifically to the 34 EPIC-measured samples for visualization. The covariates included in this analysis were sex, age, smoking score, and number of days on clozapine. Figure 4 as well as all Supplementary Figures (except validation) were generated using our EpigeneticAgePipeline on the EPIC-measured samples from the GSE237561 data set.

A correlation matrix generated for Horvath epigenetic age from the GSE237561 data set.
Inputs: The package accepts methylation data either in the form of a .csv file containing methylation beta values for each respective sample or a directory containing raw IDAT files.
Outputs: The package outputs raw epigenetic age/acceleration values (.txt and .md, Supplemental Table S1), raw residual results (.csv), age and epigenetic age correlation plots (Supplemental Figure S2), matrix correlation plots (.png, Figure 3), and an epigenetic age distribution plot (.png, Figure 3). A clock-coverage summary table is also outputted, reporting for each clock/surrogate the total CpGs, missing CpGs, and percent missing (Supplemental Table S2). Examples of all the plots can be found in the Supplementary Information files and our GitHub package page (https://github.com/CastellaniLab/EpigeneticAgePipeline).
Specific information on installation procedures and file specificities, as well as vignettes, is located within the GitHub readme. 57
Discussion
EpigeneticAgePipeline provides a comprehensive and user-friendly method to generate epigenetic age measures for those studying the effects of biological aging. Our pipeline better accounts for potential batch effects and confounding variables to minimize the effect of potential biases on the results in studies concerning biological aging. Our pipeline provides a complete workflow for epigenetic age estimation, starting with raw methylation data all the way to the generation of epigenetic age measures, incorporating a variety of quality control methods and visualizations.
Limitations
The accuracy and interpretability of epigenetic age estimates depend on applying each clock within the tissue types and age ranges for which it was trained on. Although the pipeline allows for flexible inputs, results obtained from out-of-domain sample specifications should be interpreted as exploratory. EpigeneticAgePipeline implements a comprehensive collection of epigenetic age clocks for the most studied tissues and use cases. More specialized or less commonly applied clocks are not included by default and would need to be generated separately by users.
Conclusion
EpigeneticAgePipeline serves as a valuable tool for investigating the relationships between epigenetic age measures and a wide range of health outcomes. Future updates will include the addition of emerging epigenetic aging measures/methods to ensure the pipeline remains relevant to this expanding field.
Supplemental Material
sj-pdf-1-bbi-10.1177_11779322261433665 – Supplemental material for EpigeneticAgePipeline: An R Package for Comprehensive Assessment of Epigenetic Age Metrics From Methylation Microarrays
Supplemental material, sj-pdf-1-bbi-10.1177_11779322261433665 for EpigeneticAgePipeline: An R Package for Comprehensive Assessment of Epigenetic Age Metrics From Methylation Microarrays by Stanislav Rayevskiy, Quinn Le, Julia Nguyen, Steven Q. Chen and Christina A. Castellani in Bioinformatics and Biology Insights
Footnotes
Acknowledgements
We acknowledge the Digital Research Alliance and the Canadian Foundation for Innovation J. Evans Leaders Fund grant #43481 for the support of the computing infrastructure used throughout our analyses.
Authors’ Note
Author Contributions
Ethics Approval and Consent to Participate
Not applicable, this study used publicly available data sets and did not involve any human participants, human tissue, or human data collected by the authors.
Consent for Publication
Not applicable.
Data Availability Statement
Funding
The authors disclosed receipt of the following financial support for the research, authorship, and/or publication of this article: This work was supported by start-up funds to CC from the Department of Pathology and Laboratory Medicine at Western University. It was further supported by institutional summer support (USRI) from Western University to SR.
Declaration of Conflicting Interests
The authors declared no potential conflicts of interest with respect to the research, authorship, and/or publication of this article.
Supplemental Material
Supplemental Material for this article is available online.
References
Supplementary Material
Please find the following supplemental material available below.
For Open Access articles published under a Creative Commons License, all supplemental material carries the same license as the article it is associated with.
For non-Open Access articles published, all supplemental material carries a non-exclusive license, and permission requests for re-use of supplemental material or any part of supplemental material shall be sent directly to the copyright owner as specified in the copyright notice associated with the article.