
Abstract
The development of selective small-molecule inhibitors against extracellular signal-regulated kinases 1 and 2 (ERK1/2) remains a major challenge due to their high structural similarity and conformational flexibility. In this study, we combined classical molecular dynamics (MD) simulations with artificial intelligence (AI)–based unsupervised learning approaches to investigate the conformational dynamics and binding selectivity of ERK1/2-inhibitor complexes. Six systems, comprising ERK1 and ERK2 bound to inhibitors 33A, 38Z, and Z48, were simulated for 250 ns to capture their structural and energetic behaviors. Root mean square deviation (RMSD) and fluctuation (RMSF) analyses confirmed that all complexes reached equilibrium, with ERK2 systems exhibiting greater structural stability than ERK1. Radius of gyration (Rg) and hydrogen-bond profiles support consistent compactness and persistent interactions throughout the trajectories. The AI-based dimensionality reduction (principal component analysis [PCA], t-distributed stochastic neighbor embedding [t-SNE]) and K-means clustering revealed distinct conformational basins, indicating ligand-specific modulation of ERK flexibility. Free energy landscape mapping and state transition analyses demonstrated that Z48-bound systems showed more compact and stable conformational basins, reflecting enhanced conformational stabilization, whereas 33A complexes exhibited higher dynamic variability. In contrast, molecular mechanics/generalized Born surface area (MM/GBSA) binding free energy calculations showed that 38Z exhibits the strongest binding affinity toward both ERK isoforms, driven primarily by favorable van der Waals interactions. Overall, this combined MD-AI framework provides atomistic insights into ERK1/2 conformational plasticity and inhibitor selectivity, highlighting 38Z as the most energetically favorable binder and Z48 as the most effective conformational stabilizer. These findings advance the understanding of ERK regulation and can guide the rational design of next-generation selective kinase inhibitors.
Introduction
The extracellular signal-regulated kinases 1 and 2 (ERK1/2) are crucial members of the mitogen-activated protein kinase (MAPK) pathway, which plays a fundamental role in regulating diverse cellular processes such as proliferation, differentiation, survival, and apoptosis. As key effectors in the Ras-Raf-MEK-ERK cascade, many physiological processes are regulated by ERK1/2 kinases, making them critical to both normal cellular function and disease progression.1,2
This study is deeply rooted in data science principles, particularly through the integration of machine learning techniques with molecular dynamics (MD) simulations. The high-dimensional trajectory data generated from MD simulations are processed using unsupervised learning algorithms such as principal component analysis (PCA), t-distributed stochastic neighbor embedding (t-SNE), and K-means clustering. These tools are used extensively in data science for dimensionality reduction, pattern recognition, and classification. These methods enable the extraction of meaningful structural patterns and conformational states from large data sets, revealing critical insights into protein-ligand interactions. By transforming raw simulation data into interpretable models, we show how data science can bridge computational biology and pharmaceutical research to support rational drug design.
Previous research has identified 5 ERK isoforms: ERK1, ERK2, ERK3, ERK5, and ERK6 via molecular cloning and sequencing. Among these, ERK1 and ERK2 are most prominent in the MAPK/ERK pathway and were first identified by the Cobb group as p44 and p42 MAPK proteins. 2 Structurally, ERK1 and ERK2 share 84% sequence identity in their core domains, with differences mostly located in the N-terminal region. These structural variations may contribute to distinct localization and activation dynamics. 2 When activated via MEK1/2 at the conserved TEY motif, ERK1/2 translocates into the nucleus and modulates gene expression. 2
The ERK/MAPK signaling cascade is activated by diverse stimuli such as cytokines, growth factors, GPCR ligands, and oncogenes, often through upstream effectors like Ras, Raf, and PKC. 3 While ERK1 and ERK2 exhibit nearly identical substrate specificity and are ubiquitously expressed, 4 subtle structural differences, such as a single amino acid substitution, may change their binding affinity. Nonetheless, ERK1/2 shares highly overlapping substrate-binding profiles. 5
In recent years, the role of ERK1/2 in disease pathogenesis has garnered increasing attention. Aberrant ERK signaling has been linked to neurodegenerative disorders such as Alzheimer and Parkinson diseases, 6 as well as to the progression of various cancers. Overexpression and hyperactivation of ERK1/2 have been observed in lung, ovarian, colon, and breast tumors. 7 This dysregulation can drive uncontrolled cell proliferation and tumorigenesis and can also trigger apoptotic pathways. 8 Consequently, components of the ERK signaling cascade are recognized as promising therapeutic targets, and several MEK and BRAF inhibitors have already entered clinical application.
Despite the availability of inhibitors targeting upstream components, there is a growing interest in developing small molecules that directly target ERK1/2. Previous efforts have yielded inhibitors like 33A (2OJI) and Z48 (3I5Z) for ERK2 and 38Z (4QTB) for ERK1.9-11 However, a detailed understanding of their binding mechanisms is still lacking, a gap that limits rational drug design.
Therefore, the rationale of this work is to elucidate the structural and energetic basis of ligand selectivity between ERK1 and ERK2. By combining long-timescale MD simulations with residue-level molecular mechanics/generalized Born surface area (MM/GBSA) binding free energy decomposition and artificial intelligence (AI)-driven clustering of conformational states, this study aims to characterize the dynamic stability of ERK1/2-inhibitor complexes, identify key residues contributing to selectivity, and demonstrate how machine learning can uncover hidden conformational features relevant for rational drug design. Collectively, this integrative approach provides atomistic insights into ERK1/2 ligand recognition and offers a computational framework to guide the development of next-generation isoform-selective ERK inhibitors.
Methodology
System preparation
The crystal structures of ERK1 and ERK2 complexed with their respective inhibitors were retrieved from the Protein Data Bank (PDB): ERK1-38Z (PDB ID: 4QTB), ERK2-33A (PDB ID: 2OJI), and ERK2-Z48 (PDB ID: 3I5Z). Based on these templates, 6 simulation systems were created using PyMOL, namely ERK1-33A, ERK1-38Z, ERK1-Z48, ERK2-33A, ERK2-38Z, and ERK2-Z48. All non-essential crystallographic water molecules and heteroatoms, except for the bound inhibitors, were removed. Missing hydrogen atoms were added using the Amber LEaP module, and protonation states were assigned at pH 7.0. The ff14SB forcefield12,13 was employed for the proteins, while the General Amber Force Field (GAFF) 14 was used to parameterize the inhibitors. The Antechamber module of AmberTools was used to optimize ligand geometries at the semiempirical AM1 level, and AM1-BCC partial charges were assigned to ensure accurate electrostatic representation.15,16 Following parametrization, the compounds were solvated in a 10 Å periodic box containing water molecules from the 3-point water model used in molecular simulations (TIP3P). 17 Counterions were added to neutralize the systems: 7 Cl− ions for ERK1 complexes and 8 Cl− ions for ERK2 complexes.
Molecular dynamics simulation production
Prior to the start of production, all prepared systems were optimized using 10 000 steps of steepest descent minimization to eliminate undesirable atomic interactions. In total, 10 000 more steps of equilibration were then given to the solvated systems. From 0 to 300 K, the systems’ temperature gradually increased, and at 300 K, they underwent further equilibration optimization. Additional equilibration at 300 K ensured complete relaxation before production. After the systems were equilibrated, a production run was conducted utilizing the NPT (Constant Number of particles, Pressure, and Temperature) ensemble, which involved a 250 ns simulation at 1 atm pressure and 310 K temperature. Bonds involving hydrogen atoms were constrained using the SHAKE method, and the long-range electrostatic interactions were treated at the 10 Å cutoff range using the particle mesh Ewald (PME) technique.18,19 The MD simulations were carried out using Nanoscale Molecular Dynamics (NAMD). 20 Visual Molecular Dynamics (VMD) 21 and R’s BIO3D package were used to analyze the molecular dynamic trajectories. 22
Principal component analysis
One of the most beneficial applications of PCA has been demonstrated to be the identification of coordinated movements within a set of conformational structures derived from experimental or molecular simulation data. This technique has been extensively used to investigate how conformational changes affect receptor function.23,24 Utilizing atomic coordinates gathered from the MD simulations, the covariance matrix for PCA was created. After that, this matrix’s diagonalization produced a collection of eigenvalues and eigenvectors. Following diagonalization, the protein domain’s movement directions are represented by the eigenvectors, and the squared mean fluctuations along these directions are shown by the associated eigenvalues. The most helpful eigenvectors for depicting the general motions of the proteins are the first few with the highest eigenvalues. At the end, using the R BIO3D package, the dynamic motion of the protein complexes was estimated. 22
Molecular mechanics/generalized Born surface area
The binding free energy estimations obtained by the MM/GBSA approach are more reliable than those obtained by numerous molecular docking scoring systems.25,26 Similarly, several studies have demonstrated that the MM/GBSA approach is sufficiently precise and stable to predict the binding free energies between protein targets and small drug-like compounds.27,28 Using the MM/GBSA approach and the equation below, the binding free energies of ERK1/2 complexes were determined while keeping these findings in mind.
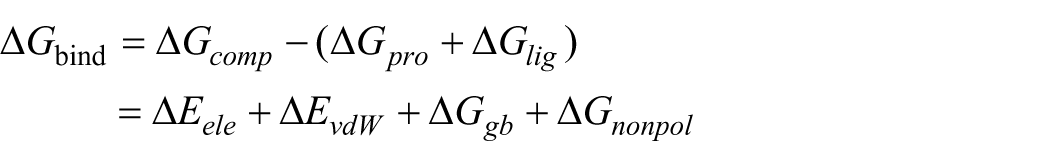
The binding energies of ERK1/2 complexes are represented by the values of ΔGcomp, ΔGpro, and ΔGlig. The inhibitors’ van der Waals and electrostatic interactions with ERK1/2 are represented by ΔEvdW and ΔEele, respectively. The Generalized Born (GB) model is used to calculate the polar solvation energy, denoted as ΔGgb. In this study, the GB model is used to calculate the polar solvation energy, denoted as ΔGgb. The MM/GBSA calculations were performed using the MMPBSA.py module implemented in AmberTools. 29 The polar solvation term (ΔGgb) was computed using the OBC GB model (igb = 2) with salt concentration set to 0.1 M. The dielectric constants were set to the Amber defaults: internal dielectric εin = 1 and external dielectric εout = 80. The nonpolar free energy components are represented by ΔGnonpol, which accounts for the surface area solvation energy. It is important to note that the entropy contribution (−TΔS) was not included in these calculations. The MM/GBSA method primarily considers enthalpic and solvation contributions to the binding free energy, while the entropy term is excluded. Including entropy would require additional methods such as normal mode analysis or explicit solvent simulations, which were not performed in this study.
AI-assisted conformational and binding analysis
Artificial intelligence (AI)–based unsupervised learning techniques were employed to complement MD simulations and uncover dominant conformational patterns governing ERK1/2-ligand interactions. Trajectory data were processed in Python using the MDAnalysis library 30 by extracting Cα atomic coordinates to construct a distance-based feature matrix representing pairwise inter-residue distances across all frames. Dimensionality reduction was performed using PCA 31 to identify collective motions and major structural variations, followed by t-SNE 32 to capture nonlinear relationships between conformations. The resulting embeddings were subjected to K-means clustering, where the number of clusters (k = 3) was selected based on visual inspection of conformational separation in PCA and t-SNE projections. Both dimensionality-reduction methods consistently revealed 3 recurrent and well-separated conformational basins, and clustering with k = 3 yielded stable and interpretable states that were reproducible across PCA- and t-SNE–based analyses, which revealed that the trajectories of the ERK1/2-ligand complexes naturally partitioned into 3 distinct conformational states. Multiple clustering trials with different k values showed that k = 3 provided the most meaningful and stable separation of the conformational states. This choice of k = 3 was further supported by the stability of the clusters observed across the dimensionality reduction and clustering techniques. Cluster identities were combined with PCA coordinates to construct Free Energy Landscapes (FELs) 33 and transition matrices, describing equilibrium among metastable states. Representative structures from each cluster were subsequently analyzed through MM/GBSA binding free energy decomposition, 34 linking conformational stability with energetic contributions. This AI-driven workflow enabled the identification of functionally relevant conformational states and the energetic determinants of ERK1/2 selectivity.
Results
Root mean square deviation
The root mean square deviation (RMSD) was calculated to evaluate the structural stability and convergence of ERK1 and ERK2 complexes during the 250 ns MD simulations. As shown in Figure 1A, all ERK1-ligand complexes exhibited stable behavior after initial fluctuations within the first 30 ns. The ERK1-33A and ERK1-38Z complexes maintained mean RMSD values around 2.0 Å, while ERK1-Z48 showed slightly higher deviations (~2.5-3.0 Å), indicating moderate flexibility in the binding region. For ERK2 complexes (Figure 1B), all systems demonstrated faster convergence and lower fluctuations, with RMSD values stabilizing between 1.5 Å and 2.0 Å after equilibration. Among them, ERK2-33A remained the most stable, followed by ERK2-38Z and ERK2-Z48, suggesting that ERK2 maintains greater backbone rigidity compared to ERK1 under similar conditions. Collectively, the RMSD trends confirm the overall structural equilibrium of all complexes throughout the 250 ns simulation period, with ERK2 complexes displaying enhanced conformational stability relative to ERK1.
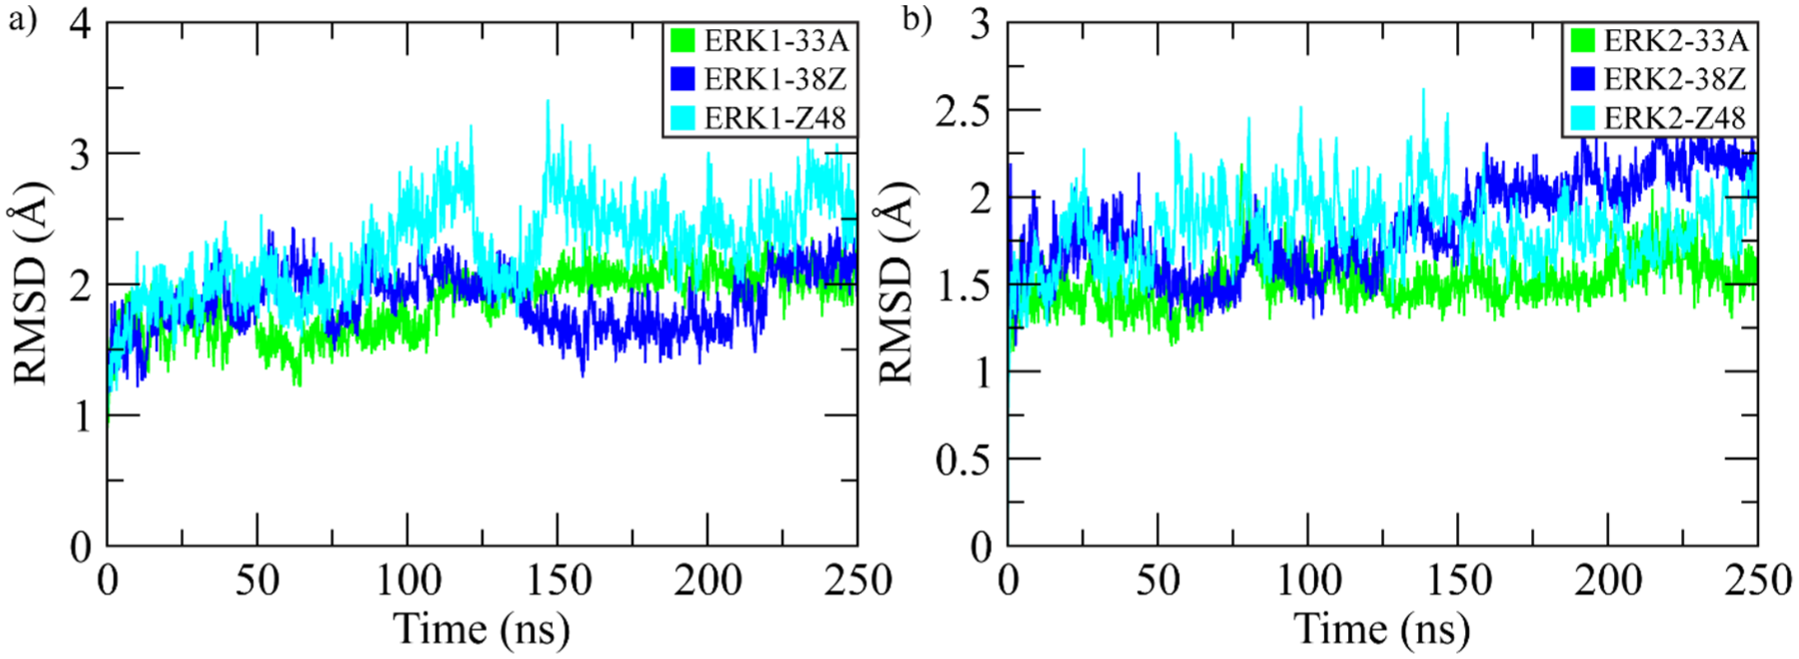
RMSDs of the backbone atoms for ERK complexes were calculated over the 250 ns simulation. (A) RMSD of ERK1 complexes. (B) RMSD of ERK2 complexes.
Root mean square fluctuation
Root mean square fluctuation (RMSF) was calculated to evaluate the flexibility of individual residues in ERK1 and ERK2 when bound to different inhibitors over the 250 ns simulation. As shown in Figure 2A, all ERK1 complexes exhibited overall low fluctuations (< 2 Å) across most residues, indicating stable backbone dynamics. Noticeable peaks appeared near the N-terminal (residues 1-20) and C-terminal regions (residues 330-350), corresponding to solvent-exposed and loop regions. Among ERK1 systems, the ERK1-Z48 complex displayed slightly higher fluctuations around residues 190-210 and 300-320, suggesting localized flexibility near the activation loop. For ERK2 complexes (Figure 2B), similar trends were observed with relatively stable fluctuations throughout the catalytic core. Minor peaks in the activation loop and C-terminal tail were evident, but all RMSF values remained within 1 to 2 Å, reflecting structural stability. Comparatively, the ERK2-33A complex showed the lowest average RMSF, indicating higher rigidity, while ERK2-Z48 exhibited moderate flexibility at loop regions. These results collectively demonstrate that both ERK1 and ERK2 maintain stable conformations during inhibitor binding, with limited residue-level flexibility contributing to complex stability.
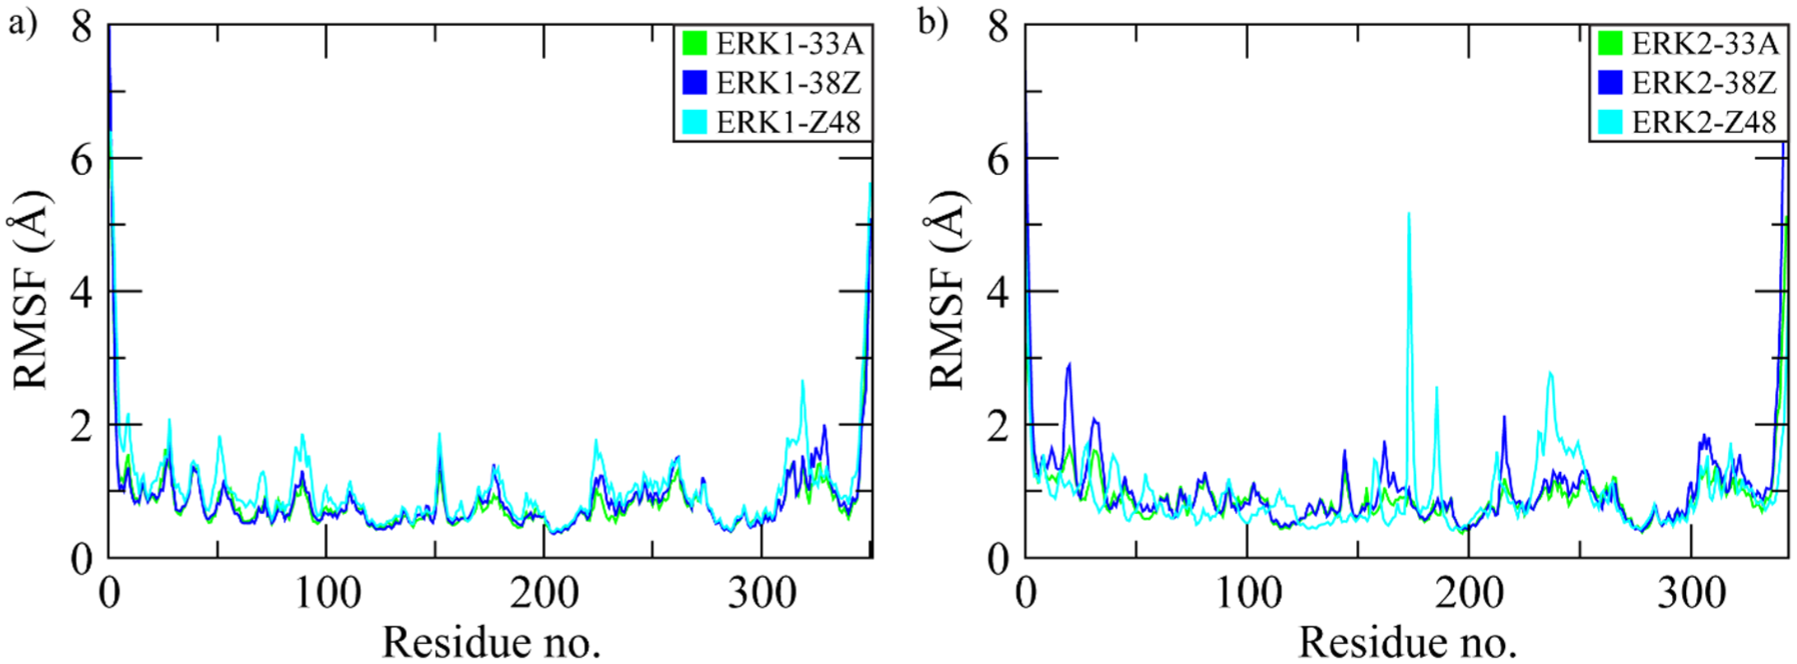
Root mean square fluctuations of residues in ERK1 (A) and ERK2 (B) when bound to ligands.
Dynamic behavior of extracellular signal-regulated kinases 1 and 2
The aim was to analyze the correlated and anti-correlated movements within the protein structures of ERK1 and ERK2 using cross-correlation matrices. Cross-correlation matrices revealed interesting insights into motion patterns. The binding of inhibitors to ERK1 and ERK2 affected these motions differently. For example, the ERK1-33A complex showed weakened positively correlated motions in the R1 region, whereas the ERK1-38Z complex influenced the anti-correlated motions in the R2 to R4 regions (Figure 3). In ERK2, binding of 33A weakened motions in both R1 and R2 to R4 regions (Figure 3B), while Z48 binding enhanced anti-correlated movements in ERK1 but did not affect ERK2 significantly (Figure 3F). These findings indicate that each inhibitor affects protein motion differently, suggesting that the inhibitors’ binding sites and their impact on protein dynamics could be key to their varying efficacy.

Cross-correlation matrices of Cα atomic coordinates for ERK1 and ERK2 complexes bound to inhibitors 33A, 38Z, and Z48. Matrices (A), (C), and (E) represent ERK1 bound with 33A, 38Z, and Z48, respectively. Matrices (B), (D), and (F) depict ERK2 bound with 33A, 38Z, and Z48, respectively.
Radius of gyration
The radius of gyration (Rg) was computed to assess the compactness and overall structural stability of ERK1 and ERK2 in complex with the inhibitors 33A, 38Z, and Z48 over the 250 ns simulation period. As shown in Figure 4, all ERK1 and ERK2 complexes maintained relatively stable Rg profiles throughout the trajectory, indicating no major unfolding or collapse events. For ERK1 complexes, the Rg values fluctuated within a narrow range of 21.0 to 22.5 Å. The ERK1-33A complex displayed a slight increase in Rg after 180 ns, suggesting minor global relaxation in its tertiary structure, while ERK1-38Z and ERK1-Z48 remained more compact and stable with mean Rg values around 21.4 Å. In ERK2 complexes, the Rg values remained highly consistent between 21.0 and 21.8 Å across the entire simulation. Among them, ERK2-33A exhibited the lowest fluctuation amplitude, indicating superior conformational compactness, whereas ERK2-Z48 showed minor variations around 21.5 Å but retained structural integrity. Overall, the Rg trends demonstrate that all complexes preserve their global folding and maintain stable tertiary structures during the 250 ns simulation, with ERK2 systems showing slightly greater compactness than their ERK1 counterparts.
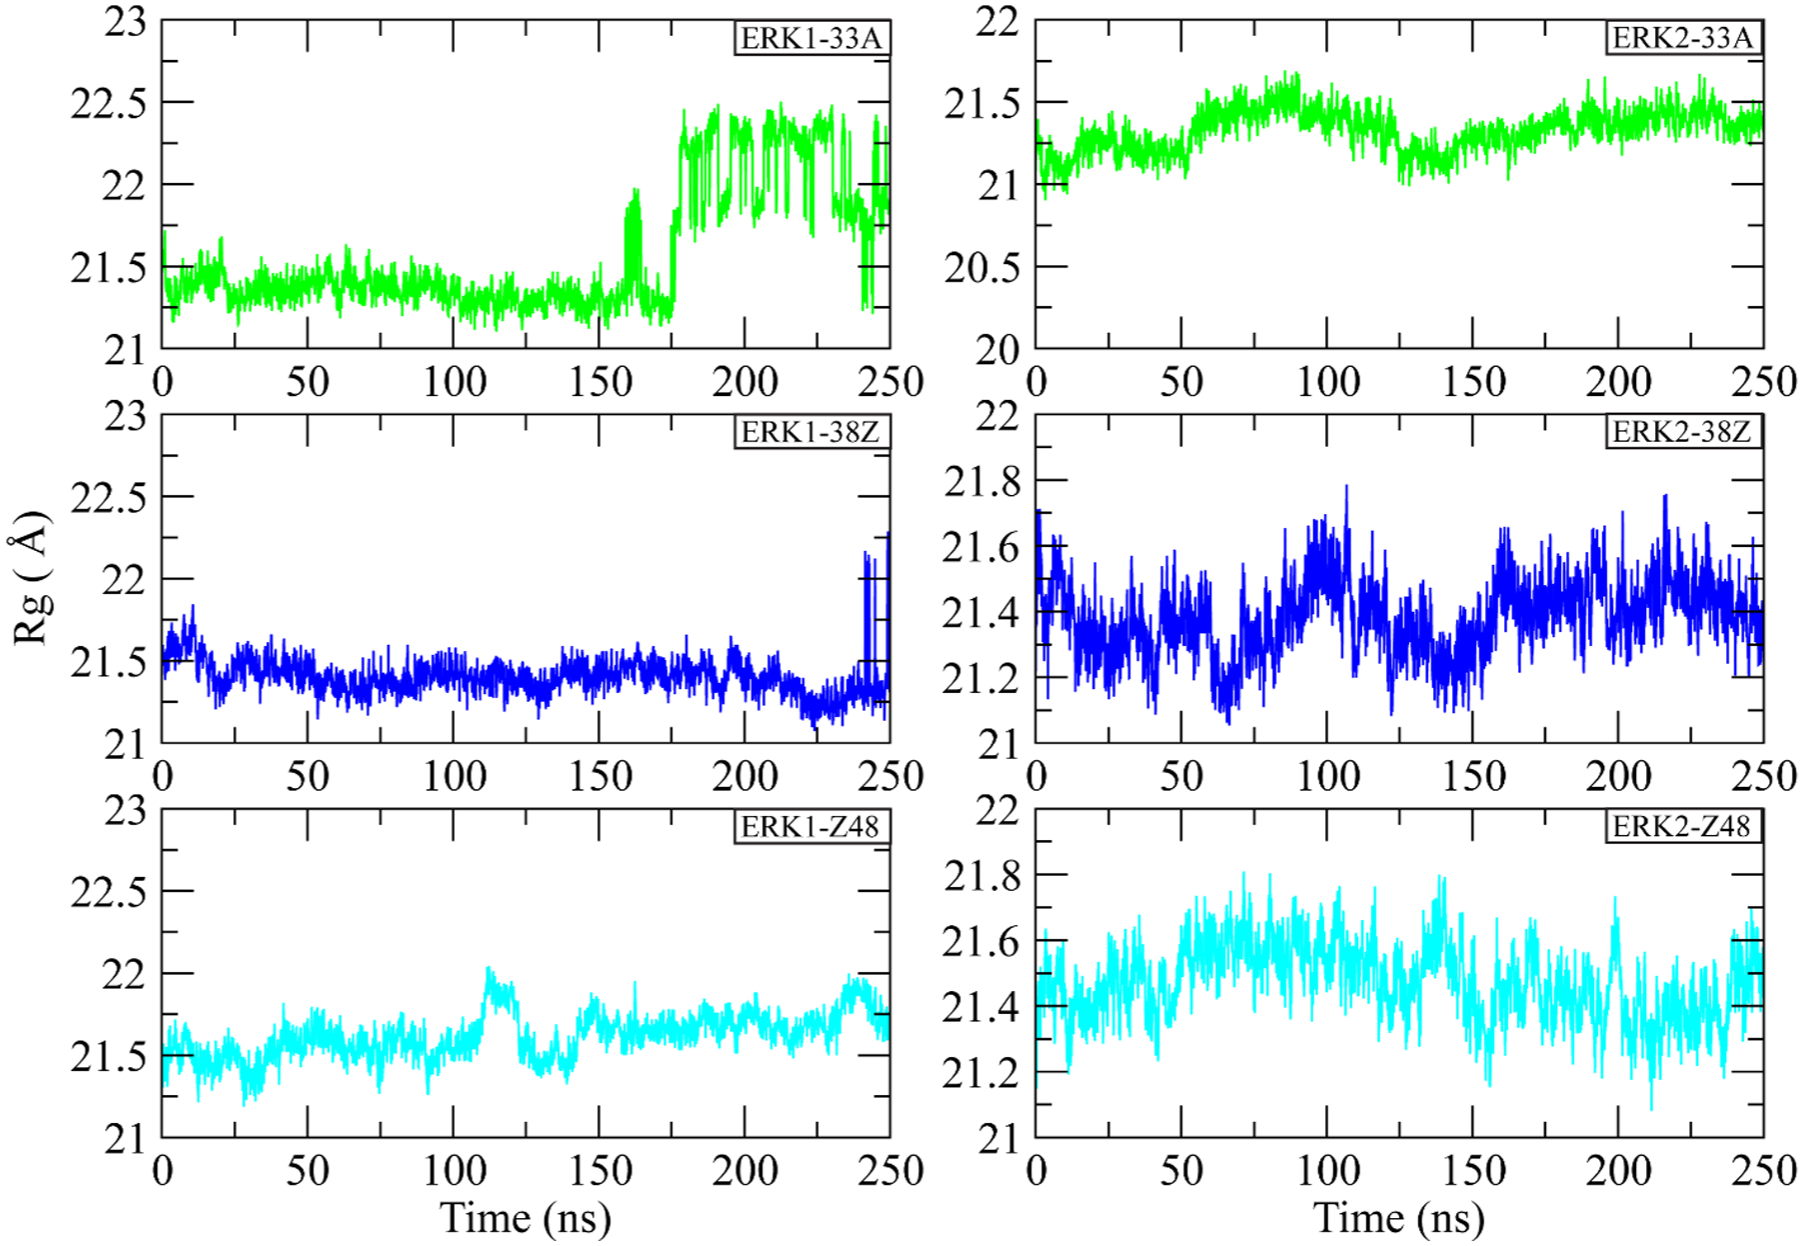
Radius of gyration (Rg) profiles of ERK1 and ERK2 complexes over 250 ns of molecular dynamics simulation.
Hydrogen-bond analysis
Hydrogen-bond (H-bond) analysis was performed to evaluate the strength and persistence of intermolecular interactions between ERK1/2 and their respective inhibitors throughout the 250 ns MD simulations. As shown in Figure 5, all complexes exhibited stable but transient hydrogen-bonding patterns, typically maintaining between 1 and 2 H-bonds during the trajectory. For ERK1 complexes, the ERK1-33A complex displayed the most frequent H-bond formation, maintaining 1 to 2 H-bonds consistently over time, indicating strong and recurrent polar interactions with active-site residues. The ERK1-38Z complex showed slightly fewer persistent H-bonds but maintained stable contacts, while the ERK1-Z48 complex exhibited intermittent interactions, suggesting reduced H-bond stability. In ERK2 complexes, the ERK2-33A complex retained 1 to 2 consistent H-bonds across the simulation, supporting its strong binding affinity. The ERK2-38Z and ERK2-Z48 complexes demonstrated periodic H-bond formation, with occasional peaks up to 3 H-bonds, indicating dynamic but stable interactions. Overall, the results confirm that all inhibitors maintain stable H-bond networks within the binding pocket, with ERK1/2-33A forming the most persistent interactions, reflecting stronger binding stability.
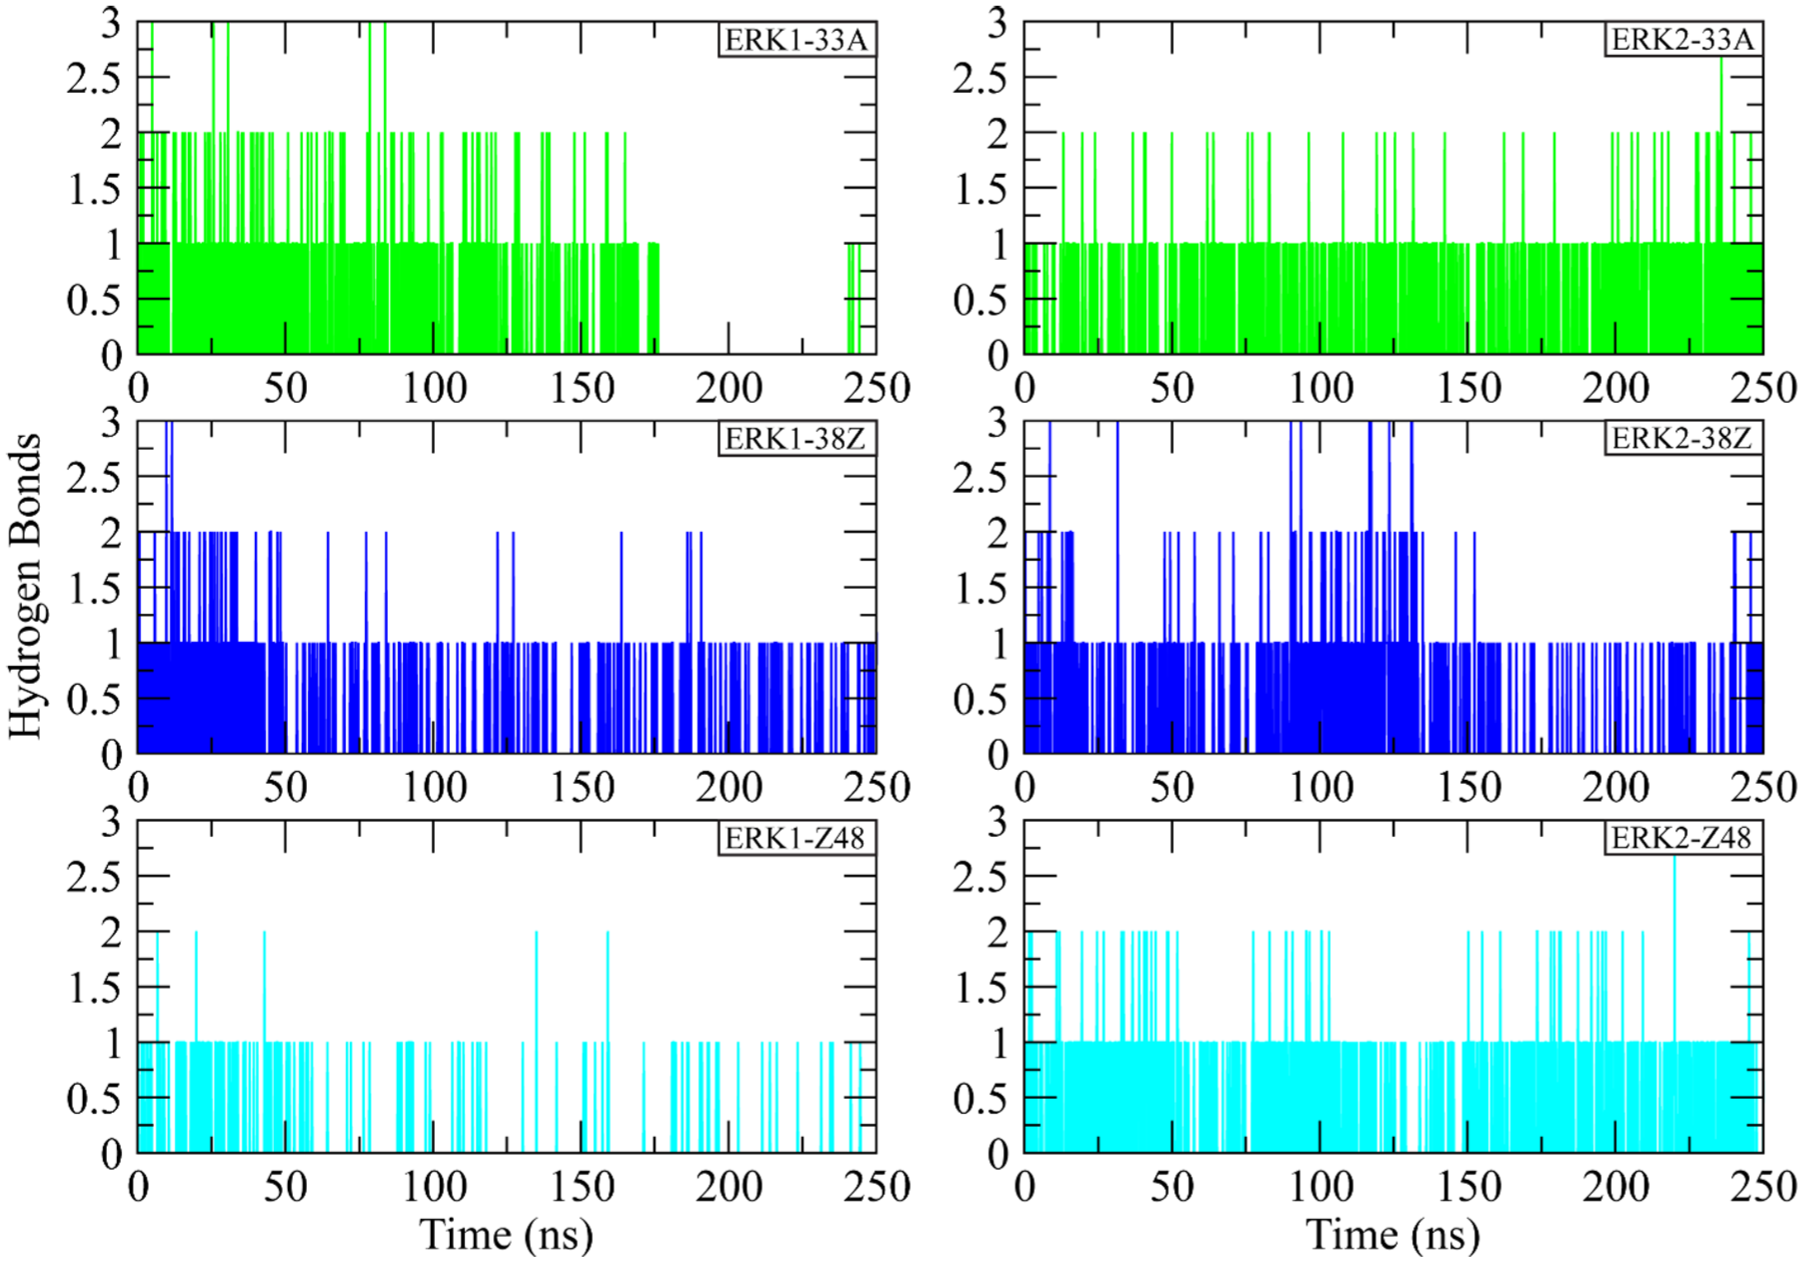
Hydrogen-bond profiles of ERK1 and ERK2 complexes during 250 ns of molecular dynamics simulation.
Protein-ligand contact analysis
To further characterize the strength and stability of inhibitor binding, the number of protein-ligand atomic contacts (<3.5 Å) was monitored throughout the 250 ns MD simulations. As shown in Figure 6, all ERK1 and ERK2 complexes maintained a steady number of contacts, confirming stable ligand interactions within the binding pocket. For ERK1 complexes, the ERK1-38Z complex exhibited the highest number of persistent contacts (averaging 30-50), indicating strong and continuous interactions with key active-site residues. The ERK1-33A and ERK1-Z48 complexes also showed stable contact profiles, ranging from 15 to 35 contacts during the simulation, reflecting well-maintained binding orientations with moderate flexibility. In ERK2 complexes, contact numbers were slightly higher overall, demonstrating more compact and stable binding. The ERK2-38Z complex maintained the greatest number of interactions (30-50 contacts), followed by ERK2-Z48 and ERK2-33A (20-40 contacts). The high density and persistence of contacts in ERK2 complexes suggest stronger inhibitor stabilization and tighter binding affinity compared to ERK1.

Protein-ligand contact profiles for ERK1 and ERK2 complexes during 250 ns of molecular dynamics simulation.
Artificial intelligence-based identification of conformational states
Principal component analysis and K-means clustering
Principal component analysis was performed on the Cα atomic coordinates of ERK1 and ERK2 complexes to investigate their conformational dynamics and identify dominant collective motions during the 250 ns simulations. The first 2 principal components (PC1 and PC2) captured most of the total variance, effectively describing large-scale structural rearrangements associated with ligand binding. The resulting 2-dimensional projections were subjected to K-means clustering (k = 3) to classify the trajectory into distinct conformational states. As shown in Figure 7, all ERK1 and ERK2 complexes exhibited clear partitioning into 3 major conformational basins, each corresponding to a unique structural substate. The ERK1-33A (Figure 7A) and ERK2-33A (Figure 7D) complexes displayed well-separated clusters, suggesting stable transitions between discrete conformations. In contrast, ERK1-38Z (Figure 7B) and ERK2-38Z (Figure 7E) showed partially overlapping states, reflecting smoother transitions and higher conformational flexibility. The Z48-bound systems (Figure 7C and 7F) exhibited a broader distribution in the PC1-PC2 space, indicative of enhanced dynamic sampling and moderate instability in the binding pocket. These findings demonstrate that each inhibitor induces distinct conformational preferences in ERK1/2, with 33A promoting more stable and well-defined conformational states, while 38Z and Z48 allow more extensive structural fluctuations and transitions.

Principal component analysis (PCA) and k-means clustering (k = 3) plots for ERK1 and ERK2 complexes based on 250 ns molecular dynamics trajectories. (A) ERK1-33A, (B) ERK1-38Z, (C) ERK1-Z48, (D) ERK2-33A, (E) ERK2-38Z, and (F) ERK2-Z48.
t-distributed stochastic neighbor embedding visualization
To complement the PCA results and capture nonlinear conformational variations, t-SNE was applied to the top 50 PCA components of the ERK1 and ERK2 trajectories. This nonlinear dimensionality-reduction method preserves local neighborhood relationships, providing a more detailed visualization of conformational transitions sampled during the 250 ns simulations. As shown in Figure 8, each ERK1/2-ligand system exhibited distinct cluster distributions, confirming the presence of multiple metastable states. The ERK1-33A (Figure 8A) and ERK2-33A (Figure 8D) complexes showed compact and well-separated clusters, suggesting stable conformational substates stabilized by the inhibitor. In contrast, ERK1-38Z (Figure 8B) and ERK2-38Z (Figure 8E) displayed extended, partially connected manifolds, indicating higher conformational flexibility and dynamic exchange among states. The Z48-bound systems (Figure 8C and F) revealed more diffuse and continuous trajectories, reflecting enhanced structural plasticity and broader exploration of the conformational space. The overall patterns observed in t-SNE space closely align with PCA-K-means clustering results, reinforcing the consistency of the AI-based conformational state identification. These findings underscore how different inhibitors uniquely modulate the dynamic equilibrium of ERK1/2, influencing the stability and diversity of the sampled conformations.
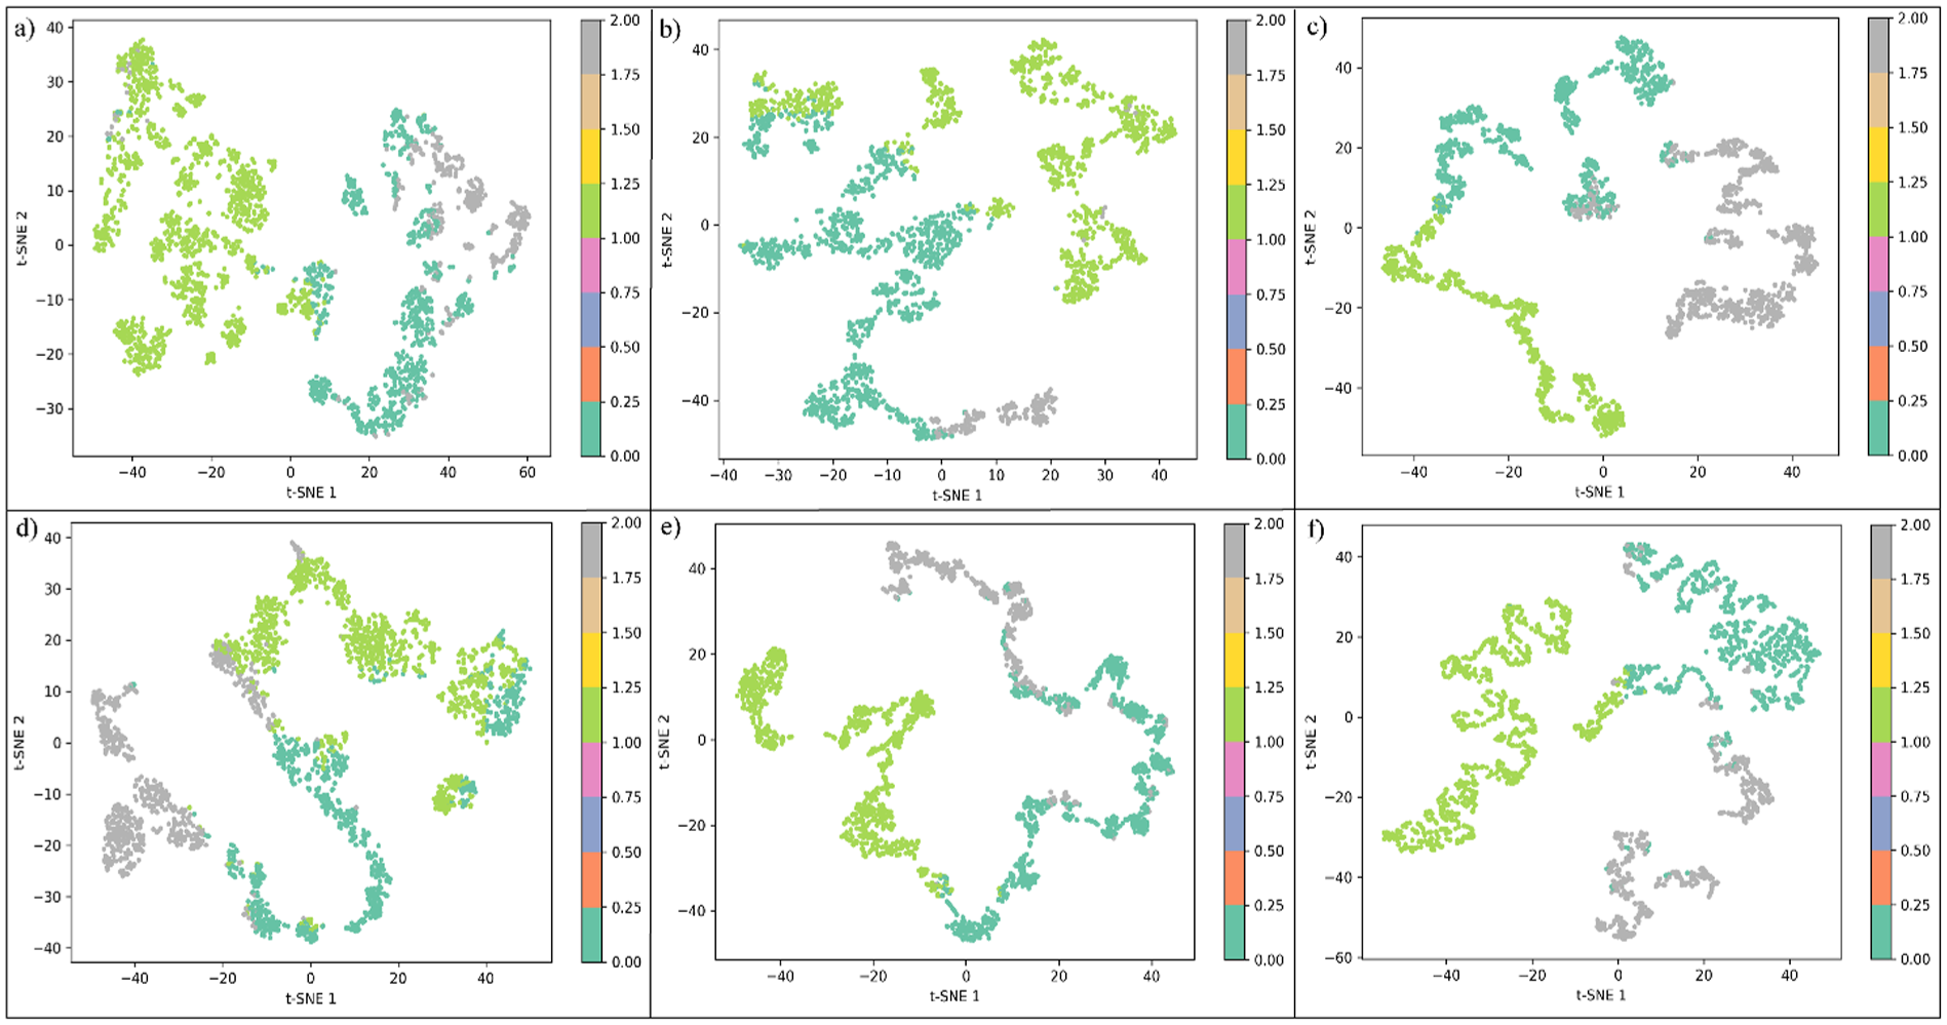
t-distributed Stochastic Neighbor Embedding (t-SNE) plots representing conformational clustering of ERK1 and ERK2 complexes during 250 ns molecular dynamics simulations. (A) ERK1-33A, (B) ERK1-38Z, (C) ERK1-Z48, (D) ERK2-33A, (E) ERK2-38Z, and (F) ERK2-Z48.
Conformational free energy landscape and state transition analysis
To investigate the conformational dynamics and stability of ERK1 and ERK2 in complex with inhibitors 33A, 38Z, and Z48, we performed PCA on the MD trajectories, followed by construction of 3-dimensional FELs projected along the first 2 principal components (PC1 and PC2). In addition, K-means clustering was applied to identify distinct conformational states, and transition probability matrices were generated to assess the stability and interconversion of these states.
Free energy landscape analysis
As shown in Figure 9, all complexes exhibited distinct energy basins, reflecting multiple metastable states populated during the 250 ns simulations. For ERK1 complexes, the ERK1-33A system displayed a broad multi-basin landscape with several deep minima, indicating conformational heterogeneity and the ability to sample diverse low-energy states. The ERK1-38Z and ERK1-Z48 complexes exhibited relatively narrower basins, suggesting greater structural stability and reduced conformational transitions. The ERK1-Z48 presented a single, well-defined global minimum, signifying a stable binding conformation that dominates throughout the simulation. Similarly, in ERK2 complexes, the ERK2-33A system displayed deeper and more distinct minima than its ERK1 counterpart, reflecting enhanced conformational adaptability. Conversely, ERK2-38Z and ERK2-Z48 maintained compact, energetically favorable basins with minimal dispersion, indicative of stable and persistent conformational states. Collectively, the FEL analysis suggests that Z48 binding promotes conformational rigidity, while 33A maintains higher flexibility, especially in ERK1, implying differential dynamic responses of ERK inhibitors.

Three-dimensional Free Energy Landscapes (FELs) of ERK1 and ERK2 complexes projected along the first 2 principal components (PC1 and PC2) over 250 ns MD trajectories. (A) ERK1-33A, (B) ERK1-38Z, (C) ERK1-Z48, (D) ERK2-33A, (E) ERK2-38Z, and (F) ERK2-Z48.
K-means state transition matrix analysis
To quantify the stability and interconversion of conformational states, transition probability matrices were derived from K-means clustering (k = 3) applied to the MD trajectories (Figure 10). The diagonal elements represent the probability of a system remaining within the same conformational state, while the off-diagonal elements indicate transitions between different states. All complexes displayed high self-transition probabilities (⩾0.90), confirming strong stability within individual states. The ERK1-33A and ERK2-33A complexes exhibited moderate inter-state exchange (up to 0.08), supporting the presence of multiple accessible conformations as revealed in the FELs. In contrast, the ERK1-38Z and ERK2-38Z complexes demonstrated highly stable behavior (self-transition ⩾ 0.95), suggesting restricted conformational flexibility. The Z48-bound complexes maintained intermediate behavior, with ERK1-Z48 showing slight inter-state transitions (~3-6%) and ERK2-Z48 exhibiting strong persistence within each state (⩾0.92). Overall, these results indicate that 33A allows more dynamic transitions between conformations, while 38Z and Z48 stabilize specific structural states, particularly in ERK2, highlighting their potential to induce energetically favorable and conformationally restrained binding modes.

State transition matrices derived from K-means clustering of MD trajectories into 3 conformational states for ERK1/2-inhibitor complexes. (A) ERK1-33A, (B) ERK1-38Z, (C) ERK1-Z48, (D) ERK2-33A, (E) ERK2-38Z, and (F) ERK2-Z48.
Binding free energy calculations
To ascertain the binding free energies of 33A, 38Z, and Z48 to ERK1 and ERK2, the MM/GBSA method was utilized. The outcomes of the MM/GBSA calculations for each of the 3 ligands attached to ERK1 and ERK2 are shown in Table 1.
Binding affinities of inhibitors to ERK1 and ERK2 calculated with MM/GBSA approach.
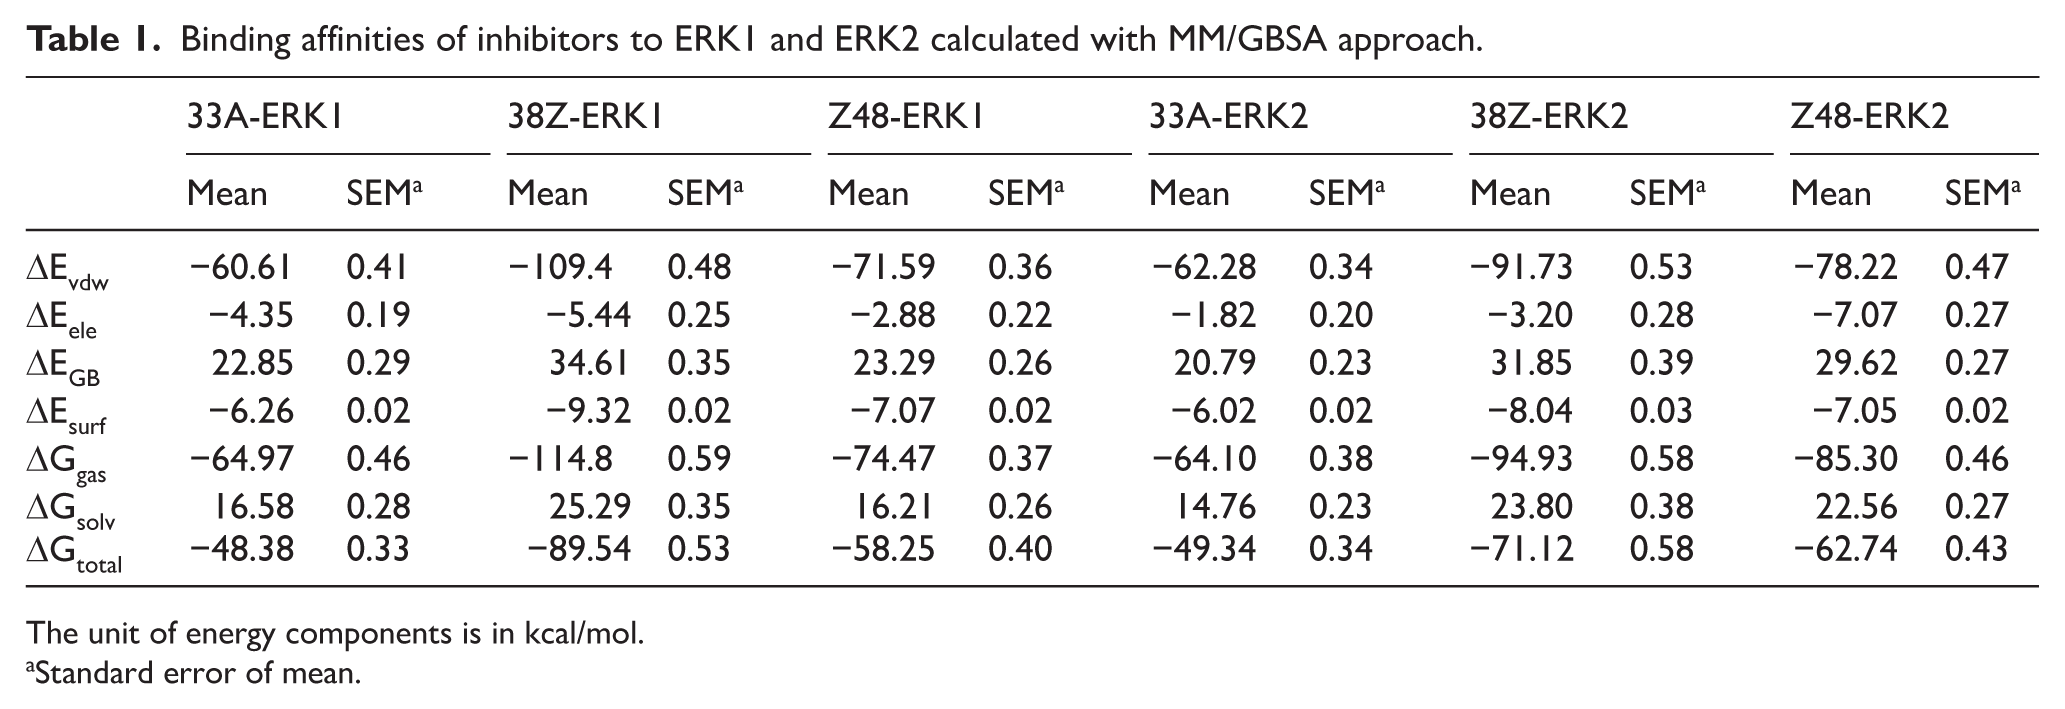
The unit of energy components is in kcal/mol.
Standard error of mean.
The ΔEvdW values for ERK1 complexes with 33A, 38Z, and Z48 were −60.61, −109.4, and −1.59 kcal/mol, respectively, whereas for ERK2, these values were −62.28, −91.73, and −78.22 kcal/mol, respectively. The ΔEvdW value was higher for ERK1-38Z compared to ERK1-33A and ERK1-Z48 complexes. A similar trend was observed in ERK2 complexes, where ERK2-38Z displayed stronger van der Waals interactions than ERK2-33A and ERK2-Z48. The ΔEele for ERK1-Z48 was −2.88 kcal/mol, whereas for ERK2-Z48, it was −7.07 kcal/mol. Contributions of electrostatic force were indicated that ERK2 complexes had greater energy associated with electrostatics than ERK1 complexes, except for the ERK1-38Z complex. Analysis of surface energies showed that the ERK1-38Z complex had a superior surface energy of −9.32 kcal/mol compared to other ERK1 complexes. ΔGtotal values for ERK1-33A (−48.38 kcal/mol), ERK1-38Z (−89.54 kcal/mol), ERK1-Z48 (− 58.25 kcal/mol), ERK2-33A (−49.34 kcal/mol), ERK2-38Z (−71.12 kcal/mol), and ERK2-Z48 (−62.74 kcal/mol) indicated that 38Z exhibited better selectivity toward both ERK1 and ERK2. Similarly, binding free energies for 38Z with ERK1 and ERK2 were stronger compared to 33A and Z48.
Binding selectivity analysis
Using the MM/GBSA approach, we were able to provide more information on the binding selectivity of inhibitors 33A, 38Z, and Z48 for ERK1 and ERK2. This was achieved by examining relationships among certain residues and the inhibitors. The breakdown of ΔGligand-residue values is shown in Table 2, where the contributions of the sidechains and backbones of important residues in ERK1 and ERK2 when bound by each inhibitor are described. Our outcomes show the key role sidechains play in the energy of inhibitor-residue interactions. Important residues in ERK1 and ERK2 with energies greater than −1 kcal/mol are identified in Figure 11 as being engaged in important inhibitor-residue interactions. Furthermore, we used the CPPTRAJ tool in Amber 21 to identify hydrogen-bond interactions (HBIs) between the inhibitors ERK1 and ERK2. The outcomes are summarized in Table 3.
Interactions between important ERK1 and ERK2 residues and 3 inhibitors (all values in kcal/mol).


Heatmap representation of per-residue binding energy contributions (kcal/mol) for 3 inhibitors (33A, 38Z, and Z48) bound to ERK1 and ERK2, as calculated using the MM/GBSA method.
Hydrogen-bonding interactions between inhibitors and ERK1/2 computed by the CPPTRAJ..

For the inhibitors 33A, 38Z, and Z48 bound to ERK1 and ERK2, distinct interaction profiles were observed across key residues as detailed in Table 2. In ERK1, 33A demonstrated notable interactions with residues such as I25 (−1.93 kcal/mol), V33 (−1.97 kcal/mol), L150 (−2.46 kcal/mol), and C160 (−1.50 kcal/mol), whereas in ERK2, these interactions were predominantly with I17 (−1.32 kcal/mol), V25 (−2.39 kcal/mol), L142 (−2.07 kcal/mol), and C152 (−1.82 kcal/mol). Hydrogen-bonding analyses from Table 3 indicated stable interactions, with 33A forming an H-bond between Met102H-----33A-C9 in ERK1 (occupancy 79.80%) and between Met94H-----33A-N12 in ERK2 (occupancy 80.86%).
Meanwhile, interactions larger than −1.00 kcal/mol were noted in residues I25 (−5.19 kcal/mol), V33 (−1.45 kcal/mol), L150 (−1.97 kcal/mol), and C160 (−1.29 kcal/mol) when 38Z attached to ERK1, and ERK2 has the residues I17 (−1.10 kcal/mol), V25 (−1.39 kcal/mol), L142 (−1.83 kcal/mol), and C152 (−1.27 kcal/mol). Hydrogen-bonding data indicated interactions with Met102H-----38Z-N8 in ERK1 (occupancy 81.66%) and with Cys152-HB2-----38Z-O1 in ERK2 (occupancy 83.74%) for 38Z, reinforcing its binding stability. Z48 also showed significant interactions, with the exact residues but with different total energy in ERK1 and in ERK2. Hydrogen-bonding interactions were observed with Lys48-HD2-----Z48-C29 in ERK1 (occupancy 66.50%) and with Met101H-----Z48N4 in ERK2 (occupancy 61.50%) for Z48, highlighting specific stabilizing interactions in both complexes. These results underscore the distinct binding modes and interactions of 33A, 38Z, and Z48 with ERK1 and ERK2, providing insights into their selectivity and potential as kinase inhibitors. These 4 common residue pairs (I25, I17), (V33, V25), (L150, L142), and (C160, C152) stronger than −1.00 kcal/mol have shown a significant impact on the inhibitor’s binding affinity, suggesting that they play a crucial role in deciding the inhibitors’ selectivity for ERK1 and ERK2. The binding modes are shown in Figure 12. In the ERK1-33A complex, the ligand is tightly anchored through hydrophobic contacts with Met125, Ile48, and Lys71, forming a stable π-alkyl interaction network that supports the aromatic scaffold of 33A. These nonpolar residues create a compact pocket, helping to stabilize the ligand in a planar orientation within the ATP-binding cleft. The ERK1-38Z complex displays a more extended conformation, engaging Asp123, Glu88, and Gln122 through polar interactions, while Lys131 and Leu173 contribute hydrophobic stabilization. The H-bonding interaction with Asp184 is particularly notable, suggesting a role in anchoring the ligand’s terminal amide group and maintaining the correct alignment for optimal binding. In contrast, the ERK1-Z48 complex shows hydrogen bonds with Lys71, Gln122, and Asp184, supported by van der Waals contacts from Met125 and Leu173. The orientation of Z48 allows its terminal phenyl ring to insert deeper into the hydrophobic groove, indicating a more buried and stable configuration than that of 38Z. For ERK2-33A, the inhibitor forms stabilizing hydrogen bonds with Lys52, Gln103, and Asp165, while hydrophobic residues Leu154, Met106, and Ile29 surround the ligand core, reinforcing its binding through van der Waals and π-alkyl interactions. The ERK2-38Z complex shows a balanced network of hydrophilic and hydrophobic interactions, with key hydrogen bonds involving Tyr34, Gln103, and Asp165, complemented by the surrounding Leu154 and Met106 residues. This suggests that 38Z may stabilize the catalytic loop region, influencing conformational rigidity around the active site. Finally, in the ERK2-Z48 complex, the ligand adopts a similar binding orientation to its ERK1 counterpart but interacts mainly with Lys52, Ile29, and Leu154, along with hydrogen bonding to Met100 and Ala50. The presence of these conserved interactions across both isoforms reflects a shared recognition pattern, but subtle shifts in residue positioning may account for the observed selectivity.
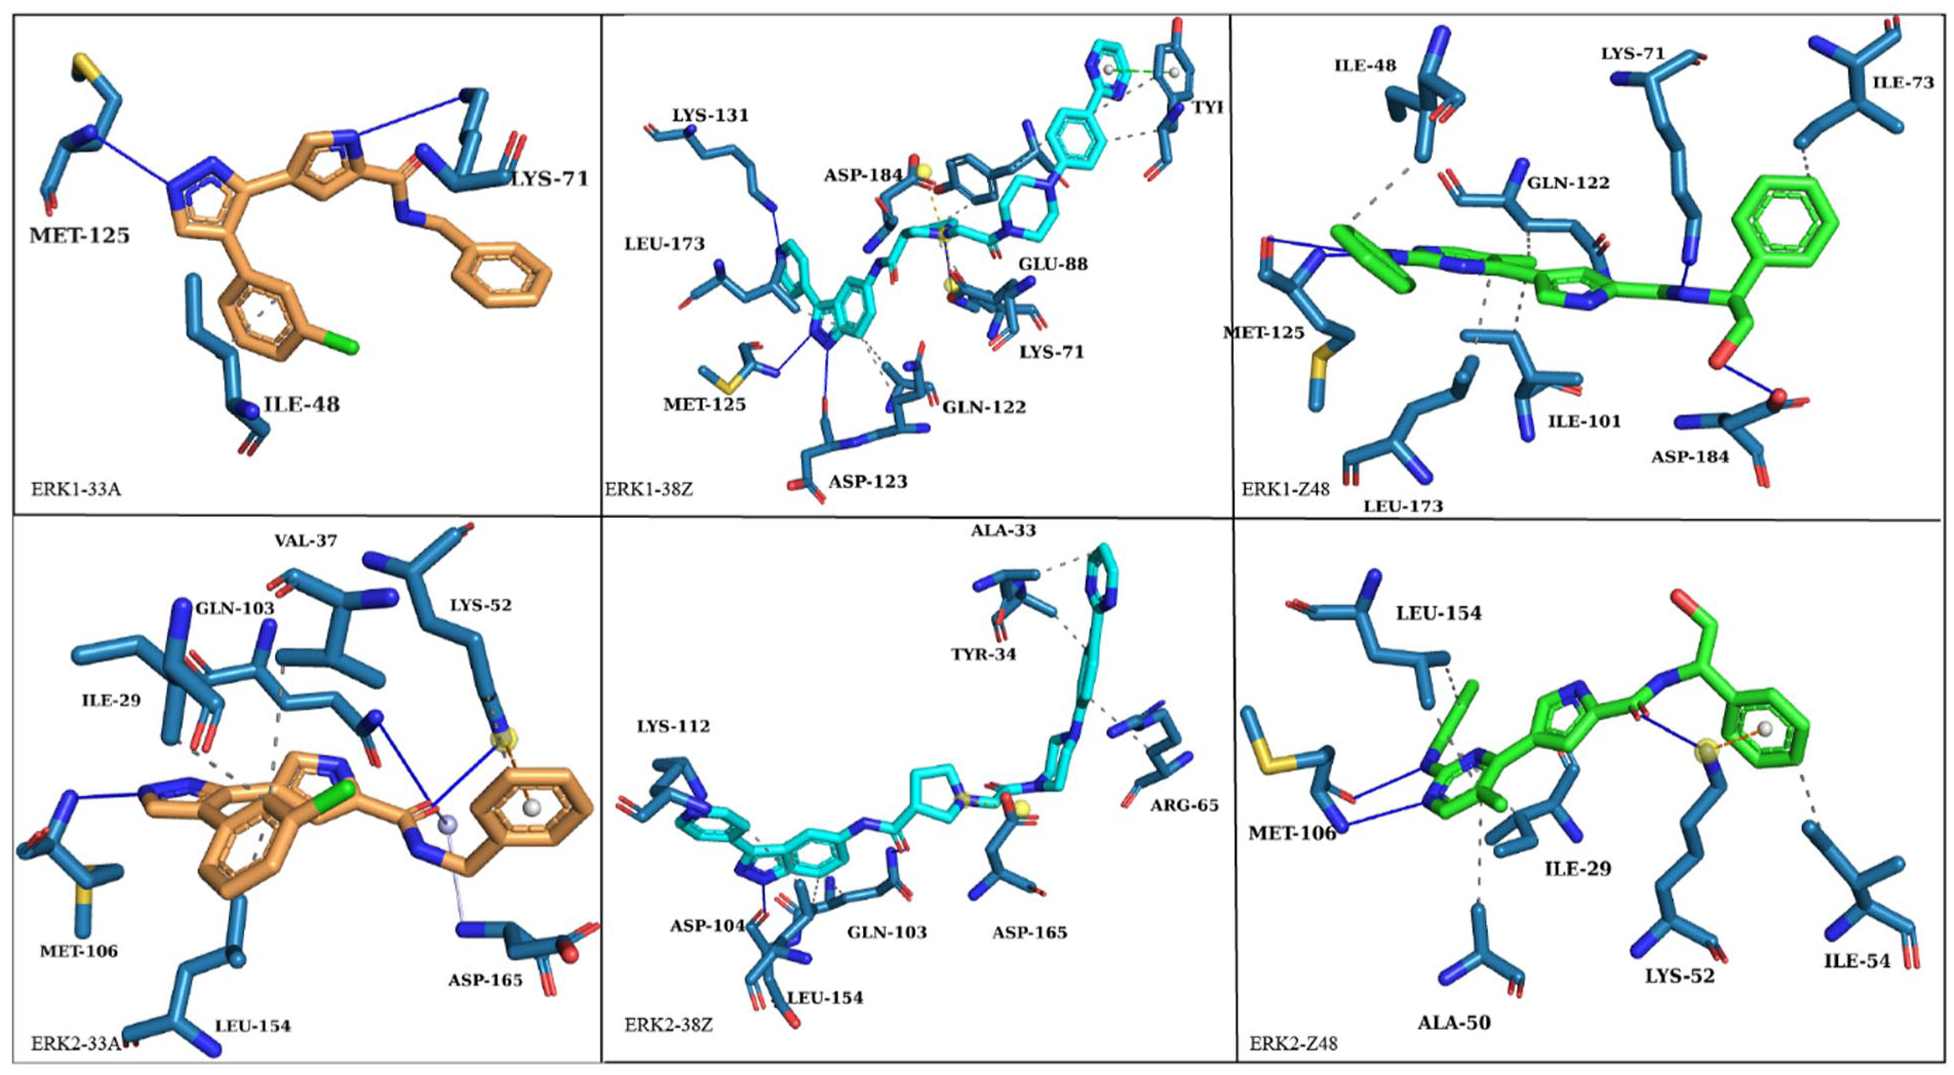
The binding modes of the inhibitors with the interacting residues of ERK1 and ERK2 proteins.
Discussion
This study provides an in-depth molecular and energetic understanding of how small-molecule inhibitors (33A, 38Z, and Z48) interact with ERK1 and ERK2 kinases. Through extended 250 ns MD simulations coupled with AI-driven conformational analyses and MM/GBSA energy decomposition, we delineated the conformational stability, flexibility, and isoform-specific binding mechanisms that underlie inhibitor selectivity.
The RMSD and Rg analyses confirmed that all ERK1/2-inhibitor complexes achieved equilibrium during the 250 ns simulations, indicating well-stabilized systems. Among the complexes, ERK1-33A exhibited larger Rg fluctuations, consistent with its greater structural flexibility. In contrast, ERK1-Z48 and ERK2-Z48 displayed the lowest RMSD and Rg variations, suggesting that Z48 confers higher conformational compactness and stability to both isoforms. The RMSF profiles further supported these observations: 33A induced higher fluctuations in loop and terminal regions, while 38Z and Z48 restricted flexibility around the active-site residues, stabilizing the catalytic pocket. Hydrogen-bond analysis revealed stable and recurrent protein-ligand contacts throughout the trajectories, with average occupancies exceeding 60%. Key stabilizing interactions were observed between Met102 and 38Z in ERK1 (81.6%) and Cys152 and 38Z in ERK2 (83.7%), as well as between Lys48 and Z48 in ERK1 (66.5%) and Met101 and Z48 in ERK2 (61.5%). These persistent hydrogen bonds, complemented by dense hydrophobic contacts (within 3.5 Å), underscore the critical residues responsible for ligand retention and binding stability. The MM/GBSA binding free energy decomposition highlighted strong van der Waals contributions as the primary stabilizing force, followed by electrostatic interactions. The binding free energies ranked as 38Z > Z48 > 33A, consistent across both ERK isoforms, demonstrating 38Z’s superior binding affinity. Key residues namely I25/I17, V33/V25, L150/L142, and C160/C152 exhibited energy contributions stronger than −1 kcal mol−1, confirming their pivotal roles in inhibitor binding and selectivity.35,36
In comparison to earlier works, which primarily focused on static docking models, this study provides a dynamic perspective by considering the full conformational space of the protein-ligand complexes. Our findings also corroborate existing literature suggesting that incorporating protein flexibility through MD simulations offers a more robust framework for predicting binding interactions. 37
Dimensionality-reduction analyses using PCA and t-SNE revealed distinct conformational basins representing metastable states of the ERK1/2 complexes. The PCA projections indicated that ERK1-33A and ERK2-33A explored wider conformational spaces, while Z48-bound systems exhibited compact clustering, reflecting a more stable conformational ensemble. The t-SNE embeddings preserved local conformational relationships and confirmed smooth transitions among neighboring states. Free energy landscape analysis supported these findings, where 38Z and Z48 complexes displayed better deep energy minimum profiles, contrasting with the multi-basin profiles of 33A. The K-means transition matrices showed high self-transition probabilities (>0.97), confirming the stability of dominant conformational states. These findings are consistent with studies that have shown how protein flexibility influences ligand binding and the overall activity of kinases.38,39
Unexpectedly, the study also revealed some discrepancies in the binding profiles of the inhibitors across different ERK isoforms. While the inhibitors demonstrated similar binding affinities for ERK1 and ERK2, subtle differences in the energetic contributions of the electrostatic and van der Waals interactions were observed. This finding suggests that isoform-specific interactions may be more significant than previously recognized, opening the door for the development of more selective inhibitors for each ERK isoform.
While the 250 ns simulations captured the essential conformational states, longer or enhanced-sampling trajectories (eg, REMD or metadynamics) could further elucidate rare transitions. In addition, expanding the ligand data set and integrating cryo-electron microscopy (cryo-EM) or nuclear magnetic resonance (NMR)-derived conformations could strengthen the structure-activity correlations. Future AI-integrated approaches may also employ supervised learning to predict binding energetics directly from structural descriptors. In summary, this study integrates extended MD simulations, energy decomposition, and AI-driven conformational analyses to provide atomistic insights into ERK1/2-inhibitor interactions. The results emphasize 38Z’s superior binding stability and reveal critical energetic residues that govern isoform selectivity, thereby offering a robust framework for rational design of next-generation ERK-targeted therapeutics.
Conclusion
This study integrated MD simulations, MM/GBSA binding free energy calculations, and AI-assisted conformational analyses to unravel the molecular basis of ERK1/2-inhibitor selectivity. Extended 250 ns simulations confirmed that all complexes achieved equilibrium, with ERK2 systems demonstrating higher structural stability and compactness compared to ERK1. Binding free energy decomposition revealed that hydrophobic residues such as Ile, Val, Leu, and Cys play critical roles in stabilizing inhibitor binding across both isoforms. Among the investigated compounds, 38Z exhibited the strongest binding affinity, forming persistent hydrogen bonds, while 33A induced greater flexibility and dynamic transitions, reflecting differential stabilization mechanisms. The AI-based PCA, t-SNE, and K-means analyses identified distinct metastable conformations and transition pathways, providing a comprehensive view of ligand-induced structural heterogeneity. Collectively, these findings highlight 38Z as the most promising candidate for selective ERK inhibition and demonstrate the power of integrating MD simulations with AI-driven conformational state mapping to elucidate isoform-specific binding behavior. This combined framework offers a valuable computational strategy for the rational design of next-generation kinase inhibitors with improved selectivity and stability.
Footnotes
Author Contributions
Funding
The author received no financial support for the research, authorship, and/or publication of this article.
Declaration of Conflicting Interests
The author declared no potential conflicts of interest with respect to the research, authorship, and/or publication of this article.