
Abstract
Lung adenocarcinoma (LUAD) has emerged as both the most frequently diagnosed malignancy and the predominant contributor to cancer-related mortality worldwide. Current clinical evidence indicates that a significant proportion of LUAD cases exhibit tumor cells characterized by accelerated proliferative activity, which contributes to the aggressive biological behavior. Six microarray data sets were retrieved from the Gene Expression Omnibus (GEO), and differentially expressed genes (DEGs) were identified using the robust rank aggregation (RRA) method. The mRNA and protein levels of selected genes were subsequently validated by quantitative real-time reverse transcription polymerase chain reaction (qRT-PCR) and western blot (WB). Short interfering RNA (siRNA)-mediated knockdown combined with EdU incorporation assays was employed to assess proliferation in LUAD cell lines. Chromatin immunoprecipitation (ChIP) assays confirmed that FOXM1 directly regulates the transcription of its target genes. A total of 291 DEGs (133 up-regulated and 158 down-regulated) were identified. Up-regulated genes were significantly enriched in cell-cycle pathways. The FOXM1 exhibited the strongest correlation with these cell-cycle genes and was shown by ChIP-seq to bind to the promoters of 49 of them. TOP2A, MELK, CENPF, NEK2, and KIF20A are the top 5 genes for further analysis in the The Cancer Genome Atlas (TCGA) database. These 5 genes are all highly expressed and show a worse prognosis in LUAD. Cell experiments showed that FOXM1 knockdown only inhibited the expression of CENPF and NEK2. Knocking down either FOXM1 or CENPF can inhibit the proliferation of LUAD cells. Overexpression of FOXM1 promoted CENPF expression and the proliferation of lung cancer cells. The predicted regulatory network of FOXM1 shows significant discrepancies with experimental validation data. Therefore, FOXM1’s regulatory role in the cell cycle requires further experimental verification.
Introduction
Lung cancer is one of the most commonly diagnosed cancer. 1 Lung adenocarcinoma (LUAD) and lung squamous cell carcinoma (LUSC), respectively, represent its 2 main histological subtypes. 2 There are many treatment options available, including chemotherapy, surgery, targeted therapy, radiation therapy, and immunotherapy; however, the cure rate for patients has increased little. In addition, despite significant advances in identifying key genetic drivers of non-small cell lung cancer (NSCLC) progression—including well-characterized oncogenes such as KRAS proto-oncogene, GTPase (KRAS) and Epidermal growth factor receptor (EGFR)—the vast majority of patients are still diagnosed at an incurable, advanced stage. 3 Therefore, studies on the mechanism of NSCLC tumorigenesis are critical for the early prognosis and the development of new treatments.
The mammalian cell-cycle progresses are regulated by many proteins, such as cyclin-dependent kinases (CDKs). Interestingly, animal models have demonstrated that some of these proteins are not essential for the development of most tissues. 4 FOXM1 is a transcription factor (TF). Under normal physiological conditions, FOXM1 expression increased during the S phase and reached a peak at G2-M. It also regulates the expression of some proteins associated with cell cycle. 5 FOXM1 is important to increased organoid proliferation in benign meningioma organoids. 6 Furthermore, high FOXM1 expression showed significant correlation with poor PFS in SCLC patients undergoing standard chemotherapy. 7 The DKK1 and FOXM1 establish a mutually reinforcing loop that significantly enhances proliferation. 8 YES1 maintains FOXM1 protein stability and subsequently upregulates FOXM1-regulated transcriptional targets involved in centrosome regulation, thereby ensuring mitotic progression. 9
While FOXM1 has been established as a diagnostic biomarker for certain malignancies and is known to drive tumor proliferation, its specific function within the cell-cycle regulatory network of LUAD remains unexplored. In this study, TOP2A, MELK, NEK2, KIF20A, and CENPF are all highly expressed and showed poor prognosis, and these genes were significantly correlated with TF FOXM1. And FOXM1 and CENPF were selected to further validate their proliferative function in cells.
Methods
Gene expression profile data
Microarray data (GSE116959, 10 GSE27262, 11 GSE32863, 12 GSE11969, 13 GSE7670, 14 and GSE43458) 15 were downloaded from the Gene Expression Omnibus (GEO). They all meet the following criteria: (1) including human LUAD samples, (2) containing normal samples, and (3) containing at least 20 samples. The R analysis process is borrowed from Liu et al. 16
Integrated analysis of microarray data sets
The Limma package 17 was used to analyze differentially expressed genes (DEGs). The R package “RobustRankAggreg” 18 was used to perform genetic integration. Statistically significant need to satisfy the following conditions: |log2FC| ⩾ 1, adjust P-value < .05.
Functional enrichment analysis of differentially expressed genes
The Gene Ontology (GO) enrichment 19 and Kyoto Encyclopedia of Genes and Genomes (KEGG) were used to analyze which pathways were abundant in DEGs. 20
Cell culture
A549 and SPC-A1 cell lines were obtained from the Chinese Academy of Sciences Shanghai Cell Bank (Shanghai, China).
Small interfering RNA transfection
Cells (3 × 10⁵) were seeded in 12-well plates, 37°C, 5% CO2, cultured overnight. Then, riboFECTTM CP kit (RIBOBIO, Guangzhou, China) was used in transfecting CENPF, FOXM1, or negative control (NC) short interfering RNA (siRNA) (50 nmol/L). The siRNA sequence includes siCENPF, 5’-GCUACAACUUUUAUCCGAA-3’; siFOXM1-1: 5’-GGAUCAAGAUUAUUAACCA-3’; and siFOXM1-2: 5’-CACUAUCAACAAUAGCCUA-3’.
Plasmid transfection
The FOXM1 overexpression plasmid and NC plasmid were purchased from Vigene Biosciences (Shandong, China). Lipofectamine 3000 (Thermo Fisher Scientific, Waltham, Massachusetts) was used to transfect these vectors, following the manufacturer’s instructions. Cells were harvested after 48 hours and stored at −80°C.
Quantitative real-time reverse transcription polymerase chain reaction
The RNA was extracted by RNAiso Plus (TaKaRa). Total RNA (1 μg) was retrotranscribed with an RT reagent Kit with gDNA Eraser (TaKaRa). The SYBR Green (TaKaRa) was used in quantitative polymerase chain reaction (qPCR). The GAPDH was used as a reference gene. The primers include GAPDH, forward 5’-GGTCTCCTCTGACTTCAACA-3’, reverse 5’-AGCCAAATTCGTTGTCATAC-3’; FOXM1, forward 5’-CGTCGGCCACTGATTCTCAAA-3’, reverse 5’-GGCAGGGGATCTCTTAGGTTC-3’; CENPF, forward 5’-CTCTCCCGTCAACAGCGTTC-3’, reverse 5’-GTTGTGCATATTCTTGGCTTGC-3’; TOP2A, forward 5’- ACCATTGCAGCCTGTAAATGA-3’, reverse, 5’-GGGCGGAGCAAAATATGTTCC-3’; MELK, forward, 5’-TCTCCCAGTAGCATTCTGCTT-3’, reverse, 5’-TGATCCAGGGATGGTTCAATAGA-3’; NEK2, forward, 5’-TGCTTCGTGAACTGAAACATCC-3’, reverse, 5’-CCAGAGTCAACTGAGTCATCACT-3’; and KIF20A, forward, 5’-TGCTGTCCGATGACGATGTC-3’, reverse, 5’-AGGTTCTTGCGTACCACAGAC-3’. The 2−ΔΔCT method was selected.
Immunoblotting assays
The total protein from cultured cell lines was extracted by RIPA buffer (Beyotime, Jiangsu, China). Proteins (30 μg) were separated on 4% to 20% ExpressPlus PAGE Gels (M42015C, GenScript, China). After being separated by electrophoresis, the proteins were electroblotted onto PVDF membranes (Merck Millipore). Then, membranes were blocked for 1 h by 5% BSA (Boster, AR0004) and incubated overnight with mouse monoclonal anti-GAPDH (BM3876, Boster), rabbit anti-FOXM1 (#20459, CST), or rabbit anti-CENPF (ab5, Abcam). And a corresponding secondary antibody was used.
Proliferation assays
The proliferation of cultured cell lines was evaluated by the EdU Assay Kit (GeneCopoeia, Rockville, Maryland). A549 and SPC-A1 cells were incubated with 10% fetal bovine serum (FBS) medium containing EdU (30 μM) for 6 hours, and according to the manufacturer’s recommended dyeing scheme for analysis.
Chromatin immunoprecipitation
Cistrome Data Browser (http://cistrome.org/db/#/) was used to analyze the binding sites: 21 CistromeDB: 46093, 22 46350, 22 and 53254 23 were chosen.
The SimpleChIP Plus enzymatic chromatin IP kit (Cell Signaling, cat. #9005) was used in this assay, using 4 × 10⁶ cells per assay. Sheared chromatin was immunoprecipitated overnight at 4°C using 5 μg anti-FOXM1 antibody (#20459, CST). Control ChIP reactions were conducted with normal rabbit IgG. The primers were used: CENPF: forward: 5’-TCCAAAACCGCGTCTAGCAT-3’, reverse: 5’-GATTGGCCCTTTCGGATGGA-3’ and NEK2: forward: 5’-GCCCTGATCTCGCAGTCTATT-3’, forward: 5’-CTCGGTTACCTTGGCGATCT-3’.
Statistical analyses
SPSS software 20.0 was used for statistical analysis of functional and biochemical in vitro and in vivo studies. All dot plots were generated using GraphPad Prism 6. All the data are presented as the mean ± standard error of the mean (SEM). P < .05 (Student t-test) was considered significant. Each experiment was performed in triplicate.
Results
Identification of differentially expressed genes and functional enrichment analysis of differentially expressed genes
Six GEO data sets were included in this study, with their sample details summarized in Table 1. Integrated analysis identified 291 differentially expressed genes (DEGs), comprising 158 down-regulated (Supplementary Table 1) and 133 up-regulated genes (Supplementary Table 2). The top 20 dysregulated genes in each category are visually presented in Figure 1A.
Six GEO data sets included in the current study.


Functional enrichment analysis of the DEGs. (A) Heat maps of the top 20 up-regulated and top 20 down-regulated DEGs. (B, C) KEGG pathway enrichment analysis of the DEGs. (D) Top 10 up-regulated and (E) 10 down-regulated GO enrichment analysis of the DEGs.
To explore the biological roles of the 291 differentially expressed genes, we performed comprehensive GO and KEGG enrichment analyses. The KEGG pathway mapping revealed that up-regulated genes were concentrated in metabolic pathways and the cell cycle (Figure 1B), while down-regulated genes were chiefly associated with cytokine-cytokine receptor interaction and cell adhesion molecules (Figure 1C). The GO analysis revealed significant enrichment in the following pathways: in up-regulated group, mitotic cell cycle, non–membrane-bounded organelle, microtubule cytoskeleton, and catalytic activity (Figure 1D), and in down-regulated group, chemical, non–membrane-bounded organelle, and cation binding (Figure 1E).
Direct regulation analysis of cell-cycle–enriched genes
Then, we listed all the genes related to the cell cycle in DEGs (Figure 2A). It is well established that gene expression is directly controlled by TFs. We therefore analyzed TFs among DEGs. As shown in Figure 2B, 7 TFs were up-regulated and 19 down-regulated. We subsequently analyzed correlations between TFs and cell-cycle–related genes. This analysis revealed a strong correlation between FOXM1 and up-regulated genes (Figure 2C). This suggests that FOXM1 may directly regulate these genes or operate within comparable regulatory frameworks.

The correlation between transcription factors and cell-cycle–related genes in DEGs. (A) Heat maps of the DEGs in cell cycle in GO enrichment analysis. (B) Heat maps of the transcription factors in DEGs. (C) The correlation between transcription factors and cell-cycle–related genes.
We downloaded 3 FOXM1 ChIP-seq data sets from the Cistrome website (CistromeDB ID: 46093, 46350, and 53254). A score ⩾0.8 was chosen, and they were intersected with the cell-cycle–related genes to identify 49 shared genes (Figure 3A and B). This finding implies that the TF FOXM1 can bind to the promoter regions of these 49 genes, suggesting that these genes may be directly regulated by FOXM1.

ChIP-seq analysis of cell-cycle–enriched genes directly regulated by FOXM1. (A) The Venn diagram of 3 ChIP-seq results (CistromeDB: 46093, 46350, 53254) and cell-cycle–enriched genes. (B) List of 49 common genes.
Expression characteristics of top 5 genes in cell cycle in lung adenocarcinoma in TCGA
According to the results of GO enrichment and the results of direct regulation analysis of cell-cycle–enriched genes, we found 49 genes can be directly regulated by FOXM1. The number of genes was too large, and the top 5 genes (TOP2A, MELK, CENPF, NEK2, KIF20A) were chosen to further study in the TCGA database. Analysis of the Gene Expression Profiling Interactive Analysis (GEPIA) data set revealed significantly elevated mRNA expression of TOP2A, MELK, CENPF, NEK2, and KIF20A in cancer tissues (Figure 4A). And FOXM1 showed high correlation with all the 5 genes (TOP2A, R = 0.8; MELK, R = 0.8; CENPF, R = 0.82; NEK2, R = 0.79; KIF20A, R = 0.82) (Figure 4B). Survival analysis was conducted using the KM-Plot online tool, which revealed that patients exhibiting high expression levels of any of these genes demonstrated significantly poorer survival outcomes (Figure 4C). Then, we investigated whether FOXM1 binds to the promoter region of the 5 genes in the Cistrome database (Cistrome ID: 39443). The results revealed a putative binding site for FOXM1 in the promoter region of CENPF, TOP2A, NEK2, and KIF20A (Figure 4D).

The expression pattern and prognostic value of top 5 genes in cell cycle. (A) Top 5 genes are all more highly expressed in LUAD tissues than in normal tissues in TCGA database. (B) FOXM1 expression showed very high correlation with all the 5 genes in LUAD (data from TCGA). (C) The Kaplan-Meier analysis of the 5 genes in the TCGA database. (D) The predicted binding sites of FOXM1 on the TOP2A, MELK, CENPF, NEK2, and KIF20A promoter region in the Cistrome database.
FOXM1 only regulates CENPF and NEK2 expression among the 5 genes
To verify the regulatory role between FOXM1 and these 5 genes, we used interfering RNA to knock down FOXM1 expression. The results showed that only CENPF and NEK2 expression reduced after FOXM1 knockdown, the expression of TOP2A, MELK, and KIF20A showed no significant change (Figure 5A). Since FOXM1 only regulates the expression of CENPF and NEK2, we further conducted ChIP experiments. The results showed that FOXM1 can bind to the promoter region of CENPF and NEK2 (Figure 5B).
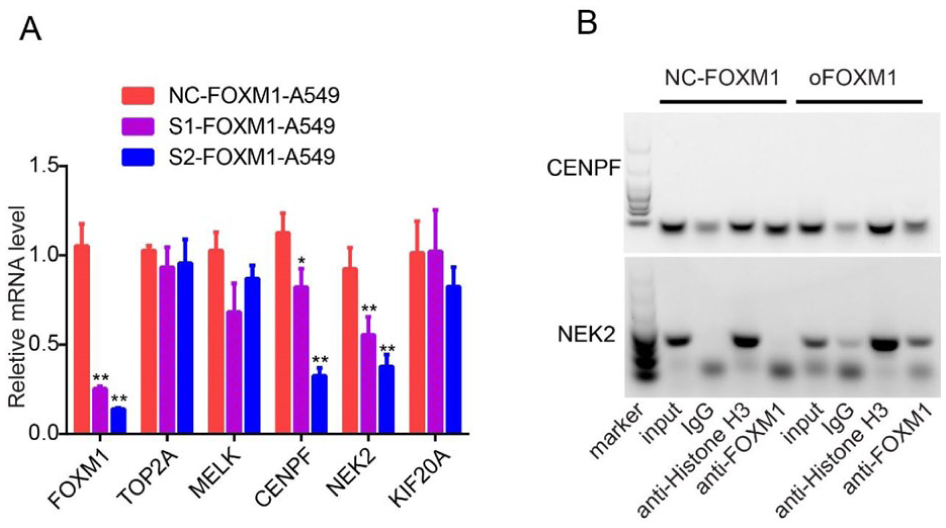
FOXM1 only regulates CENPF and NEK2 expression among the 5 genes. (A) qPCR analysis of the 5 genes’ expression in A549 cells transfected with control siRNA or siFOXM1. (B) The ChIP results of FOXM1 on CENPF and NEK2 promotor.
FOXM1 silencing inhibits proliferation in lung adenocarcinoma cells
Therefore, in order to further investigate whether these genes really play an important role in the proliferation of LUAD, we further selected FOXM1 and CENPF for cell-level studies. The siRNAs (siFOXM1) were designed to knock down FOXM1 expression. At first, the efficiency of knockdown in the 2 cell lines was examined (Figure 6A and B). The EdU proliferation assays demonstrated that FOXM1 silencing significantly inhibited the growth of both cell lines (Figure 6C and D). To further investigate the downstream effects, we examined CENPF expression following FOXM1 knockdown. Quantitative analysis revealed that FOXM1 depletion led to a marked reduction in both CENPF mRNA transcripts (Figure 6E) and corresponding protein levels (Figure 6F).

FOXM1 silencing inhibits proliferation in LUAD cells. (A) qPCR analysis of FOXM1 expression in A549 and SPC-A1 cells transfected with control siRNA or siFOXM1. (B) Immunoblot analysis of FOXM1 expression in A549 and SPC-A1 cells transfected with control siRNA or siFOXM1. (C) and (D) Cell proliferation rates as determined by EdU assays in A549 (C) and SPC-A1 (D) cells transfected with control siRNA or siFOXM1. (E) qPCR results showing reduced CENPF expression after knockdown of FOXM1. (F) Western blot assays showed reduced CENPF expression after knockdown of FOXM1. Experiments were repeated at least 3 times.
Overexpression of FOXM1 promotes proliferation of lung adenocarcinoma cells
To substantiate the regulatory role of FOXM1 in CENPF expression and its proliferative effects in LUAD cells, we established FOXM1-overexpressing A549 cell lines. Quantitative PCR and western blot (WB) analyses confirmed successful FOXM1 overexpression (Figure 7A and B). Importantly, EdU assays demonstrated that FOXM1 overexpression significantly enhanced the proliferative capacity of A549 cells (Figure 7C and D), further supporting its oncogenic function in LUAD progression.

Overexpression of FOXM1 promotes proliferation in LUAD cells. (A) qPCR results showing increased CENPF expression after overexpression of FOXM1. (B) Western blot assays showing increased CENPF expression after overexpression of FOXM1. (C) EdU assay results showing that overexpression of FOXM1 promoted proliferation of A549 cells. (D) Statistical results of EDU experiments.
Discussion
All malignancies have the ability to proliferate rapidly, and this ability is controlled by a complex network of signals. To date, there have been many analyses of signal networks in NSCLC. However, all of them have done a lot of analysis only in the aspect of information biology analysis and lack of experimental support. Firoz Ahmed found TFs (FOXM1 and MYBL2) regulate the “driver-network” of cell proliferation in NSCLC. 24 Ni et al 25 identified 6 crucial genes (TOP2A, CCNB1, CCNA2, UBE2C, KIF20A, and IL-6) that demonstrate significant associations with both the pathogenesis and clinical prognosis of NSCLC. Wang et al 26 propose an integration method to identify functional modules and their candidate targets in NSCLC and found that interactions between proteins GNG11, CXCR2, CXCL3, and PPBP showed therapeutic significance. In this study, we found that the expression of TOP2A, MELK, CENPF, NEK2, and KIF20A is extremely low in normal tissues. And these 5 genes were all highly consistent with FOXM1. But, FOXM1 only regulates the expression of CENPF and NEK2. This result indicates that the results of bioinformation analysis may not be in good agreement with the experimental results, and the results of bioinformatics need further experimental verification.
In addition, FOXM1 and CENPF silencing caused inhibition of the proliferation in LUAD cells. The FOXM1 can directly regulate CENPF and NEK2 expression. Therefore, a fuller understanding of the regulatory network that promotes proliferation in LUAD may have a great role in promoting the treatment of LUAD. The FOXM1 is highly expressed in lung cancer, breast cancer, ovarian cancer, liver cancer, colorectal cancer, melanoma, gastric cancer, and other human cancers; 27 these data are consistent with those we obtained from the TCGA database. Inhibition of FOXM1 expression inhibits cell proliferation, migration, metastasis, angiogenesis, and epithelial-mesenchymal transition (EMT) and leads to decreased drug resistance. 28 FOXM1 regulates many downstream genes, including CENPF. In addition, the study has found that NSCLC with high CENPF or FOXM1 expression showed a worse prognosis. 29 We further confirmed that FOXM1 directly regulates CENPF expression and promotes the proliferation of LUAD cells. The CENPF gene is highly expressed in metastatic prostate cancer, and TFII-FOXM1-CENPF axis can promote its metastasis. 30
The CENPF is a human kinetochore protein of approximately 400 kDa. The CENPF is vital for normal preimplantation development. The CENPF knockout is lethal to embryos. 31 Many studies have reported that CENPF is highly expressed in various tumors, such as Wilms tumors, 32 pancreatic carcinoma, 33 and bladder cancer. 34 Silencing CENPF decreased proliferation, colony formation, and tumor induction in nude mice. 35 Brown et al 36 first discovered that zoledronic acid targeting regulates CENPF in breast tumors and may play an anti-tumor role by destroying the location of its centromeres. Therefore, FOXM1 or CENPF gene can be used as a marker for the diagnosis of LUAD, and even a specific inhibitor of LUAD has been designed, which provides a new idea for future basic and clinical research.
Supplemental Material
sj-xls-1-bbi-10.1177_11779322251407068 – Supplemental material for Integrated Network Analysis Reveals a Directly Regulatory Network of FOXM1 Associated With the Cell Cycle in Lung Adenocarcinoma
Supplemental material, sj-xls-1-bbi-10.1177_11779322251407068 for Integrated Network Analysis Reveals a Directly Regulatory Network of FOXM1 Associated With the Cell Cycle in Lung Adenocarcinoma by Yuetao Zhao and Diangang Chen in Bioinformatics and Biology Insights
Supplemental Material
sj-xls-2-bbi-10.1177_11779322251407068 – Supplemental material for Integrated Network Analysis Reveals a Directly Regulatory Network of FOXM1 Associated With the Cell Cycle in Lung Adenocarcinoma
Supplemental material, sj-xls-2-bbi-10.1177_11779322251407068 for Integrated Network Analysis Reveals a Directly Regulatory Network of FOXM1 Associated With the Cell Cycle in Lung Adenocarcinoma by Yuetao Zhao and Diangang Chen in Bioinformatics and Biology Insights
Footnotes
Author contributions
Yuetao Zhao: Formal analysis; Investigation; Resources; Software; Data curation; Visualization; Writing—original draft preparation.Diangang Chen: Methodology; Validation; Writing—review and editing; Supervision; Project administration; Funding acquisition.
Funding
The authors disclosed receipt of the following financial support for the research, authorship, and/or publication of this article: This work was supported by Natural Science Foundation of Chongqing, China[cstc2021jcyj-msxmX0588] and the Youth Development Project of the Army Medical University [2021XQN02] from Diangang Chen.
Declaration of conflicting interests
The authors declared no potential conflicts of interest with respect to the research, authorship, and/or publication of this article.
Supplemental material
Supplemental material for this article is available online.
References
Supplementary Material
Please find the following supplemental material available below.
For Open Access articles published under a Creative Commons License, all supplemental material carries the same license as the article it is associated with.
For non-Open Access articles published, all supplemental material carries a non-exclusive license, and permission requests for re-use of supplemental material or any part of supplemental material shall be sent directly to the copyright owner as specified in the copyright notice associated with the article.