
Abstract
Over 6 million people are estimated to have been living with Alzheimer disease (AD) in 2020, with another 12 million living with Mild Cognitive Impairment (MCI). Research has been conducted to evaluate genetic links to AD, but more research is needed to improve early disease detection and improve patient outcomes. Diagnostic, demographic information, and single nucleotide polymorphism (SNP) data were collected by the Alzheimer’s Disease Neuroimaging Initiative (ADNI). We performed LASSO regression with conditional selective inference to perform feature selection on the SNPs and other predictors (which included education, race, and marital status), which reduced the number of SNPs from 55 106 to 13 and removed all non-SNP predictors except years of education and marital status. The included SNPs reside in genes that have clinical significance and may be associated with diseases that affect cognitive performance. The results propose the alternative alleles for 7 SNPs are associated with increased risk of AD/MCI diagnosis, while 6 SNPs are associated with decreased risk of diagnosis. The results point to a new potential pathway of disease regarding the PAK5 gene and the Tau protein hypothesis, which is supported by previous research. This research may have clinical implications and should be further studied.

Introduction
Alzheimer disease (AD) is the most common cause of dementia. 1 The disease is characterized by memory loss, difficulty with problem-solving, delusions, and performing basic tasks. People with AD may also experience behavioral issues, and the late stages of the disease may cause an inability to communicate and seizures. 2 More than 6 million people are estimated to have been living with AD in 2020 in the United States, and that prevalence is expected to more than double by 2060. An estimated 12 million people had been living with Mild Cognitive Impairment (MCI) in 2020, with a projection of close to 22 million people living with MCI in 2060. 3 The MCI may include symptoms of cognitive decline, but the symptoms do not significantly impact the sufferer’s basic functioning. 4 The MCI may lead to AD, but some individuals with MCI will never develop AD.2,4 Among Americans aged 65 and older, over 11% had clinical AD in 2020. 3 With such increases in prevalence projected, the burden on disease sufferers, their families and caretakers, and the health care system may also increase.
Several theories exist in terms of contributing causes of AD. The most studied theory is the amyloid-beta (Aβ) hypothesis. According to this, Aβ, which forms from the breakdown of amyloid precursor protein (APP) in the brain, aggregates to form plaques. These plaques damage neurons, specifically causing damage to the neuronal dendrites.5,6 However, the timeframe from the formation of Aβ plaques to the presence of AD symptoms is more than 20 years. 7 Another theory of the cause of AD is the Tau protein hypothesis. Tau protein, usually involved in the stabilization of microtubules in neurons, can become hyperphosphorylated, causing it to misfold and form paired helical filaments, 8 leading to disruption of neuronal microtubules. This disruption causes neurons to starve, leading to neuron death. 5
The AD may also have genetic risk components. The strongest known genetic risk factor involves the Apolipoprotein E gene. The E4 allele, known as APOE4, is thought to influence Aβ plaques, abnormal Tau protein tangles, and brain inflammation. However, unlike APOE4, the related APOE2 allele decreases the risk of AD. 1 Also, some recent research has found a connection between APOE4 homozygosity and AD. 9
The Alzheimer’s Disease Neuroimaging Initiative (ADNI) is a longitudinal study with the goal of improving early detection of AD through the study of imaging, genetic, and other data collected from participants throughout the United States and Canada. The ADNI receives public and private funding and has been ongoing since 2004. The first phase of the study, ADNI-1, was conducted from 2004 to 2009 with the goal of developing biomarkers that could be used as outcomes for clinical trials and included 800 participants. 10
The ADNI-GO was a 2-year extension of the project started in 2009, and ADNI-2 was a 5-year extension of the project started in 2011. The ADNI-GO and ADNI-2 added a respective 200 and 550 new participants, with both also including participants from previous study versions. The ADNI-GO sought to examine biomarkers in early disease stages, and ADNI-2 sought to use biomarkers as predictors of disease. The ADNI-3 was a 5-year extension started in 2016, although its results have not all been released as of February 2024. It added another 371 participants and began studying Tau scans for use in clinical trials. 10
The study overall includes 1921 participants: 483 healthy elderly control participants; 1001 participants with MCI; and 437 participants with AD. Participants were followed over time to study various diagnostic measurements, genetic testing, and various scans, including cognitive tests, magnetic resonance imaging (MRI) scans, and positron emission tomography (PET) scans. 11 Over 3700 articles have been published that use ADNI data as of February 2024. 12 This research has indicated various associations with biomarkers and AD and MCI diagnoses.
Current testing for AD (through PET scans and cerebrospinal fluid tests to test for Aβ, for example) is invasive and expensive, with the potential to produce adverse effects, and is not widely available. 7 Cheaper, more reliable, and less invasive testing for AD and MCI would therefore be beneficial for providing more widespread screening. Since many clinical trials involving participants who already have clinical AD have led to poor results, it would be beneficial to conduct testing and provide treatment as early as possible. 7 This provides motivation for genetic testing, as it can be done through easier testing (ADNI mainly used peripheral blood tests) 13 and can be done at any time.
APOE4, as mentioned, is 1 potential risk factor involved in AD diagnosis. However, it is reasonable to expect that AD and MCI have other genetic risk factors that have yet to be characterized. This research seeks to examine relationships between various single nucleotide polymorphisms (SNPs) and diagnosis of AD or MCI, with further review being conducted on genes that contain any associated SNPs.
Methods
Study design
In ADNI-1 and ADNI-GO/2, genetic data were collected through blood samples (ADNI-GO and ADNI-2 had a combined genetic data collection period, with no participant overlap) in addition to various scans and biospecimen collections. These samples were genotpyed using Illumina bead-based microarrays, although ADNI-1 used the Illumina Human610-Quad BeadChip while ADNI-GO/2 used the Illumina HumanOmniExpress BeadChip. 14 The presence of A/B alleles for SNPs served to help eliminate confusion when working with the different methods used in the ADNI versions. Each ADNI version includes over 600 000 genetic markers, 15 including SNP and copy number variation (CNV) data. Data regarding chromosome and position, B allele frequency, and other data about SNPs and CNVs were collected. In ADNI-1, participants attended a screening visit, a baseline visit, and follow-up visits at 6, 12, 18, 24, and 36 months postbaseline visit. 16 In ADNI-2, new patients attended a screening visit, a baseline visit, and follow-up visits. For controls and patients with MCI, follow-up visits were conducted at 3 and 6 months postbaseline visit and every 6 months thereafter. For patients with AD, follow-up visits were conducted at 3, 6, 12, 18, and 24 months postbaseline visit and every 6 months thereafter. 17
Diagnostic data were collected through various cognitive tests, including memory tests, the Boston Naming Test, and others, and diagnostic summaries were created for patients throughout the study and categorized as being normal controls, having MCI, or having AD.16,17 In ADNI-2, MCI was subcategorized into early and late MCI. 17
Genetic data were collected for 1550 participants, 757 from ADNI-1 and 793 from ADNI-GO/2. Diagnostic data were collected from 2920 participants, including ADNI-3. Genetic data from ADNI-3 had not yet been released at the time this research was conducted.
Participant inclusion and exclusion criteria
Participants were required to be between the ages of 55 and 90 at baseline, have a Geriatric Depression Scale score of less than 6, have a study partner who accompanies them to visits, have proper visual and auditory acuity, have good general health, have completed at least 6 grades of education or a sufficient work history, and agree to collect blood and other samples for testing. Additional requirements can be found at https://adni.loni.usc.edu/wp-content/uploads/2010/09/ADNI_GeneralProceduresManual.pdf and adni2-procedures-manual.pdf. Further requirements were placed upon participants based on their categorization of diagnosis. For example, normal controls must have been free of memory complaints.16,17
Certain exclusion criteria were put in place throughout the study. In ADNI-1, the main criteria for exclusion centered around specific medications, including certain antidepressants and analgesics. 16 In ADNI-2, the exclusion criteria included diagnosis of certain conditions, including major depression, as well as a history of alcohol or substance abuse. 17 There were various other criteria for exclusion throughout the study.
Data collection and manipulation
Data used in the preparation of this article were obtained from the ADNI database (adni.loni.usc.edu). The ADNI was launched in 2003 as a public-private partnership, led by Principal Investigator Michael W. Weiner, MD. The original goal of ADNI was to test whether serial MRI, PET, other biological markers, and clinical and neuropsychological assessment can be combined to measure the progression of MCI and early AD. The current goals include validating biomarkers for clinical trials, improving the generalizability of ADNI data by increasing diversity in the participant cohort, and providing data concerning the diagnosis and progression of AD to the scientific community (for up-to-date information, see adni.loni.usc.edu).
All data collected by ADNI abides by all relevant ethical guidelines, and informed consent was obtained from all participants. 18
Permission to access and download ADNI study data was obtained through ADNI directly via an electronic application. Data containing SNP and CNV information were downloaded from the ADNI website, as well as data containing information regarding patient diagnostic and demographic data, including blood pressure, age at the baseline visit, gender, years of education, race, marital status, and handedness.19,20 Genetic data were separated by ADNI version, with 1 genome-wide association study (GWAS) being held for ADNI-1 and another being held for ADNI-GO/2. Genetic data were filtered to only include SNP data and were used in A/B notation, with the A allele being the reference allele. Data regarding the chromosome and position (location on the relevant chromosome) of each SNP were extracted from the data and kept separately for reference after analysis was completed in order to identify the genes nearest to the SNPs. The SNPs were initially transformed into a numerical representation depending on the number of B alleles (ie, “AA,” “AB,” and “BB” were transformed into 0, 1, and 2, respectively).
The genetic data were then combined with the other demographic and diagnostic data. The various data files used 1 of 2 (or, in some cases, both) versions of the patient ID number, which were matched. The most recent available diagnosis for each participant was used. The SNPs were transformed into a binary format, based on the presence or absence of at least 1 B allele. The SNPs with less than 5% variability (ie, greater than 95% of participants having the same version of the binary SNP) were removed from the data, and only complete cases were kept in the data set. Only SNPs that were present in all ADNI versions were kept in the data set.
Some demographic variables were transformed to a binary format due to a lack of variability of the data, with some factor levels having very few options. Specifically, race was made binary (white vs non-white), as was marital status (married vs unmarried). Diagnosis was transformed into a binary variable as well, with the presence of AD or MCI diagnosis being considered a “1” and the absence of either diagnosis being considered a “0” in order to simplify the interpretability of results and allow for binomial logistic regression to be performed.
After the genetic data were combined with the diagnostic and demographic data, only 1465 patients remained, as an inner join was used so as to have complete data for the demographic and diagnostic variables, representing about 95% of the full genetic data set patients. In total, 55 106 SNPs remained after the binary SNPs were filtered based on B allele frequency. After removing duplicate SNP entries, 55 040 SNPs remained for conditional selective inference analysis.
Data analysis
Elastic net cross-validation was conducted on the diagnostic and demographic data in order to choose the optimal α and λ values for elastic net regression and variable selection using the glmnetUtils package. 21 This method was used because it regularly outperforms the LASSO, and it encourages a grouping effect, which is useful in this case, as there are far more predictors than observations. 22 Based on the results of the cross-validation, LASSO regression was performed using the glmnet package, which selected a subset of the SNPs and other predictors, specifically 13 SNPs, years of education, and marital status. 23 Simple regression was then performed on that variable subset with diagnosis as the outcome variable. To calculate more accurate P-values for the predictors, a separate LASSO regression was conducted utilizing conditional selective inference. This method involved re-running the data through elastic net cross-validation with the 55 040 SNPs and utilizing those results to perform a separate LASSO regression that performed conditional selective inference using the selectiveInference package. 24 This approach increased accuracy and decreased bias during the P-value calculations. Then, we performed a test for multicollinearity on the model. Adjusted odds ratios and their corresponding 95% confidence intervals were calculated. Finally, the genes in or near which the SNPs were located were determined using the dbSNP database and the bedtools utility software.25,26
Aside from the data tidying using Bash scripts and the use of the bedtools software to determine some SNP gene locations, all data manipulation and analysis were performed using R version 4.2.0 with RStudio version 2022.07.2.
Results
Participant demographics
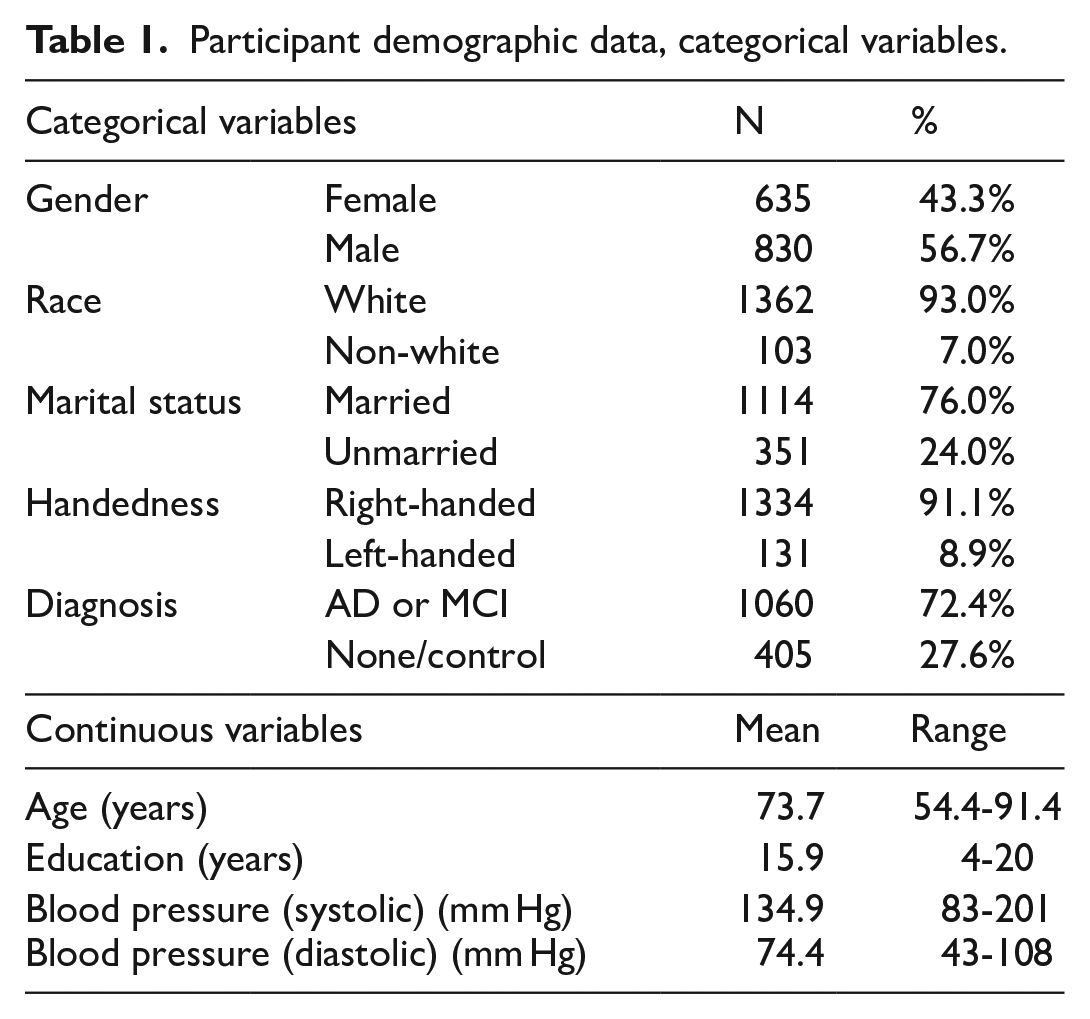
The participant demographic data are shown in Table 1. Of the 1465 participants included in the study, more were male than female, and the vast majority of participants were white. The majority of patients had a diagnosis of either AD or MCI, specifically 72.4%.
Participant demographic data, categorical variables.
Demographic data broken down by diagnosis are shown in Table 2. Diagnosis of AD or MCI was higher among males compared to females. Diagnosis was also higher among white participants compared to non-white participants. Married participants had a higher percentage who were diagnosed with AD or MCI compared to non-married participants. Diagnosis was more common among right-handed participants compared to left-handed participants.
Participant demographic data, by diagnosis, categorical variables.

Elastic net cross-validation and LASSO regression
Elastic net cross-validation was conducted, excluding participant ID as a variable. Multiple values of α were tested, as well as multiple values of λ, to minimize the cross-validation error of the data when performing elastic net regression for variable selection. The ideal value of α was 1, which pointed to performing LASSO regression on the data. The ideal value of λ was 0.0412638. Results of the elastic net cross-validation are illustrated in Figure 1.

Elastic net cross-validation selects optimal α.
Then, LASSO regression was run on the full data set, excluding participant ID as a variable. The ideal values of α and λ obtained from elastic net cross-validation were used. The LASSO regression left 13 SNPs and 2 other predictors and reduced the coefficients of all other predictors to 0. The 13 remaining SNPs were rs11086694, rs2075650, rs2094277, rs2261682, rs31887, rs4745514, rs4816158, rs4826619, rs6640551, rs6809370, rs7312407, rs919751, and rs9857853. The other remaining predictors were years of education and marital status.
Logistic regression and associations
Simple logistic regression was then performed on the 15 predictors remaining after LASSO regression with the diagnosis of AD or MCI as the outcome variable. The adjusted odds ratios and their corresponding 95% confidence intervals are shown in Table 3.
Adjusted odds ratios and corresponding 95% confidence intervals.

The reference level for marital status is “Married.” N/A: not applicable.
Using the predictors found after LASSO regression to inform simple logistic regression is a naïve approach that can lead to biased (artificially low) P-values regarding the observed associations. This is why a separate regression was performed to calculate more accurate P-values utilizing conditional selective inference, which conditions the inference on the LASSO variable selection, which allows for more robust P-values. 27 This method’s cross-validation led to the LASSO regression including 12 extra predictors (all SNPs), which may be due to the data set including 66 fewer SNPs initially, which could affect the results. This occurred due to a lack of variability among 67 SNPs, which the software could not handle. Even with this issue, the extra predictors included in the method with conditional selective inference were not significant. The P-values obtained through simple logistic regression and the P-values obtained through conditional selective inference can be found in Table 4.
P-values, before and after conditional selective inference.

The reference level for marital status is “Married.” N/A: not applicable.
A check for multicollinearity was performed on the simple logistic regression model, using the calculation of the variance inflation factor (VIF) of each model predictor, utilizing the car package. 28 After this test, the VIF of each model predictor was close to 1, indicating that there is no multicollinearity in the model. The results of the check for multicollinearity can be found in Table 5.
Variance inflation factors of model predictors.

The reference level for marital status is “Married.” N/A: not applicable.
Interpretation of genetic predictors
The model found significant associations between the 13 SNPs, years of education, and marital status. However, the presence of B allele in the SNPs rs11086694, rs2075650, rs2261682, rs4745514, rs6809370, rs7312407, and rs919751 was associated with an increased risk of AD or MCI, while the presence of the B allele in the SNPs rs2094277, rs31887, rs4816158, 4826619, rs6640551, and rs9857853 was associated with a decreased risk of AD or MCI. An increase in years of education was associated with a decreased risk of diagnosis, with a 1-year increase in education being associated with an odds ratio of 0.87 for diagnosis. Finally, being married was associated with an increased diagnosis risk, with an unmarried person (compared to a married person) being associated with an odds ratio of 0.67 for diagnosis.
In order to determine the genes in which the SNPs were located, dbSNP was used as a reference, except for rs11086694 and rs2094277, which required the use of the bedtools software. The nearest genes to these intergenic SNPs were identified using SNP coordinates and the GRCh37.75 ENSEMBL genome build using bedtools. Information regarding gene function, gene expression, and potential gene-disease associations was obtained through the National Center for Biotechnology Information’s Gene database. 29
The SNP rs2075650 is located in chromosome 19 in the TOMM40 gene. 30 The TOMM40 gene has the function of importing protein precursors into mitochondria. 31 With the relevance of APP in AD, this SNP may play a role in the disease. This is further exemplified by previous research finding an association between rs2075650 and AD. 32 This association was found to be significant with conditional selective inference, so its significance is more robust.
The SNP rs4816158 is located in chromosome 20 in the PAK5 gene. 33 This gene induces microtubule stabilization, promotes neurite growth, and regulates cytoskeleton dynamics. It is mostly expressed in the brain. 34 Considering the impact of the Tau protein and microtubule stabilization in AD development, this SNP and its gene are particularly in need of further study. Previous research has indicated the role PAK5 plays in microtubule stabilization and its potential impact on AD.35,36 Notably, this association was found to be significant by conditional selective inference.
The SNP rs6640551, located in the X chromosome, is in the gene known as SHROOM2. 37 This gene functions in the formation of new blood vessels and the formation of contractile networks in endothelial cells. It is associated with ocular albinism type 1 syndrome. 38 Given the association between AD and the loss of blood flow, a gene that controls the formation of new blood vessels is of interest.
The SNP rs6809370 is located on chromosome 3 and is in the PARL gene. 39 It is involved in mitochondrial remodeling and apoptosis, and it has a potential association with Parkinson disease. 40 This SNP was found to have a significant association under conditional selective inference.
The SNP rs31887 is in chromosome 5 in the CTNND2 gene, 41 which is involved in brain and eye development and is expressed mostly in the brain 42 . The CTNND2 gene is of interest due to its function in brain development.
The gene, PRKACG, is the location of the SNP rs4745514, which is located on chromosome 9. 43 This gene encodes the gamma form of one of the Protein Kinase A subunits, which recognizes and phosphorylates Tau.44,45
The SHROOM4 gene contains the SNP rs4826619 on the X chromosome 46 (the same chromosome as the SHROOM2 gene) and may be involved in cytoskeletal architecture, 47 similarly to the PAK5 gene. The rs4826619 was found to be significant through the conditional selective inference method used.
Similarly, rs919751, located in chromosome 5 and part of the PDGFRB gene, 48 is involved in actin cytoskeleton, and also involved in the development of the cardiovascular system. It is potentially associated with 5q-syndrome, 49 which is a condition that affects bone marrow cells and leads to a form of anemia. 50 The associations regarding the cardiovascular system this SNP may have made it of interest for further study.
The SNP rs2261682 is located in chromosome 2 in the AMMECR1L gene. 51 This gene is expressed fairly evenly throughout most human tissues, but its highest expression is in testis tissue. 52 This gene is similar to the AMMECR1 gene, which has an unknown function. However, the AMMECR1 gene is associated with AMME Complex,53,54 which is shorthand for a condition that includes Alport syndrome, intellectual disability (the second “M” in the abbreviation used to stand for “mental retardation,” although the abbreviation has not changed with the use of “intellectual disability”), midface hypoplasia, and elliptocytosis syndrome. 55 Elliptocytosis is categorized by red blood cells having an elliptical shape instead of having a round shape, which is mediated by cytoskeleton proteins. 56 The cardiovascular implications of this gene and the similarities among it and the PAK5 and SHROOM4 genes regarding cytoskeletal structure make it worthy of further investigation.
The aforementioned genes have all been protein-coding genes. However, the model included 4 non-coding RNA genes. The rs11086694 is located in chromosome 20 (the same as rs4816158) in or near the LINC02910 gene, and rs2094277 is in chromosome 13 in the LINC00347 gene. Although not much is known about these genes, LINC02910 is expressed mostly in bone marrow. 57 Notably, LINC00347 is expressed almost entirely in testis tissue. 58
The SNP rs7312407 is located in chromosome 12 in another non-coding RNA gene, LINC01479. 59 This gene is expressed mostly in the heart, 60 and, given the aforementioned impact the cardiovascular system plays on the development of AD, could make it a significant gene to further study. The rs9857853 is located in chromosome 3 (the same as rs6809370) and is located in the non-coding RNA gene LOC105374313, 61 which is expressed mostly in testis tissue. 62
Despite the unknown functions of non-coding RNA genes, they may play a role in gene expression regulation and have potential impacts on AD. 63 Thus, they should not be discounted in their relationships to AD due to the lack of knowledge regarding their functions.
Interpretation of non-genetic predictors
Years of education was significantly associated with a decreased risk on diagnosis of AD or MCI, based on the simple logistic regression model. While this aligns with current research, which states that higher levels of education are causally associated with reduced risk or delayed onset of AD, 64 although some research skeptically states that the relationship between education and AD may be affected by intelligence, 65 it is difficult to interpret the adjusted odds ratio of the variable, due to its continuous nature. However, since this association was found to be significant after performing conditional selective inference, this association should be further studied.
Marital status was associated with AD, with unmarried people being at a lower risk of diagnosis compared to married people. However, this is in contrast to existing literature. One study found that unmarried people were at a greater risk of developing dementia compared to married individuals. 66 The reason for the finding here is unknown. It is possible that marital status is a confounder for another variable not shown in the data. It also may have been due to the transformation of the variable into a binary format. Regardless, this association, having been found to not be significant using the conditional selective inference method, should be interpreted warily.
Discussion
While ADNI was a thoroughly conducted study, it and the research shown here have limitations. The ADNI may suffer from selection bias, due to the fact that some participants who otherwise would have developed AD or MCI could have died or left the study before being diagnosed or showing symptoms. Also, since late-onset AD is defined as having its onset at age 65 or older, 67 patients who entered ADNI at age 55 and only stayed in the study for under 10 years would not have even been old enough to develop late-onset AD, further adding to the selection bias for participants who may have developed AD later in life, even if they survived long enough to develop symptoms and be diagnosed, as they would have no longer been in the study. Another consideration is the possibility of issues arising from using different genotyping methods in the different ADNI versions.
The AD disproportionately affects minority groups compared to white individuals in terms of frequency. 7 Given this, the ADNI study having overwhelmingly white participants (the data here included 93% white participants) points to potential issues with generalizability.
One minor issue in the data is that some of the ages and years of education were slightly outside of the range specified in the inclusion criteria, although those values were not far from that range. The age range was not violated by more than 1.4 years in either direction, and the education range was only violated by 2 years on the lower end.
The education variable (measured in years) was a bit left-skewed, but due to its uneven nature (most people seemed to complete either 0, 2, 4, or 6, or 8+ years of higher education), most transformations of the data were not effective at reshaping it into a normal distribution. This posed a potential issue with the data, as, while logistic regression does not require normality of predictors, it does require continuous predictors to be linear in relation to their logits. 68 However, after performing a Box-Tidwell test, which is an appropriate method of checking that assumption, 69 on the education variable, the result showed that the education variable did not violate that assumption (P = .83, showing a small chance of violating the assumption).
The binary transformations involved throughout this process, while allowing for simpler interpretation, inherently also lead to some loss of information. For example, the distinction between AD and MCI is lost in this analysis, although it is important. Further research into this topic could include multinomial regression.
As mentioned previously, the conditional selective inference method led to 12 extra predictors being included after the comparative LASSO regression. While this is likely due to some of the SNPs being removed from the data to allow for the method to be conducted, this does have an impact on the resulting P-values for the SNPs included in the initial LASSO and simple logistic regressions. However, these P-values are still likely more valid in comparison to the P-values conducted directly through the logistic regression method (and any that were conducted through the initial LASSO regression, as those P-values would be inherently biased).
Another issue relates to the LASSO method used. Although the elastic net cross-validation method pointed to an α value of 1 being optimal, there are still inherent issues with the use of the LASSO when analyzing genetic data. Namely, this method may struggle with correlated predictors, meaning that it may have excluded important SNPs that are biologically relevant to the outcome measure or included predictors that are truly irrelevant to AD diagnosis. Further work is needed here to refine the methods used, especially in attempting to determine causal associations between genetic and other predictors and AD diagnosis.
This research points to potential new insight into the pathways of disease for AD. These pathways include the TOMM40, PAK5, SHROOM4, and PARL genes. The potential association of the PARL gene and another neurodegenerative disease (Parkinson disease) hints at a potential association with AD. There is potential that the TOMM40 gene, influenced by the B allele of the SNP rs2075650, leads to issues regarding amyloid precursor protein and, potentially, Aβ in the brain, leading to the formation of Aβ plaques and associated microglial-driven inflammation. However, this pathway is not clear from this research. What is clearer, however, is the potential PAK5-related pathway of disease. It is possible that an issue in the PAK5 gene due to the lack of the B allele in the SNP rs4816158 (as the B allele was shown to be protective in this research) leads to a higher likelihood of Tau proteins within neurons misfolding and leading to neuronal starvation. Previous research indicates that PAK5 plays a role in preventing the destabilization of microtubules. 36 Research has found that PAK5 inhibits the process by which Tau is phosphorylated and has linked it to AD. 35 The SHROOM4 gene has some similar function to the PAK5 gene, which, especially given its significance in this research, further emphasizes the potential of this disease pathway. While this research does not necessarily point to a causal relationship between these genes and AD, the potential of these pathways of disease, especially for the PAK5 pathway, should be further investigated.
Conclusion
Given the detrimental impact of AD on the physical, emotional, and financial aspects of the lives of sufferers and their caregivers, as well as the impact on the health care system in the United States and beyond, it should be further studied. In addition, the demand for early, accurate, and inexpensive testing and genetic associations of AD and MCI further motivates neurodegenerative research, especially considering the recent research determining APOE4 homozygotes to be a genetic form of AD. 9 The research presented here points mostly to a need for further research of the SNP rs2075650 with its associated TOMM40 gene and the SNP rs4816158 with its associated PAK5 gene, due to the functions of those genes that have the potential to significantly impact AD risk. Further study of these and other potential associations could lead to improved early detection and, thus, early treatment of AD, and could reduce the burden of the disease.
Footnotes
Acknowledgements
We would like to acknowledge the members of the thesis committee for which this work was initially conceptualized who are not also authors of this work: Chi Hyun Lee and Jing Qian. Their assistance in this work greatly improved its quality. Data collection and sharing for the Alzheimer’s Disease Neuroimaging Initiative (ADNI) is funded by the National Institute on Aging (National Institutes of Health Grant U19AG024904). The grantee organization is the Northern California Institute for Research and Education. In the past, ADNI has also received funding from the National Institute of Biomedical Imaging and Bioengineering, the Canadian Institutes of Health Research, and private sector contributions through the Foundation for the National Institutes of Health (FNIH) including generous contributions from the following: AbbVie, Alzheimer’s Association; Alzheimer’s Drug Discovery Foundation; Araclon Biotech; BioClinica, Inc; Biogen; BristolMyers Squibb Company; CereSpir, Inc; Cogstate; Eisai Inc; Elan Pharmaceuticals, Inc; Eli Lilly and Company; EuroImmun; F. Hoffmann-La Roche Ltd and its affiliated company Genentech, Inc; Fujirebio; GE Healthcare; IXICO Ltd; Janssen Alzheimer Immunotherapy Research & Development, LLC; Johnson & Johnson Pharmaceutical Research & Development LLC.; Lumosity; Lundbeck; Merck & Co, Inc; Meso Scale Diagnostics, LLC; NeuroRx Research; Neurotrack Technologies; Novartis Pharmaceuticals Corporation; Pfizer Inc; Piramal Imaging; Servier; Takeda Pharmaceutical Company; and Transition Therapeutics.
Ethical considerations
Ethical approval was not required for this work.
Ethics
No artificial intelligence tools were used to write any portion of this work or in any other way throughout the process of conducting this research. In addition, no artificial intelligence tools were used to generate or modify any data in this work.
Consent to participate
Participant consent was not required for this work, as no participants were recruited specifically for this work.
Consent for publication
Not applicable.
Author contributions
SH and ZO conceptualized the work. SH contributed to the writing, data collection, and data analysis. ENP supplied the work of data pre-processing in the early stages of analysis. ENP and ZO were the main contributors to the editing of the work. SH and ZO developed the methodology of the analysis.
Funding
The author(s) received no financial support for the research, authorship, and/or publication of this article.
Declaration of conflicting interests
The author(s) declared no potential conflicts of interest with respect to the research, authorship, and/or publication of this article.
Data availability
Data used in this work contain data used by ADNI, which prohibits the redistribution of individual-level data in any manner.