
Abstract
Coronary artery disease (CAD) and peripheral artery disease have serious effects on quality of life. Recent studies have shown that peripheral arterial disorders increase a person’s risk of developing CAD. The clinical symptoms of these conditions include palpitations, fatigue, confusion, shortness of breath, and, in severe cases, heart failure or stroke. Despite these similarities, many diseases have no known treatments, which raises grave concerns for world health. The study aims to identify common differentially expressed genes (DEGs) between CAD and peripheral arterial disease (PAD) patients and investigate biological pathways, network-based analysis, immune and inflammatory profiling, biomarker identification, and multi-omics integration. This helps in early detection and targeted treatment strategies. The results revealed 48 upregulated DEGs that were shared among CAD and peripheral arterial disorders. Functional enrichment analysis revealed mainly myofibril assembly and actomyosin organization, highlighting muscle development and cellular structure, and KEGG pathway analysis revealed amino acid metabolism pathways. A network of protein-protein interactions (PPIs) was built via the STRING and visualized by Cytoscape plugin, CytoHubba, and MCODE, which led to the identification of 10 hub genes, ie, GLS, CCND2, RBL2, ITGB1, IL6ST, THRB, MBNL1, PDE5A, PROS1, and CACNA2D3. Most of these genes involved in key functions, such as voltage-gated calcium channel trafficking, cGMP degradation, RNA splicing, thyroid hormone receptor beta, IL6ST, and cytokine signaling, play crucial roles. Within this subnetwork, we identified 10 crucial seed nodes that are integral to the network’s structure and function. The seed nodes highlight significant regulatory connections, providing insights into the underlying biological mechanisms involved. The transcription factor regulatory network of the hub genes revealed this phenomenon. Finding the important seed nodes in this regulatory network makes their role in maintaining the network’s integrity and functionality even more clear. This could lead to new targeted therapies and better ways of managing CAD and peripheral blood disorders.
Keywords
Introduction
Coronary artery disease (CAD) is a complicated disease caused by a combination of genetic and environmental factors, as well as their interactions and is a multifactorial chronic condition.1,2 Plaques developing in the coronary arteries and subsequent atherosclerosis are the hallmarks of CAD. Numerous factors, such as dyslipidemia, hypercoagulability, endothelial dysfunction, inflammation, and oxidative stress are known to contribute to atherosclerosis.1,3 Age, sex, smoking, dyslipidemia, hypertension, obesity, diabetes mellitus, and family history are among the many variables linked to CAD. 4 Researchers have discovered a few biomarkers associated with CAD in prior studies, including cardiac troponin T, lipoprotein(a) [Lp(a)], C-reactive protein (CRP), and high-sensitivity C-reactive protein (hs-CRP).5,6 The CAD is the most prevalent cardiovascular disease (CVD) and has a significant negative impact on human health worldwide. The mortality and morbidity of CAD have been constantly increasing in low- and middle-income countries and are now also being reported in developed countries, making it a global issue. The 2018 China CVD report indicated that 290 million people have CVD, 3.79% of whom are CAD patients.7,8
Diseases that affect the blood arteries outside of the brain and heart are referred to as peripheral blood disorders. These ailments mainly affect limb circulation. The PAD is a blockage or narrowing of the arteries triggered by the accumulation of fatty plaques. It is one of the leading causes of CVD worldwide, resulting in significant morbidity and mortality. It is a high predictor of all-cause and cardiovascular mortality. Symptoms include cramps, muscle tiredness, and heaviness and can lead to acute or critical limb ischemia, which requires immediate medical attention.9,10 Essential elements include ensuring that patients follow prescription drug and exercise regimens, quitting smoking, and maintaining stringent blood pressure control with ambulatory monitoring. A healthy diet and statin therapy are essential for controlling cholesterol levels. Patients with diabetes also need to lose weight and maintain their HbA1c levels below 7%; however, this goal may change depending on co-occurring illnesses or the risk of hypoglycemia.11,12 Obesity, diabetes, and older age are contributing factors to the increasing incidence of peripheral vascular disease (PVD), a major health concern. Approximately 8.5 million Americans and more than 200 million people are impacted by it worldwide.13,14 Although PVD is rare in patients under 50 years of age, it is more common as people age and affects a significant portion of the elderly population.15,16
Several shared genetic and molecular characteristics link CAD and PAD, such as atherosclerotic vascular diseases, susceptibility genes, inflammatory and immune pathways, common metabolic and lipid dysregulation pathways, and oxidative stress.17,18 Accurate diagnosis is crucial for the effective management of CAD and PAD. Various methods are commonly employed such as physical examination and medical history, electrocardiogram (ECG), stress testing, echocardiography, coronary angiography, computed tomography (CT) coronary angiography, and blood tests to identify biomarkers such as hs-CRP, cholesterol levels, and other lipid profiles, which are often used to evaluate overall cardiovascular risk and inflammation.19,20 Similarly, the management of CAD and PAD typically involves a combination of lifestyle changes, medications, and potentially surgical interventions. The diagnosis of blood vessel disorders often involves a combination of clinical assessment and laboratory tests such as complete blood count, blood smear, bone marrow aspiration and biopsy, flow cytometry and immunophenotyping, and genetic testing such as the use of various kinds of biomarkers.15,21 In the study, we have identified and analyzed the shared genetic characteristics of CAD and PAD via an integrated bioinformatics approach based on RNA-sequencing data and identified common molecular pathways, biomarkers, and potential therapeutic targets.
Materials and Methods
Acquisition of transcriptomic data sets
The Gene Expression Omnibus (GEO) database (https://www.ncbi.nlm.nih.gov/gds) provides the gene expression profiles of microarray data for the following circumstances: CAD (GSE12288), peripheral blood monocytes (GSE165543), carotid artery stenosis (GSE43292), and thrombocytopenia (GSE103176). The GSE12288 data set was produced via the [HG-U133A] Affymetrix Human Genome U133A Array platform (GPL96), and the GSE12288 data set was produced. Samples were taken from 110 control samples and 112 samples from patients with CAD. On the contrary, samples from 110 control and 130 CAD-infected samples were collected for the GSE165543 data set, which was obtained via the GPL16686 platform. Samples from 32 samples with carotid artery stenosis and 32 control samples were acquired via platform GPL6244 and data set GSE43292. As indicated by the flowchart in Figure 1, samples were taken from 50 patients infected with thrombocytopenia and 15 control samples via the GSE103176 data set and the GPL13667 platform. Moreover, state-of-the-art computational biology tools were utilized, as outlined by Hephzibah Cathryn et al 22 to increase the accuracy and reliability of the analysis. The overall details of the samples and series are given in Table 1.

Graphical representation of the work done in this study.
The GSE series and experimental element included in this study.

Identification of common upregulated genes
Multiarray technology was used to correct background, normalize data, and log transition in preliminary data as described by Udhaya Kumar et al. 23 GEO2R was used to identify differentially expressed genes (DEGs) between the selected data sets, and the GEO query and limma R tools from the Bioconductor project groups of samples were compared.24,25 The false discovery rate was controlled via the Benjamini-Hochberg method. 26 After being downloaded in table format via GEO2R, the shared DEGs from both data sets were imported into R-Studio for further analysis. Data sets were chosen using sets with adjusted P-values < 0.01 and log2-fold changes < −1. For the genes whose expression was upregulated, a Venn diagram was generated via the bioinformatics and evolutionary genomics Venny web tools.
Enrichment analysis of common upregulated genes
Gene set enrichment analysis is a process used to evaluate the collective behavior of genes with respect to health and disease. 27 Gene ontologies (GOs) and associated pathways were obtained via SRplot (https://www.bioinformatics.com.cn/en) and Enrichr (https://maayanlab.cloud/Enrichr/). These are user-friendly, web-based enrichment analysis programs that provide several aggregation functions of gene lists.28,29 For the pathway investigations, the KEGG, BioPlanet, Reactome, and MSigDB databases were selected. BioPlanet is a pathway database that integrates information from various sources, including KEGG, Reactome, and WikiPathways.
Protein-protein interaction and network analysis
The field of systems biology relies significantly on network analysis to understand the interactions between proteins at the molecular and cellular levels. 30 Moreover, studying individual genes is not necessary when performing network-based research, as it might yield useful knowledge about gene sets. 31 To construct the network, the search tool for the retrieval of interacting genes (STRING) protein quarry Cytoscape plugin tool was utilized. The STRING is particularly valuable for systems biology research, as it helps researchers visualize and interpret complex biological networks and identify key players in cellular functions and disease pathways. 32 To eliminate the inconsistency in protein-protein interaction (PPI) from the data set, we established a cutoff criterion of a confidence interaction score ⩾0.4. Consequently, we established a robust PPI network. 33 After the relevant network was retrieved, it was visualized and modified via Cytoscape 34 and other relevant plugin tools.
Hub gene identification and module analysis
The nodes with the highest degree of connectivity are known as hub genes. A network is composed of multiple nodes and edges. Hub genes are required for the maintenance of biological processes (BPs) since they usually have a relatively high degree of connectivity. Our PPI network of hub genes was constructed via the Cytoscape plugin software CytoHubba. CytoHubba is an intuitive tool for analyzing the key nodes in biological networks, offering 11 topological analysis methodologies. 35 The degree topological method, which is based on the total number of contacts related to each gene in the PPI network, was utilized in the current investigation. The PPI network’s highly linked regions of the PPI network were located via Molecular Complex Detection (MCODE), another Cytoscape plugin technique. 36 To help with handling visualization, MCODE extracts the dense zones surrounding the data.
Gene-drug interaction network
Recently, the identification of pharmacogenomic gene-drug associations has made significant strides. However, a large portion of the heritable interindividual variability remains unexplained. It has been proposed that higher-dimensional phenomena, such as gene-gene-drug interactions, where variations in multiple genes work together to produce an observable phenotype may account for some of this missing heritability. 37 To identify potential drugs for the treatment of peripheral blood disorders and CAD, a drug interaction network for our hub genes was constructed. The DrugBank database served as a base for the network creation, which was performed via NetworkAnalyst web platform. 38 The network file was retrieved from NetworkAnalyst and opened in Cytoscape. The popular medications linked to DEGs were also screened via the DGIdb network platform.
Transcription factor and transcription factor-micro-RNA regulatory network of the hub genes
Transcription factor (TF) networks are vital for selecting cell fates in mature tissue homeostasis and mammalian development, and they are frequently impacted by disease. 39 Using NetworkAnalyst and the RegNetwork tools, the TF gene interaction network of the hub genes was built; the tool offers a visual network for gene expression analysis.40,41 MicroRNAs regulate gene expression at the post-transcriptional level, whereas TFs can activate or repress transcription at the pre-transcriptional level. 42 The RegNetwork 43 library and the NetworkAnalyst program were used to construct the TF-miRNA regulatory network for the hub genes. The 1° cutoff value was used to filter the network. After the network was removed from NetworkAnalyst, it was finally visualized using Cytoscape.
In vitro validation of the hub gene expression by qualitative real-time polymerase chain reaction analysis
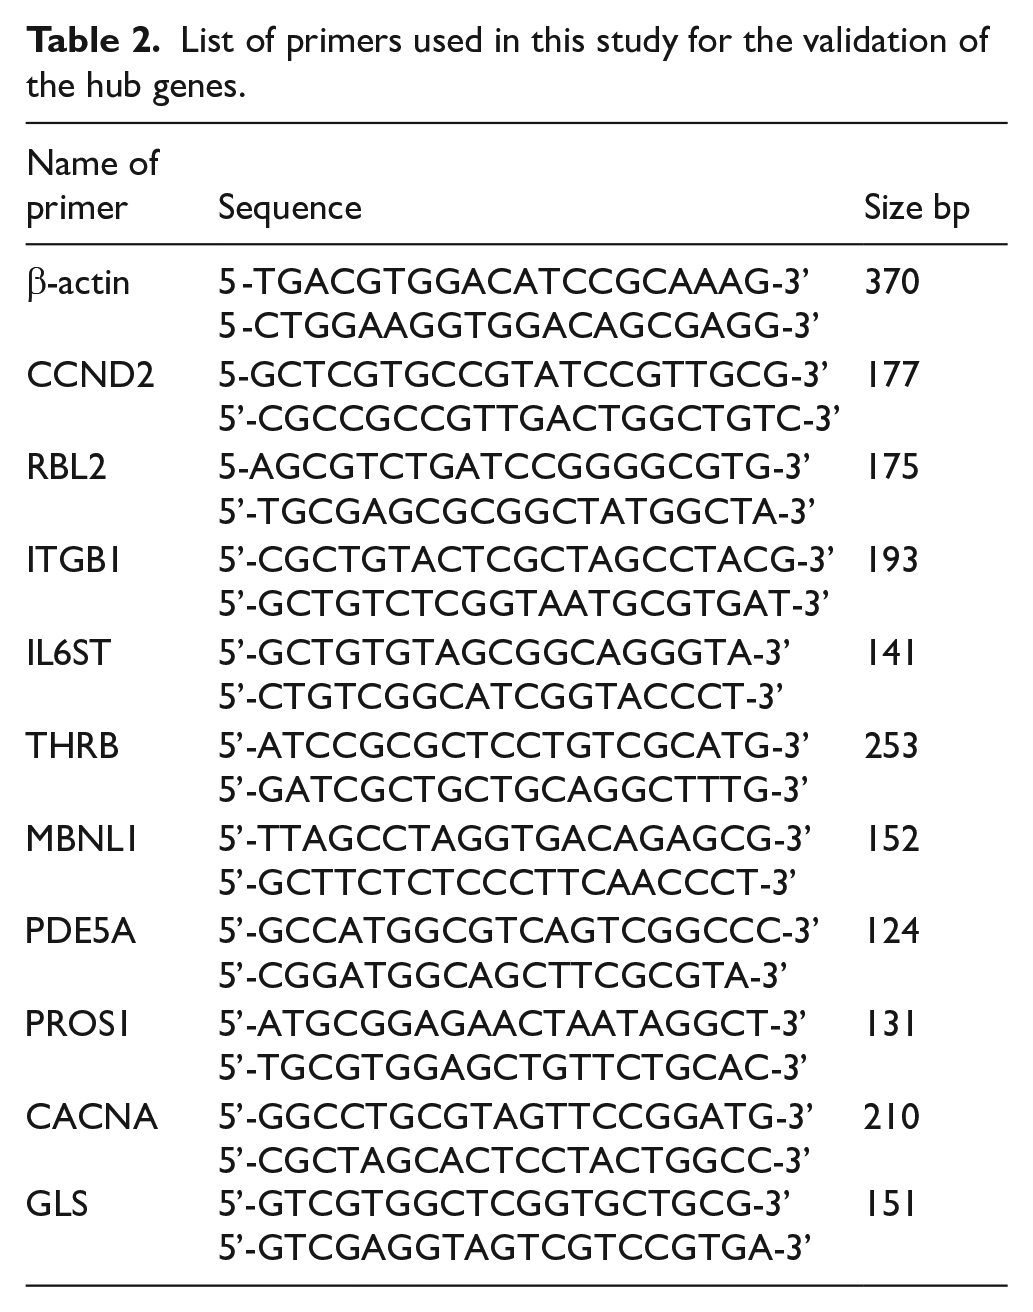
The Shanghai Institute of Biochemistry and Cell Biology (SIBCB)’s Cell Bank/Stem Cell Bank kindly provided 2 cell lines named hPAEC and control-PAEC (Human pulmonary artery endothelial cells). These cell lines serve as an exemplary model for investigating several facets of cardiovascular function and pathology. Every cell line was cultured and treated as described by Bernardi et al. 44 Following the manufacturer’s instructions, total RNA was extracted from cells via the TRIzol reagent (Life Technologies [Thermo Fisher Scientific], Carlsbad, California). SYBR Premix Ex-Taq (TaKaRa) was then utilized in a real-time polymerase chain reaction (PCR) system (ABI 7500, CA 94404, USA) for quantitative reverse transcription polymerase chain reaction (RT-PCR) analysis. In addition, the 2−ΔΔCt technique was employed to normalize the relative expression levels via β-actin. Table 2 lists the primers used to detect the selected samples. CCND2, RBL2, ITGB1, IL6ST, THRB, MBNL1, PDE5A, PROS1, CACNA2D3, and GLS.
List of primers used in this study for the validation of the hub genes.
Results and Discussion
Shared genes between CAD and peripheral artery diseases
The CAD and various peripheral artery diseases share several genetic factors that may contribute to their overlapping pathophysiology and comorbidity comorbidities. Research has identified specific genetic variations and pathways involved in both CAD and PAD diseases.45,46 Understanding these shared genetic pathways can facilitate personalized medicine approaches for patients with comorbid cardiovascular and blood disorders, potentially leading to improved therapeutic strategies and risk assessment. Therefore, identifying common molecular signatures between CAD and peripheral artery diseases is essential for the development of more effective treatment strategies. To determine whether patients with CAD and peripheral artery disease share specific increased genes, a number of data sets (GSE12288, GSE165543, GSE43292, and GSE103176) were analyzed. Forty-eight genes that were differentially expressed and commonly upregulated were identified from the GSE12288, GSE165543, GSE43292, and GSE103176 data sets (Figure 2). These commonly upregulated genes are listed in a TIA1, PDLIM5, TMEM135, MBNL1, BCLAF1, MBNL2, PROS1, SPTB, RBL2, RNF19A, IL6ST, CCND2, BAG4, GOLIM4, USP33, ANKRD12, LRPPRC, KIFAP3, ZBTB11, CDC73, THUMPD1, TMEM30A, TOR1AIP1, GLS, GAD1, SACM1L, MYH10, RECQL, NR1D2, HSDL2, THRB, SUCLG2, ZNF451, APPBP2, DLC1, PDE5A, LANCL1, LUC7L3, AASDHPPT, PJA2, FAM8A1, PRKAR1A, CCNG1, CACNA2D3, SHOC2, SSX2IP, ITGB1, and ZBTB3 8. A Venn diagram represents the comparison of commonly upregulated genes. These DEGs are associated primarily with immunological pathways and viral genome replication.

A Venn diagram showing frequently elevated genes with varying expression levels. Among the 1433 upregulated genes associated with coronary artery disease and 9677 upregulated genes associated with peripheral blood diseases, 48 common upregulated genes were found.
Enrichment analysis of common upregulated genes
Significant additional knowledge about the BPs, cellular components, and molecular functions enriched in the data set was revealed by the GO study results. The terms regulation of mRNA processing, myofibril assembly, and actomyosin structure organization were among the most enriched terms among the BP terms, indicating a high emphasis on muscle development and cellular structure organization. These findings seem to be essential for preserving the integrity and functionality of cells, particularly those found in muscles and other tissues. Significant additional knowledge about the BPs, cellular components, and molecular functions enriched in the data set was revealed by the GO study results. The terms regulation of mRNA processing, myofibril assembly, and actomyosin structure organization were among the most enriched terms among the BP terms, indicating a high emphasis on muscle development and cellular structure organization. 47 The results revealed (Figure 3A) a significant representation of genes associated with signal transduction, protein regulation, and muscle function in this data set, which may be important for understanding the biological mechanisms involved.

GO and KEGG enrichment analysis (A) GO enrichment of biological process of the DEGs. (B) GO enrichment of cellular components of the DEGs. (C) GO enrichment of molecular function of the DEGs. (D) GO results of 3 ontologies.
The alanine, aspartate, and glutamate metabolism pathways were the most enriched pathways according to the KEGG pathway enrichment analysis, with a P-value of < .05 (Table 3), suggesting that genes involved in amino acid metabolism play a significant role in the data set. This pathway plays crucial roles in the generation of energy and the control of neurotransmitters, indicating its importance in the BPs under investigation. 48
The most significant pathways analysis based on P-value as well as count.

Viral carcinogenesis, the second most enriched pathway, suggests that some genes are involved in the formation of cancer through viral mechanisms. 49 This raises the possibility of a connection between viral infections and cancer-causing agents. Furthermore, there was significant enrichment of the p53 signaling pathway, highlighting the importance of genes related to tumor suppression and cell cycle regulation (Figure 3B). Preventing unchecked cell proliferation and preserving cellular homeostasis depend heavily on the p53 pathway. Overall, these enriched pathways highlight the functions of metabolism, viral components, and essential signaling systems in the biological environment under study.
Protein-protein interaction network construction and module analysis
The PPI network (Figure 4A) was constructed via the STRING online database. Overall, 52 nodes and 32 edges were found in the network analysis via the STRING database, yielding an average node degree of 1.23. There is a moderate amount of clustering inside the network, as indicated by the average local clustering coefficient of 0.428. The observed number of edges quadrupled the estimated number of edges, which is interesting because it suggests a richer interaction network than expected. The estimated number of edges was 16. In addition, the STRING-performed PPI enrichment analysis revealed a statistically significant P-value of .00037. Proteins with multiple connections, such as ELAVL1 and CCND2, likely play a central role in CAD and peripheral arterial disorders. CCND2 regulates the G1-to-S phase transition in the cell cycle, forming a complex with CDK4/CDK6. The overexpression of CCND2 can reinitiate cell cycle activity, promote cardiomyocyte proliferation, and potentially enhance cardiac regeneration after myocardial infarction (MI). 50 The ability of RNA-binding proteins, including ELAV-like RNA-binding protein 1 (ELAVL1) and serine/arginine-rich splicing factor 10 to promote cardiac damage has gained increasing interest. ELAVL1 facilitates ferroptosis in MI by regulating autophagy, resulting in heart muscle injury. Conversely, compromised SRSF10 functionality has been linked to cardiac rupture. 51
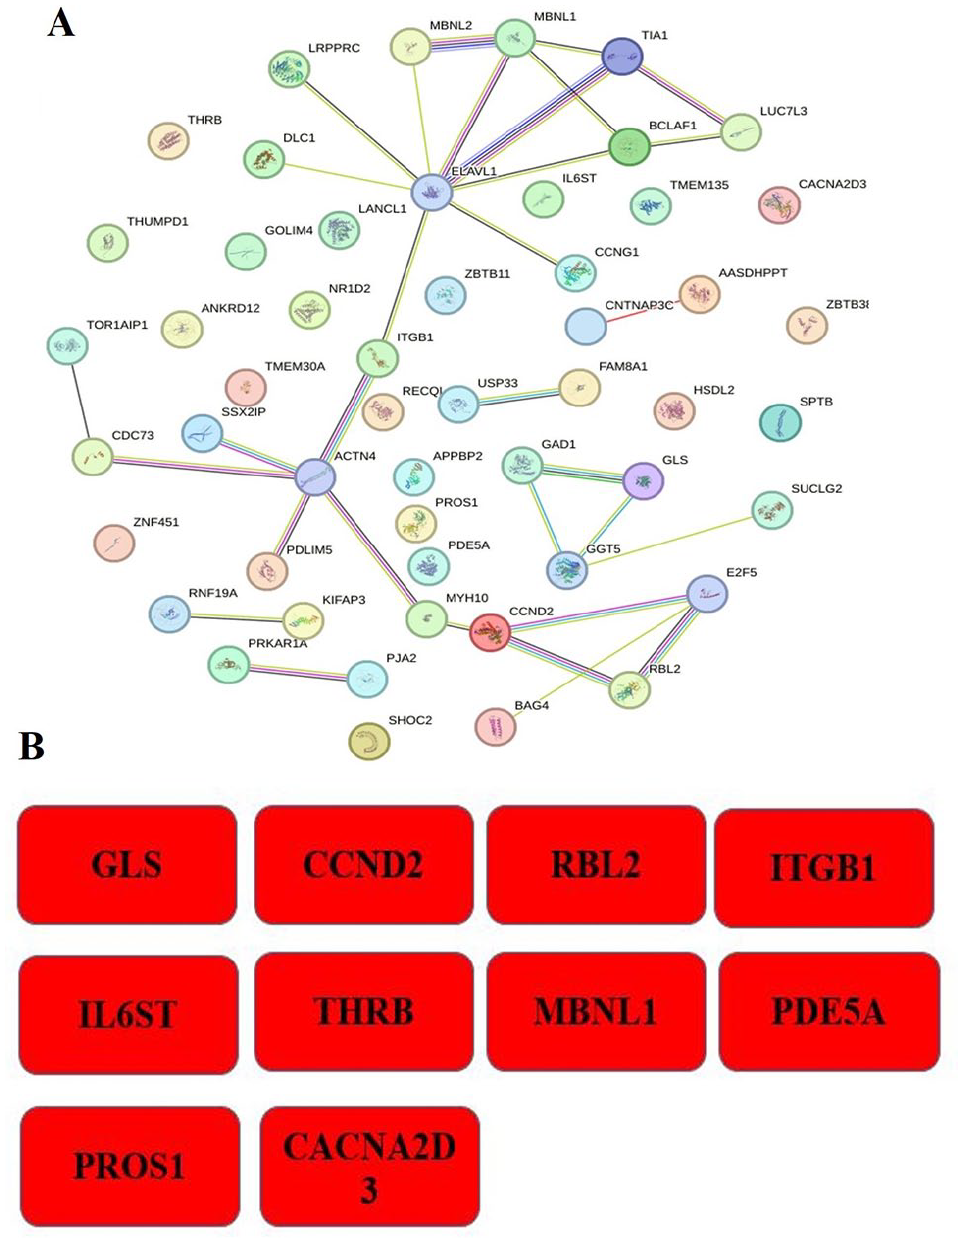
(A) Proteins are represented as nodes in the PPI network analysis graph; thicker connections indicate the higher scores and thicker lines indicate the greater protein interactions. (B) The hub genes in the PPI network were identified on the basis of their degree values.
This implies that the detected nodes are more interconnected than one would anticipate from pure chance, suggesting the existence of an interaction network with biological significance. The enrichment and clustering patterns highlight the functional interconnectivity within the network and suggest potential areas for further investigation, such as identifying key hub genes that could play central roles in the associated pathways.
Identification of hub genes via Cytoscape
Key nodes in the PPI networks were further analyzed and explored via a range of topological analysis tools such as MCC, DMNC, MNC, degree, EPC, bottleneck, ecCentricity, closeness, radiality, betweenness, and stress, which are accessible in the Cytoscape plugin CytoHubba. Every node in the PPI network is given a score via the topology method. On the basis of the gene score, the top genes were recognized as hub genes, and the top 48 genes in the network resulted in the identification of 10 hub genes: GLS, CCND2, RBL2, ITGB1, IL6ST, THRB, MBNL1, PDE5A, PROS1, and CACNA2D3 (Figure 4B). Further data mining was carried out for insights into the potentials of hub genes as described below.
The glutaminase enzyme, produced by the GLS gene, is crucial for cardiovascular health and disease. Research suggests that GLS is involved in the development and progression of both PAD and CAD. In CAD, elevated GLS expression is observed in atherosclerotic plaques, and GLS plays a role in regulating the migration and proliferation of vascular smooth muscle cells, which are key processes in atherosclerosis. Genome-wide association studies also link the GLS gene to an increased risk of CAD. 52 The CCND2 gene encodes the cyclin D2 protein, crucial for cardiovascular health and disease progression. It is associated with PAD and CAD, with atherosclerotic plaques and artery lesions.53,54 The RBL2 gene is crucial for CVD and good health, affecting PAD and CAD. Reduced RBL2 expression in atherosclerotic plaques and angiogenesis contribute to PAD development. 55 The integrin beta-1 protein, produced by the ITGB1 and IL6ST genes, is crucial for cardiovascular health and disease progression. It may contribute to the onset and progression of PAD and CAD.56,57
Overall, studies have revealed that all the genes except for the gene known as THRB (thyroid hormone receptor beta) are associated with or linked with both the disease PVD and CAD.58,59 This understanding highlights the interconnected roles of these genes in cardiovascular conditions, suggesting potential targets for therapeutic intervention. The associations between these genes and both PAD and CAD emphasize their relevance in atherosclerotic disease pathways and point to their involvement in disease progression and pathology. Further investigation of these shared genetic factors may provide insights into novel biomarkers and therapeutic strategies for managing atherosclerosis-related disorders.
Gene-drug interaction analysis
Gene-drug interaction networks have numerous applications in biomedical research and healthcare, particularly in personalized medicine, drug discovery, and understanding complex diseases. By integrating genetic data with pharmacological information, gene-drug interaction networks offer valuable insights that can enhance treatment efficacy, support drug development, and reduce risks associated with adverse drug reactions. 60 A network of gene-drug interactions compiled from DrugBank illustrates the relationships between different medication classes and GLS, CCND2, RBL2, ITGB1, IL6ST, THRB, MBNL1, PDE5A, PROS1, and CACNA2D3 (Figure 5). Recently, drugs such as cilostazol have been used to treat peripheral artery disease and increase blood flow.61,62 In CAD, aspirin, an antiplatelet agent, lowers blood clot risk, whereas atorvastatin stabilizes arterial plaques and lowers cholesterol. 63 An anticoagulant called warfarin aids in the prevention of clot formation in peripheral blood disorders such as deep vein thrombosis. 64 These findings suggest that certain similar substances may be important in regulating the circumstances associated with both CAD and peripheral blood diseases.

Drug-gene interaction and analysis: The network highlights potential therapeutic targets and drug repurposing opportunities by mapping gene-drug relationships.
Transcription factor and transcription factor-micro-RNA regulatory networks of the hub genes
The results from our NetworkAnalyst analysis revealed a detailed regulatory network for the hub genes, particularly focusing on subnetwork 1, which comprises 55 nodes and 105 edges. Within this subnetwork, we identified 10 crucial seed nodes that are integral to the network’s structure and function. These seed nodes highlight significant regulatory connections, providing insights into the underlying biological mechanisms involved. As depicted in Figure 6, each seed node is regulated by a distinct set of TFs, underscoring their regulatory complexity and importance within the network. Specifically, GLS is influenced by 5 TFs, whereas CCND2 is regulated by 10 TFs. RBL2 and PDE5A each have 14 TFs governing their expression, and ITGB1 is regulated by 15 TFs, suggesting their strong regulatory involvement. IL6ST and CACNA2D3 each have 6 TFs, whereas THRB is regulated by 8 TFs. In addition, MBNL1 is regulated by 15 TFs, and PROS1 is regulated by 12 TFs, as depicted in Figure 7. These relationships underscore the regulatory diversity and potential roles these seed nodes play in the subnetwork’s overall function and stability.

A network of TF interactions for shared hub genes. Nodes in red indicate the hub genes, whereas other nodes represent the TF genes.

The TF-miRNA coregulatory network for common hub genes is represented by 360 nodes and 506 edges. This subnetwork also includes 8 seed nodes.
The literature reveals that various TFs play crucial roles in gene regulation, with several being reported as vital in heart-related diseases. These factors are emerging as potential biomarkers and drug targets. For example, the Myocyte Enhancer Factor 2 (MEF2) and GATA factors are essential for modulating hematopoiesis, a finely tuned process controlled by numerous transcriptional and signaling factors. 65 Nkx2.5 is critical for cardiac looping and the expression of other TFs essential for heart development. 66 The TFs YY1 and FOXC1 regulate genes involved in cardiac development, including those linked to cardiac hypertrophy and fibrosis. 67 NFIC and NFYA are integral to regulating cardiomyocyte metabolism and proliferation during fetal heart development, and the literature that reveals STAT3, a signaling molecule and TF, protects the heart by maintaining physiological homeostasis, assisting in stress-induced remodeling, and supporting cardioprotection. It regulates genes associated with cell survival, proliferation, and differentiation.68,69 Myocardial ischemia and hypoxia are the primary causes of heart failure, with cardiomyocyte apoptosis due to mitochondrial injury underlying poor cardiac remodeling and heart failure. The Upstream Stimulatory Factor 2 (USF2), which is involved in multiple cellular processes, has recently been recognized for its role in mitochondrial function and energy homeostasis, although its specific impact on CVD remains unexplored. 70 TFAP2C promotes psoriasis-like inflammation by activating Th17 and Th1 cells through TEAD4 transcription regulation. It also inhibits cell autophagy, thereby reducing myocardial ischemia/reperfusion injury by modulating the miR-23a-5p/SFRP5/Wnt5a axis. 71 Interferon regulatory factor (IRF) 2, a member of the IRF family, is essential for gasdermin D (GSDMD)-induced pyroptosis, which, when reduced, protects against heart damage and cardiac dysfunction following MI.
The discovery of the diverse roles played by various TFs in heart-related diseases opens promising avenues for future research and therapeutic development. Given their significant involvement in gene regulation, these TFs represent potential biomarkers and drug targets for CVDs. Future research could focus on further elucidating the specific molecular pathways through which these TFs influence heart development and disease progression. For example, in-depth studies on MEF2 and GATA factors may provide insights into their regulatory roles in hematopoiesis and potential applications in heart disease treatment.
Validation of hub genes via quantitative polymerase chain reaction analysis
In the validation study, 2 cell lines, hPAEC and control-PAEC, were used to determine the relative expression levels of 9 (GLS, CCND2, RBL2, ITGB1, IL6ST, THRB, MBNL1, PDE5A, and PROS1) identified hub genes with respect to the normal cell line and the in silico identification was validated via 2−ΔΔCt value. As shown in Figure 8, the GLS, CCND2, RBL2, ITGB1, IL6ST, THRB, MBNL1, PDE5A, PROS1, and CACNA2D3 hub genes had higher expressions in hPAEC cell lines compared to normal cell lines and the 2−ΔΔCt values, and the results were in line with those of the in silico analysis (Figure 8).
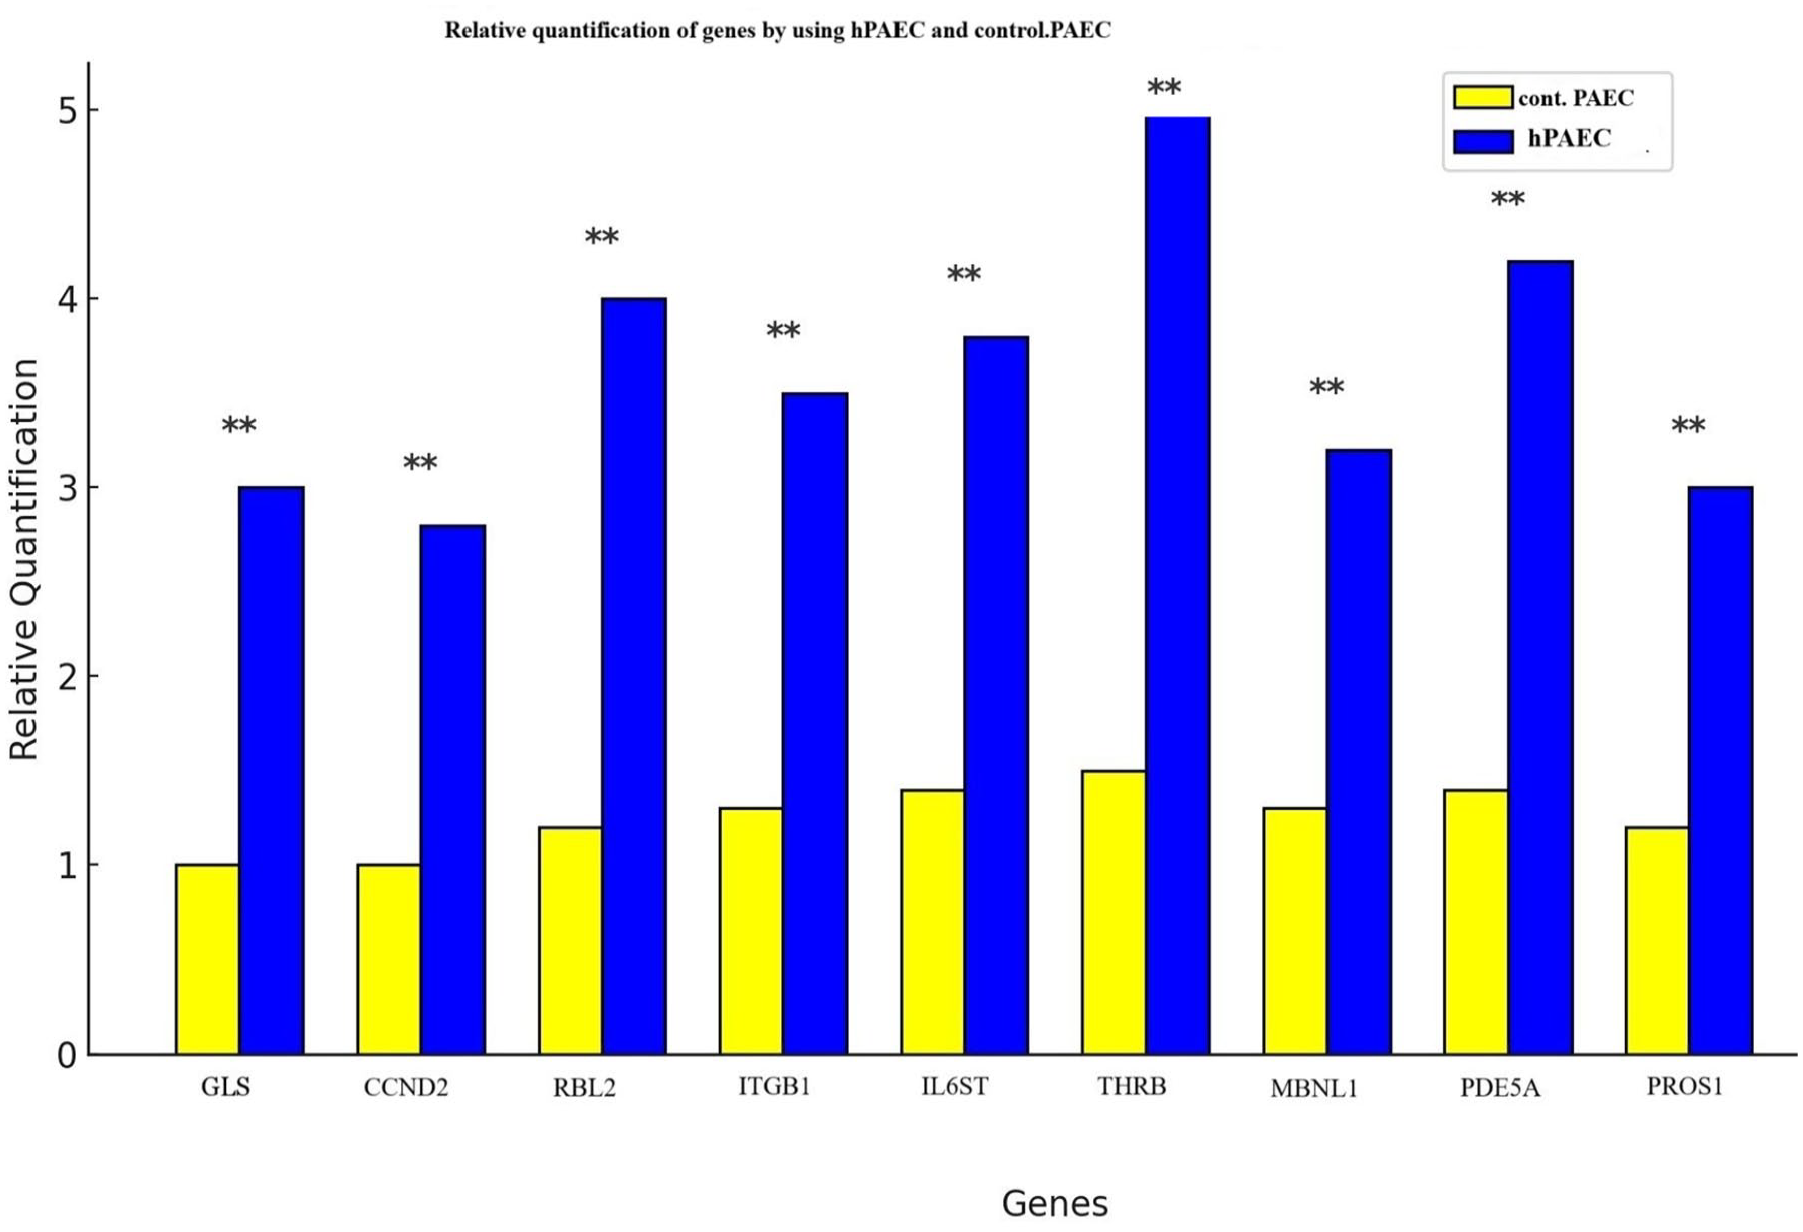
The validation of hub genes by RT-qPCR on 10 co-expressed hub genes.
Conclusions
There is evidence of increased CAD severity in peripheral artery disease patients. The present study subsequently sought to determine shared gene expression patterns and molecular pathways associated with CAD. GLS, CCND2, RBL2, ITGB1, IL6ST, THRB, MBNL1, PDE5A, PROS1, and CACNA2D3 were identified as hub genes that are regulated by various key TFs such as MEF2 and GATA. Moreover, the results were validated via quantitative analysis. Identifying shared genetic markers between CAD and PAD can help clinicians recognize patients at risk of developing both conditions, enabling the incorporation of genetic profiling into routine screening for early detection and intervention. In addition, understanding common molecular pathways can guide targeted therapeutic approaches and optimize treatment strategies. Shared genetic markers may also serve as prognostic indicators for disease severity and progression, allowing clinicians to stratify patients on the basis of risk and recommend appropriate lifestyle or pharmacological interventions. Finally, uncovering these genetic factors can help mitigate the risk of cardiovascular events, such as heart attacks, strokes, and limb ischemia, by facilitating timely and proactive interventions. In summary, our work clarifies certain unknown links between CAD and peripheral artery disease and describes potential processes related to those 2 diseases. Overall, the study highlights potential biomarkers and therapeutic targets, and translating these findings into clinical practice requires extensive validation, including longitudinal studies and clinical trials. The feasibility of incorporating genetic screening into routine clinical workflows also needs further investigation.
Footnotes
Ethical considerations
Not applicable.
Informed consent
Not applicable.
Author contributions
AQN performed the data collection and analysis, wrote the initial draft of the manuscript and LC supervised reviewed, edited, and approved the final version
Funding
The author(s) received no financial support for the research, authorship, and/or publication of this article.
Competing interests
The author(s) declared no potential conflicts of interest with respect to the research, authorship, and/or publication of this article.
Availability of data and materials
Not applicable.