
Abstract
Background:
Transcriptomics can reveal much about cellular activity, and cancer transcriptomics have been useful in investigating tumor cell behaviors. Patterns in transcriptome-wide gene expression can be used to investigate biological mechanisms and pathways that can explain the variability in patient response to cancer therapies.
Methods:
We identified gene expression patterns related to patient drug response by clustering tumor gene expression data and selecting from the resulting gene clusters those where expression of cluster genes was related to patient survival on specific drugs. We then investigated these gene clusters for biological meaning using several approaches, including identifying common genomic locations and transcription factors whose targets were enriched in these clusters and performing survival analyses to support these candidate transcription factor-drug relationships.
Results:
We identified gene clusters related to drug-specific survival, and through these, we were able to associate observed variations in patient drug response to specific known biological phenomena. Specifically, our analysis implicated 2 stem cell-related transcription factors, HOXB4 and SALL4, in poor response to temozolomide in brain cancers. In addition, expression of SNRNP70 and its targets were implicated in cetuximab response by 3 different analyses, although the mechanism remains unclear. We also found evidence that 2 cancer-related chromosomal structural changes may impact drug efficacy.
Conclusion:
In this study, we present the gene clusters identified and the results of our systematic analysis linking drug efficacy to specific transcription factors, which are rich sources of potential mechanistic relationships impacting patient outcomes. We also highlight the most promising of these results, which were supported by multiple analyses and by previous research. We report these findings as promising avenues for independent validation and further research into cancer treatments and patient response.
Keywords
Introduction
Transcriptomics is an informative paradigm to study as it reflects the current state of cellular processes in a sample. Identifying patterns in gene expression is especially helpful to identify active transcriptional programs and draw connections with known biological pathways. 1 In addition, gene expression patterns may correspond to disease states, prognoses, or drug susceptibilities in cancer, enabling deeper understanding of a disease at a given point in time.2,3 Recently, the increasing availability of molecular data in cancer has allowed mining for molecular patterns to delineate subtypes and reveal mechanisms underlying cancer cell processes. Clustering of gene expression data can offer an efficient approach to delineating molecular patterns and functionally related gene subsets.4,5 Moreover, integrating clinical data into the analysis and interpretation of gene expression patterns can help uncover cellular mechanisms driving patient outcomes in contexts of interest. Identifying tumor gene expression patterns that can provide insights into the heterogeneity in patient drug response is a promising avenue of research toward the development of effective treatment strategies in the era of personalized medicine.6-8
Tumor gene expression and regulation has been linked to drug response. The relationship between cancer cell gene expression and drug sensitivity has been studied extensively in vitro, but the findings have seen limited applicability to real-world patient outcomes. Large molecular datasets linked to patient clinical data, such as The Cancer Genome Atlas (TCGA), have made it possible to gain clinically relevant insights based on primary samples.9,10 Analysis of TCGA gene expression data has been instrumental in discovering new cancer subtypes that impact patient outcomes.11-14 However, characterization of tumor gene expression patterns related to drug response has been sparse. Previously, we identified expression-based gene clusters as biomarkers of patient drug response, and a limited investigation of biological interpretation of these gene clusters suggested a potential role of transcription factors (TFs) in mediating these responses. 15 However, the biological implications of these gene clusters were not fully explored.
Here, we clustered gene expression data from entire cancer cohorts in TCGA and identified gene clusters whose expression was related to patient outcomes on specific drugs. We then employed multiple approaches to identify commonalities that could explain the shared expression patterns within these gene clusters, either by upstream regulatory elements or genomic location. Our findings include evidence supporting the involvement of stem cell self-renewal-related TFs in patient response to temozolomide and evidence pointing to drug response differences stemming from cancer-related chromosomal structural changes in the genome. To our knowledge, this study is the first to examine pre-treatment transcriptional patterns and their implications in the context of real patient outcomes on specific treatments. In addition, this analysis highlights the potential that gene sets identified by computational methods like unsupervised clustering have in identifying critical molecular factors influencing drug efficacy and helps untangle the interplay between patient drug response, associated transcriptional patterns, and the underlying biological mechanisms.
Methods
Pipeline
To identify patterns of gene expression related to drug efficacy, we used gene clustering to delineate the patterns and survival analyses to select those relevant to patient outcomes on various drugs. We first binarized RNA-seq data from pre-treatment samples from TCGA using data from 10 237 patients from 33 cancer types, and then split the data into cancer-specific datasets of binarized gene expression data for all 58 364 genes from all primary tumor samples of that cancer type. For each cancer dataset, we obtained clusters of genes that tend to be co-expressed in the same patients using co-occurrence clustering. 16 This algorithm recursively clusters all genes based on their expression patterns across various patient subsets in the dataset. Then, for a given drug, we tested each gene cluster identified in the cancer cohort to determine if it showed survival differences in patients who took that drug, stratified based on how many of the cluster’s genes they expressed. To exclude any survival differences based on the cancer and not on the drug, we then performed the same test in patients who did not take that drug. We then investigated clusters that showed drug-specific survival differences for potential factors involved in the observed survival effect using overrepresentation analysis to identify common features of the cluster genes, such as common regulatory elements or transcription factors (TFs). Additional drug-specific survival analyses were used to verify drug-cluster-TF target relationships and to support direct drug-TF relationships in some cases. We further investigated the driving forces behind the drug-specific survival effects of these clusters by finding core sets of genes that clustered together multiple times and identifying cases where all genes within the core set related to the same biological phenomenon.
Data
We acquired TCGA drug treatment data and gene expression data from the Genomic Data Commons (GDC) database, and we downloaded the files using the GDC Data Transfer Tool and file manifests obtained via the GDC API. When creating the manifests, the parameters used were return_type: manifest along with the files.data_type: Gene Expression Quantification and analysis.workflow_type: HTSeq - FPKM-UQ filters for RNA-seq data and the files.data_type: Clinical Supplement and files.data_format: BCR Biotab filters for clinical data. Other clinical data, such as survival data, were queried using the GDC API to ensure up-to-date information. We used a drug name mapping (available at https://gdisc.bme.gatech.edu/Data/DrugCorrection.csv) previously curated manually by our group for standardizing drug names in clinical exposure data. Cancer types were TCGA study acronyms; full cancer names are listed in Table 1 and available at https://gdc.cancer.gov/resources-tcga-users/tcga-code-tables/tcga-study-abbreviations. Data acquisition, wrangling, analysis, and visualization were all implemented in Python.
TCGA cancer cohorts and clusters.

Table showing the TCGA cancer cohorts clustered, listing the number of patients in the cohort, the number of clusters identified, and the number of drugs taken by a sufficient number of patients in the cohort to perform drug-specific survival analysis.
Binarization of gene expression data
Binarization thresholds were calculated using a method implemented in Python based on the Stepminer algorithm. 17 For each feature, we ordered expression values from low to high and then fit a step function to these data based on a specific threshold, testing 400 different thresholds and selecting the threshold that minimized the mean square error within the high and low subsets. For individual genes, log-transformed FPKM-UQ values were binarized using thresholds calculated across all samples in the TCGA dataset to reflect the natural expression ranges of each gene across a variety of cell types. To binarize expression levels of features composed of multiple genes, such as our gene clusters or their subsets, we calculated a given feature’s expression (as measured by how many of the feature’s genes were highly expressed) for all patients in the cancer cohort in which the feature was identified. We then calculated the binarization thresholds based only on these patients.
Clustering of genes
We clustered 58 364 genes from binarized TCGA pre-treatment gene expression FPKM-UQ values across all patients in a cancer cohort. The clustering algorithm we used was adapted from a previously described method developed for the analysis of single cell RNA-seq data called co-occurrence clustering. 16 This algorithm is an iterative bi-clustering method that clusters binarized gene expression data based on similarity of expression across patients in a cancer cohort. It constructs a gene-gene graph based on chi-square pairwise association and then uses the Louvain algorithm for community detection to identify gene clusters within the graph. It then clusters patients similarly based on their expression levels of each gene cluster. This process was then iterated for each patient cluster identified, yielding multiple sets of gene clusters for each cancer cohort. Clusters produced by this algorithm contain sets of genes that tend to be co-expressed in patients with that cancer. No survival information was used in the clustering process.
Multiple test corrections
All statistical test P-values were adjusted to control the false discovery rate (FDR) for multiple tests using the Benjamini-Hochberg procedure, as implemented in the fdrcorrection method of the statsmodels Python package. Adjusted P-values (Q-values) are reported for individual results. Significance thresholds for different analyses are reported as the false discovery rate (i.e. 10% FDR, corresponding to Q < .1) at which results were considered significant.
Of note, we did not adjust P-values from log-rank tests performed on patients not exposed to a drug (see Methods: Drug-specific survival analysis). Significance in this test was used as an exclusion criterion because it indicated that a survival effect was not drug-specific; therefore, we used raw P-value to exclude any possible cancer-wide, non-drug-specific survival effects.
Drug-specific survival analysis
For a given drug, patients within the appropriate cancer cohort were split into groups based on whether they were exposed to the drug. For each feature of interest (cluster, gene, or gene subset), we first performed survival analysis on the patients who took the drug, stratifying the patients by expression level of the feature and comparing survival times between strata using the log-rank test from the lifelines package in Python (see Methods: Binarization of gene expression data). Then, for features significant according to a 10% false discovery rate (FDR), the same log-rank test was performed on patients who did not take the drug. Survival tests were only performed if there were at least 10 high and 10 low expressors in both drug exposure groups. A feature was considered to have a drug-specific survival effect if we observed a significant (Q < .1) survival effect in patients who took the drug and no survival differences (P ⩾ .1) or an opposite survival effect in patients who did not take the drug.
Transcription factor selection
Identification of transcription factors (TFs) related to drug-specific survival effects observed in our gene sets (clusters or their subsets) involved 2 steps. First, we performed over-representation analysis to identify TFs whose targets were enriched within a gene set. For our reference TF target gene sets, we used the GTRD sub-collection of the Molecular Signatures Database (MSigDB), 18 which contains gene sets of known or predicted targets of TFs. In MSigDB, the target gene set of a TF is defined as genes whose predicted binding site for the given TF is within −1000 to +500 bp of the transcription start site. A detailed explanation can be found at https://www.gsea-msigdb.org/gsea/msigdb/collection_details.jsp#GTRD. We then identified the top TFs (up to 100) whose target genes were significantly enriched in each gene set using a 5% FDR to determine significance.
Next, for each TF identified in the first step, we tested whether the drug-specific survival effects observed in our gene set were also observed among the TF targets in the set. We performed survival analysis for each proposed gene set-TF pair, stratifying patients based on expression of only the subset of the TF’s target genes in that gene set. We excluded from further analysis TFs whose target genes in a gene set did not show a survival effect similar to that of the gene set or showed a similar survival effect in patients who did not take the drug. This limited our results to include only TFs whose target genes in the gene set were related to the drug-specific survival effects we were investigating.
Results
Clustering identifies gene sets whose expression impacts patient survival on drugs
Within TCGA data, there were 22 cancer cohorts with gene expression data and sufficient patients for drug-specific survival analysis with respect to at least one drug among the cancer cohort. Table 1 lists the number of patients in each of the cancer datasets and the number of gene clusters identified, along with the number of drugs taken by enough patients in each cancer cohort to perform drug-specific survival analysis. Table 1 also includes the TCGA acronyms for each cancer type along with the full name of the cancer. Clusters were named for the TCGA acronym of the respective cancer along with a number for identification (e.g. HNSC.55 for one of the clusters from head and neck squamous cell carcinoma). We considered gene clusters to show drug-specific survival differences if they showed significant (Q < .1) differences in overall patient survival on a given drug but no survival effect (P ⩾ .1) or an opposite survival effect in patients who did not take the drug. We identified 98 cluster-drug pairs with demonstrated impact on patient survival across 7 cancers, spanning 73 clusters and 10 drugs. Table 2 summarizes these analyses. The full list of significant cluster-drug pairs and their log-rank statistics are in the Supplemental Table S1.
Summary of individual cluster analysis.

Table summarizing our analysis results from individual clusters. For each of 12 cancer-drug combinations, we show the number of patients in the cancer-drug cohort, the number of clusters with significant drug-specific impact on survival, the number of TFs enriched among these clusters, and the number of these TFs whose expression also impacted drug-specific survival.
Clusters are enriched for TF targets with drug-specific survival effects
We then investigated these identified drug-specific gene clusters for insights into potential biological mechanisms behind their drug-specific survival effects. We put special focus on finding transcription factors (TFs) that could be related to patient drug response, as TFs are closely tied to gene expression and have been implicated in cancer drug efficacy. We used the hypergeometric test to identify sets of TF target genes that were enriched in our drug-specific gene clusters to identify candidate drug-cluster-TF relationships. Because gene clusters may capture multiple molecular mechanisms, some of which may not be specific to drug response and thus not of interest in this study, we only considered instances where the TF’s targets in the cluster showed the same drug-specific survival effect observed in the cluster. For each putative drug-cluster-TF relationship, we applied our drug-specific survival analysis to the subset of TF-related genes within the cluster and excluded from further analysis those with no survival effect, a survival effect opposite to the survival effect under investigation, or a survival effect not specific to patients taking the drug. Using this strategy, we obtained 4947 putative drug-cluster-TF relationships that relate to that cluster’s impact on drug efficacy, representing 1437 potential cancer-drug-TF interactions.
Extending this strategy, we identified strong potential drug-cluster-TF relationships by finding instances where the TF targets in a cluster encompass the primary mechanism driving the cluster’s effect on drug response. For each of our identified drug-cluster-TF relationships, we performed drug-specific survival analysis on the subset of genes in the cluster that are not targets of the TF. We then identified those cases where the cluster lost its drug-specific survival effect when the TF’s target genes were excluded from the cluster. Table 3 shows our results. In all 5 of these cases, the TF target genes accounted for a small portion of the cluster’s genes, demonstrating that the target genes of these TFs include the main drivers of these clusters’ impact on drug-specific survival.
Transcription factor targets driving drug-specific survival differences.

Table showing the 5 cases where a gene cluster exhibited a drug-specific survival effect that was lost when targets of a transcription factor were removed from the cluster.
To support potential mechanistic relationships among our identified drug-TF pairs, we also looked for drug-specific survival differences based on expression levels of the TFs themselves. Of the 1437 putative cancer-drug-TF interactions, 876 had a sufficient number of high and low TF-expressing patients to test whether expression of the TF impacted drug-specific survival in that cancer, and 96 of these showed significant drug-specific survival effects in this analysis. These results are summarized in Table 2. These additional analyses helped identify stronger examples where there may be a more direct relationship between TFs and the drugs in which they influenced patient survival based on the original clusters.
Highly similar clusters contain consistently co-expressed genes related to drug efficacy
In addition to investigating individual clusters for biological implications, we explored several strategies based on relationships between clusters. Our clustering algorithm is iterative, so gene clusters from different iterations of the clustering algorithm can overlap; therefore, we explored the degree of gene overlap between all clusters. To determine how often our clusters contain overlapping genes and overlapping drug effects, we used the hypergeometric test to determine significant (5% FDR) overlaps between clusters. We compared each of our 98 identified drug-specific gene clusters in a pairwise manner with every other gene cluster and categorized the results according to whether the clusters being compared shared drug-specific survival effects. In total, we found that 14% of all cluster pairs and 41% of pairs with the same drug-specific survival effects significantly overlapped, indicating that clusters with the same drug effects may be related or have common mechanisms. We also investigated cluster similarity, calculating the Jaccard similarity index (JI) between pairs of clusters identified in the same cancer cohort. The distribution of these scores is shown in Figure 1, which illustrates that all substantially similar same-cancer cluster pairs had drug-specific survival effects in common for at least one drug (red), whereas pairs with no shared drug-specific survival effects (including pairs with survival effects specific to the same drug but with opposite effects on survival) (blue) all have low similarity.
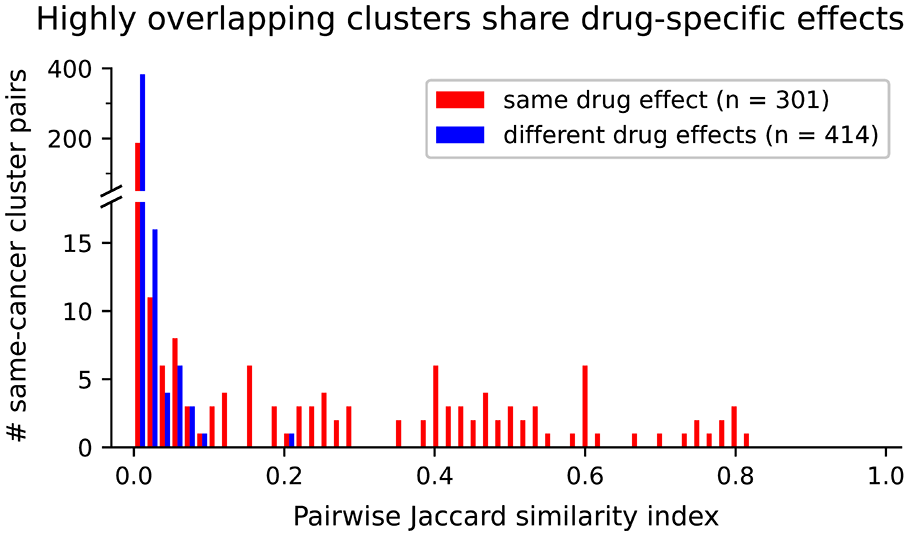
Histogram showing distribution of pairwise Jaccard index (JI) when comparing drug-specific clusters from the same cancer. Cluster pairs that share drug-specific survival effects are shown in red and cluster pairs with effects in different drugs or in opposite directions are shown in blue.
We then looked at the cluster pairs with the highest similarity, that is, gene clusters identified in different patient subgroups in the same cancer containing most of the same genes. Twenty-eight cluster pairs had a JI >.5, involving 20 unique clusters and 5 drug interactions across 3 cancers. Figure 2 shows a graph illustrating the relationships between these clusters, with each of these clusters represented by a node and edges connecting cluster pairs with significant overlap (hypergeometric test, 5% FDR). These clusters separated neatly into 5 disconnected subgraphs, which are shown in Figure 2 labeled with letters. In contrast to the lack of edges between these subgraphs, clusters within each subgraph were strongly interconnected, indicating a high degree of overlap between all clusters within these cluster groups. In addition, all clusters in the same cluster group shared the same drug-specific survival effects. We therefore identified the set of genes present in all clusters within each cluster group. Each of the resulting shared gene sets comprises a consistent set of co-expressed genes, identified in multiple iterations of co-occurrence clustering and thus multiple patient subgroups within a cancer cohort; therefore, they may represent a core set of genes related to the survival effects shared by the clusters in the group.

Network showing the relationships between gene clusters with high overlap and delineating cluster groups. Every cluster involved in at least one pair with JI >.5 is represented by a node. Edges are shown between any 2 gene clusters with a significant number of shared genes, as determined by hypergeometric test (5% FDR), and are weighted by JI. Cluster groups are labeled by letters corresponding to Table 4. COAD clusters are in green, LUAD clusters are red, and HNSC clusters are blue nodes. Node size indicates cluster size.
After identifying these gene sets, we first confirmed that the gene sets retained the same drug-specific survival effects that the clusters in the cluster group shared. Table 4 summarizes our analysis of these 5 cluster groups and their shared genes and shows Kaplan-Meier curves illustrating the survival effects of their expression in their respective cancer-drug cohorts. In all cases, the gene sets were as effective in separating responders and non-responders as the clusters in the cluster group, and none of the 5 gene sets showed survival differences in the patients who did not take the drug in question. As expected, these shared gene sets stratified patients similarly to the individual clusters, thereby having the same predictive power; however, the consistency of their co-expression suggests a biological relationship between the genes in each set.
Survival and features of shared genes of high-overlap cluster groups.
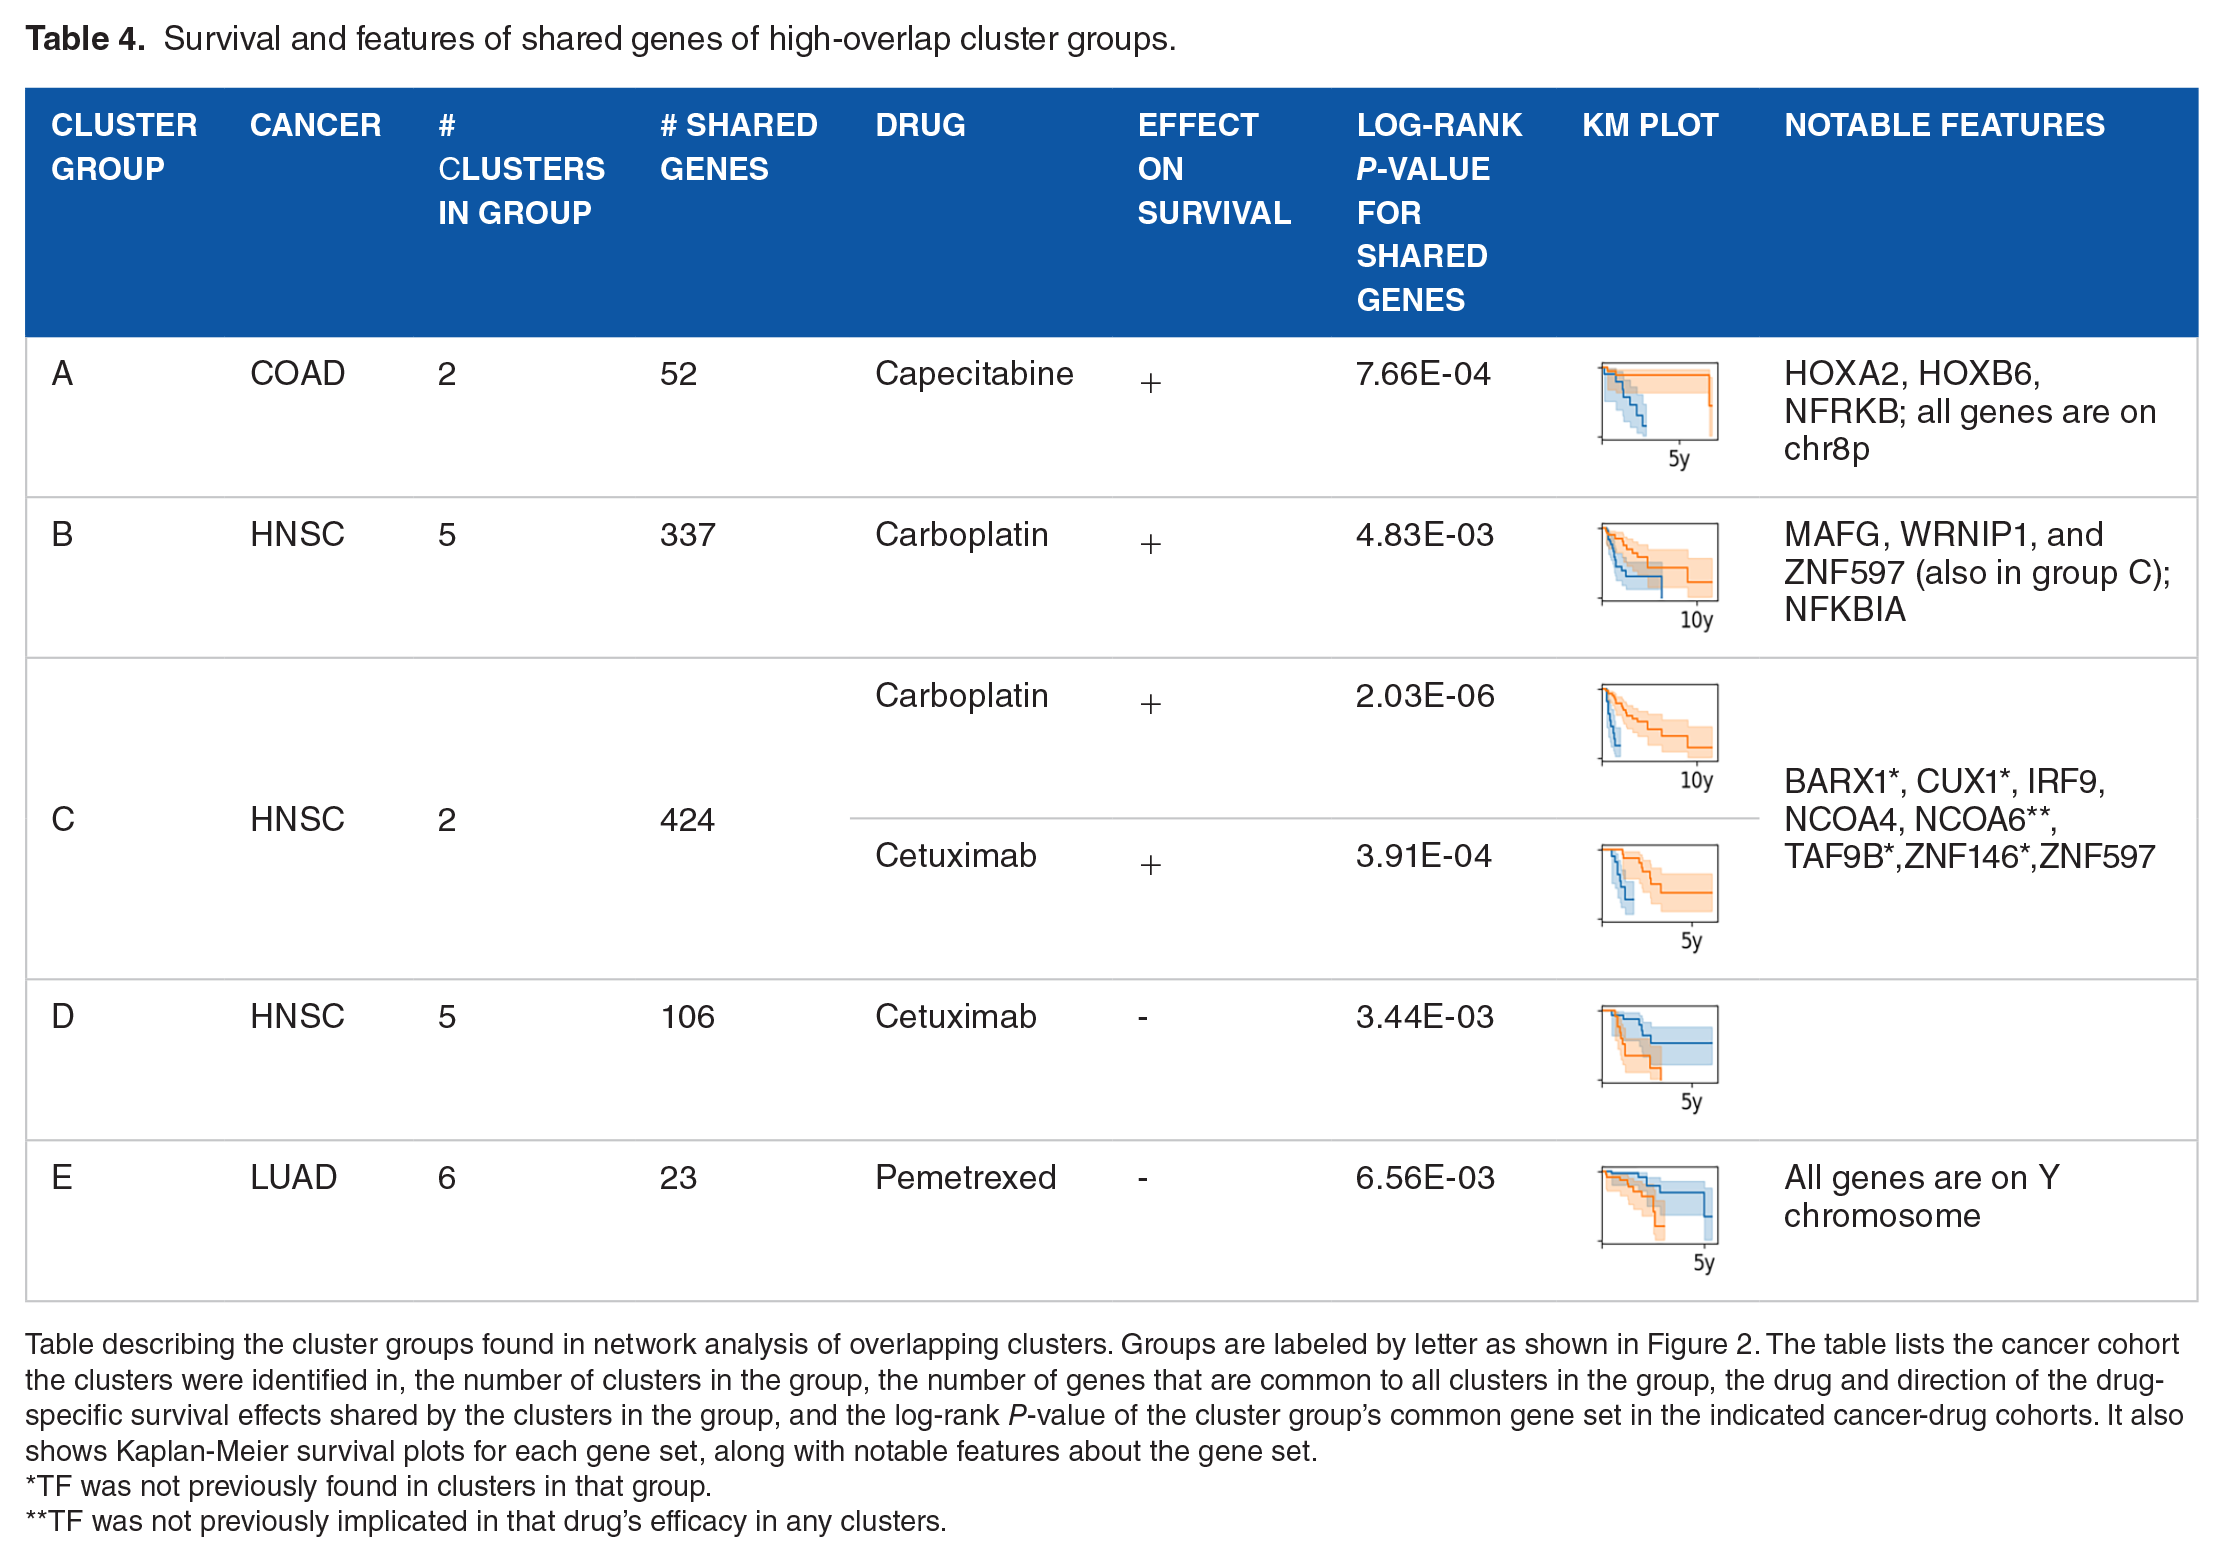
Table describing the cluster groups found in network analysis of overlapping clusters. Groups are labeled by letter as shown in Figure 2. The table lists the cancer cohort the clusters were identified in, the number of clusters in the group, the number of genes that are common to all clusters in the group, the drug and direction of the drug-specific survival effects shared by the clusters in the group, and the log-rank P-value of the cluster group’s common gene set in the indicated cancer-drug cohorts. It also shows Kaplan-Meier survival plots for each gene set, along with notable features about the gene set.
TF was not previously found in clusters in that group.
TF was not previously implicated in that drug’s efficacy in any clusters.
Shared gene sets link drug efficacy with TFs and chromosomal differences
We then investigated the shared gene sets from our 5 high-overlap cluster groups for biological insights. First, we identified potential TF involvement using the same enrichment and survival method as we used in the clusters. One interesting finding was that, even though the gene sets from cluster groups B and C were disjointed and had no genes in common, commonalities existed among the TFs implicated in the carboplatin-specific survival effects of these gene sets. MAFG, WRNIP1, and ZNF597 were all implicated in carboplatin efficacy by their enrichment and survival effects among the shared gene sets from cluster groups B and C. The fact that these TFs were identified in 2 unrelated, non-overlapping cluster group gene sets reinforces the claim that they play a role in patient response to carboplatin. Because these gene sets contain only the genes in the intersection of multiple clusters and represent frequently co-expressed genes, they are more likely to contain co-regulated genes. We therefore assigned special importance to TFs where enrichment of target genes within these cluster group gene sets was stronger than in the original clusters in their respective cluster groups. These included 5 TFs identified in cluster group C whose targets were not identified in the clusters in group C but which showed both carboplatin-specific and cetuximab-specific survival effects. This produces 10 drug-TF relationships identified in group C that were not strong enough to be identified in group C clusters, 7 of which were implicated in our analysis through other clusters. Table 4 includes these TFs as well as other examples pertaining to these cluster groups that we highlight in the text.
One striking observation was that 2 of the shared gene sets (those from cluster groups A and E) were composed entirely of genes from the same genomic location, further supporting our hypothesis that these gene sets capture genes with strong biological relationships. The other 3 gene sets contained genes distributed across all 23 chromosomes and were therefore not related by genome location. In group A, all 52 genes shared by the clusters are located on the short arm of chromosome 8 (8p), despite the fact that each of the clusters in group A contains genes from multiple chromosomes. In our analysis, low expression of these genes in COAD patients was associated with poor survival outcomes specific to patients treated with capecitabine, a formulation of fluorouracil and an antimetabolite that blocks synthesis of molecules required for cell proliferation. Interestingly, 8p is known to be a region of high mutation rates in general19,20 and a common site of loss of heterozygosity (LOH) in cancer.21,22 Mutations and LOH both typically lead to lower expression of the affected genes and are generally associated with worse cancer outcomes, especially in regions like 8p, which is known to contain several tumor suppressing genes. 23 More recently, cell line models of 8p LOH were shown to lose drug sensitivity and showed increased resistance to fluorouracil compared to isogenic non-8p-deleted cells. 24 In addition, in specific 8p bands, copy number alterations 22 and single nucleotide polymorphisms 25 have been associated with differences in patient response to chemotherapy. Although these studies did not specifically investigate capecitabine, our results are consistent with the poor outcomes and increased drug resistance reported with aberrations in 8p, suggesting a potential link between these phenomena and capecitabine efficacy. If validated, this connection could help identify patients with higher chances of success on capecitabine and lead to new discoveries of specific drug interactions.
In cluster group E, all 23 genes shared by the clusters in the group were located on the Y chromosome. Unsurprisingly, stratifying patients by expression of these Y-chromosome genes among patients who took pemetrexed effectively split the population by gender. Pemetrexed is an antimetabolite, like capecitabine, which in this case acts as a folate antagonist that blocks multiple synthesis pathways required in cell survival and growth. Although no gender differences have been reported in patient response to pemetrexed, many factors determining drug response differ by gender, 26 and emerging evidence shows sex differences in cellular drug metabolism pathways in lung cancer.27,28 In addition, TCGA clinical data shows pemetrexed-specific survival differences between genders in LUAD patients: among LUAD patients who took pemetrexed, females had better survival than male patients in the TCGA dataset (P = 7e−3), whereas no gender differences in survival were observed among LUAD patients who did not take pemetrexed (P = .71).
However, this gene set may have captured biological differences that go beyond separating by gender and may be involved in more subtle sex-related differences. It is likely that several of the clusters in group E were identified in all-male patient subsets in the clustering process, which would suggest these genes tend to be co-expressed among males and may be related to differences among male LUAD patients. This is plausible, as low expression of Y-chromosome genes in males, especially in cancer, has been linked to loss of the Y chromosome (LOY), 29 which is common in cancer and is associated with increased risk and negative patient outcomes in several cancer contexts.30,31 These consequences have been attributed to the loss of 6 Y chromosome genes that act as tumor suppressors,29,30 all of which are among cluster group E’s shared genes, further supporting a relationship between our gene set and LOY. Although LOY has not been previously reported as impacting pemetrexed efficacy, there is evidence of male-specific pathways that impact pemetrexed response in male lung cancer cells but are absent in female cells. 27 Such pathways and their resulting differences in pemetrexed sensitivity could be related to expression differences in these genes and could also confound the identification of gender differences in pemetrexed response and explain conflicting reports about the effect of gender on pemetrexed efficacy. We therefore also investigated whether this gene set might have pemetrexed-related effects among male LUAD patients. Recalculating our high/low threshold to be appropriate for the male patient subset, we observed a modest pemetrexed-specific survival effect (P = .07) where males with low expression of these genes had worse survival than high-expressing males. The potential for these genes to be related to a male-specific pemetrexed response is promising, considering evidence of sex differences in pemetrexed response pathways, the similarity of this gene expression pattern to gene expression in LOY, and the modest but still pemetrexed-specific survival effects observed among LUAD males despite a small (n = 24) sample size.
Nuclear hormone receptors associated with better drug response in cetuximab
In identifying TFs in the shared gene sets of each cluster group, nuclear receptor coactivator 6 (NCOA6) emerged as an interesting example in cluster group C. NCOA6 target genes were significantly enriched (Q = 3e−7) in the 424 genes shared by clusters in cluster group C, but not in the clusters themselves or in any other HNSC clusters. NCOA6 targets in the cluster group C shared gene set showed the same drug-specific survival effects in both carboplatin (P = 1e−4) and cetuximab (P = 2e−3) as the group C genes. A potential relationship between NCOA6 and cetuximab was further supported by our subsequent observation that high expression of NCOA6 itself was significantly and drug-specifically associated with better patient outcomes in cetuximab (P = 6e−5) (Figure 3A).

Kaplan-Meier survival plots showing survival differences between high-expressing patients (orange) and low-expressing patients (blue) of the indicated gene or gene set. Plot pairs each feature a TF and the cancer-drug cohort in which it was identified through gene set overrepresentation analysis. The left plot shows survival differences in patients based on expression of the TF’s targets in the relevant gene set and the right plot shows the survival effect of expression of the TF itself. P-values are indicated within the plots. (A) Survival plots by expression of NCOA6 targets within the genes shared by clusters in group C (left) and by expression of NCOA6 (right) in HNSC patients taking cetuximab. (B) Survival by expression of SNRNP70 targets in cluster HNSC.68 (left) and by expression of SNRNP70 (right) in HNSC patients on cetuximab. (C) Survival by expression of SALL4 targets in LGG.59 (left) and by expression of SALL4 (right) in LGG patients on temozolomide. (D) Survival of LGG patients taking temozolomide, stratified by expression of HOXB4 target genes in LGG.50 (left) and by expression of HOXB4 (right). HOXB4 expression shows significant survival effects, but they could not be confirmed as drug-specific due to too few high expressors among LGG patients who did not take temozolomide.
NCOA6 is a hormone-responsive coactivator of transcription of its target genes. Cetuximab is an inhibitor of epidermal growth factor receptor (EGFR), which is involved in cell growth. While the mechanism by which it could interact with cetuximab is unknown, NCOA6 has been identified as an upstream regulator of 2 common EGFR ligands.32,33 Although NCOA6 target genes were not significantly enriched in any individual HNSC cluster, our observations from the cluster group C gene set and from survival differences based on expression of NCOA6 point to a significant relationship between NCOA6 and cetuximab, and potentially between NCOA6 and carboplatin.
Although many of our putative TF-drug relationships have not been previously characterized, our results included several TF-drug relationships that have already been reported. For example, abnormalities in nuclear receptor coactivator 4 (NCOA4), another hormone-sensitive coactivator of transcription, 34 have been reported in cetuximab resistant patients. 35 This is in accordance with our observation that expression of NCOA4 is associated with better survival in HNSC patients taking cetuximab (P = .01, Q = .067), a relationship first suggested because we found 4 HNSC clusters where expression of their NCOA4 target genes showed better cetuximab-specific survival. One of these clusters (HNSC.100) was in cluster group C, whose shared gene set showed a similar relationship between NCOA4 and cetuximab (P = 4e−4). These results, along with the previously reported evidence, provide support for a likely protective effect of high NCOA4 expression in patients taking cetuximab.
SNRNP70 activity is associated with worse patient outcomes on cetuximab
One of the most notable results from this analysis involves the relationship between SNRNP70 and cetuximab within cluster HNSC.68. SNRNP70 target genes were significantly enriched within HNSC.68 (Q = 1e−29), accounting for 58 out of the 331 genes in HNSC.68. We found that the cetuximab-specific survival benefit conferred by low expression of HNSC.68 genes (P = 1e−3, Q = .016) was even more pronounced (P = 1e−4, Q = 4e−4) when limited to just SNRNP70s target genes. Moreover, we found that these 58 target genes encompassed the genes driving the drug-specific survival effects observed in HNSC.68: we found no survival difference when stratifying patients based on only the subset of HNSC.68 genes that were not SNRNP70 target genes (P = .2). Furthermore, we found that low expression of SNRNP70 was associated with better patient survival on cetuximab (P < .001, Q = .026). Figure 3B shows KM curves of HNSC patients on cetuximab, stratified by expression of HNSC.68′s SNRNP70 target genes and by SNRNP70 expression. SNRNP70 was thus implicated in cetuximab-specific survival by multiple analysis strategies, further supporting a potential mechanistic relationship with patient outcomes on cetuximab.
Although to our knowledge no relationship between cetuximab and SNRNP70 has been reported, it is interesting to consider the implications of this putative relationship based on what is known about them. SNRNP70 is a component of the spliceosome and is involved in mRNA splicing. The implication of SNRNP70 in drug-specific survival differences may point to differences in gene splicing, which in some cases have been linked to alterations in drug response.36,37 Interestingly, there is also evidence that splice variants of EGFR itself may behave differently in response to inhibition by cetuximab.38,39 While there is no known mechanism relating SNRNP70 and cetuximab efficacy, it is conceivable that changes in splicing could alter signaling pathways involved in cetuximab’s effect, such as the EGFR signaling pathway, leading to altered drug responses. Therefore, further studies elucidating the specific molecular interplay relating SNRNP70 functions and patient outcomes on cetuximab may be warranted.
An interesting observation related to the effects seen in SNRNP70 target genes in cetuximab is a similar relationship between ELF2 target genes and cetuximab. As seen in Table 3, removal of target genes of ELF2 and removal of SNRNP70 target genes each eliminated cluster HNSC.68′s cetuximab-specific survival effect, suggesting that either or both of these sets of TF targets could be driving the observed survival differences. Of note, ELF2 and SNRNP70 share 20 targets among HNSC.68 genes. Interestingly, these 2 were the only ones of the 5 drug-cluster-TF relationships highlighted in Table 3 with enough high- and low-expressing patients to test the TF’s expression level for drug-specific survival differences. While expression of SNRNP70 showed cetuximab-specific survival effects, ELF2 expression was not associated with survival differences in HNSC patients on cetuximab (P = .83). Therefore, although the possibility remains of a relationship between ELF2 and the cetuximab-specific survival effects seen in HNSC.68, this observation may also be an artifact of the overlap of ELF2 target genes with those of SNRNP70 among HNSC.68 genes.
TFs regulating self-renewal are associated with increased temozolomide resistance in LGG
One of the most promising putative relationships we identified in this analysis is a potential detrimental role of SALL4 in temozolomide response in LGG, which was supported by multiple lines of evidence in our analysis and by previous studies. SALL4 is a transcription factor known for its role in promoting self-renewal and “stemness” in stem cells, and one study showed that inhibiting SALL4 increases sensitivity to temozolomide. 40 SALL4 has also been associated with glioma stem cells (GSCs), 41 which have increased resistance to alkylating agents such as temozolomide. 42 SALL4 target genes were implicated in the temozolomide-specific survival effects observed in two LGG clusters, one positively (LGG.59) and one negatively (LGG.50), which aligns with reports that some SALL4 targets are activated by SALL4 and some are repressed. 43 Furthermore, expression of SALL4 was strongly associated with poor temozolomide-specific survival (Q = 5e−8) in our analysis. Figure 3C illustrates survival in LGG patients on temozolomide, stratified by expression of SALL4 target genes in LGG.59 and by expression of SALL4 itself. In addition, previous analyses of other molecular TCGA datasets have also implicated an antagonistic relationship between SALL4 and temozolomide: high levels of promoter-region methylation among SALL4 target genes, which could inhibit SALL4′s transcriptional effects, were associated with significantly better temozolomide-specific survival in LGG patients, 44 and increased copy number of the SALL4 gene, a state associated with an increase in SALL4 expression, showed poor LGG patient survival among those taking temozolomide. 45 Taken together, these suggest that SALL4 may be detrimental to temozolomide efficacy in LGG patients, potentially related to its expression in GSCs.
Another interesting, potentially related finding involves the transcription factor HOXB4, whose targets were significantly enriched (Q = 5e−5) in LGG.50. Drug-specific survival analysis showed that the HOXB4 target genes in LGG.50 showed even stronger (P = 2e−6, Q = 5e−5) temozolomide-specific survival differences in LGG patients than the original cluster (P = 2e−4, Q = 8e−4). Figure 3D shows the Kaplan-Meier curves showing the survival effects of expression of LGG.50′s HOXB4 target genes in LGG among patients on temozolomide. Although expression of HOXB4 is also significantly associated with survival of LGG patients on temozolomide (P = 6e−12, Q = 4e−10), there were too few high expressors of HOXB4 among LGG patients who did not take temozolomide to test whether this observation is temozolomide-specific or true of LGG patients in general. Much like SALL4, HOXB4 is involved in stemness and self-renewal in stem cells. Moreover, HOXB4 has been directly shown to be overexpressed in drug-resistant GSCs, and in addition, HOXB4 targets include key regulators of pathways that are also implicated in self-renewal in GSCs.46,47 While HOXB4 has not previously been implicated in temozolomide efficacy, our observation of temozolomide-specific survival effects of LGG.50′s HOXB4 targets in LGG patients suggests a role for HOXB4-related pathways in temozolomide efficacy. Indeed, the implication of these two stemness-related TFs in temozolomide outcomes suggests a promising avenue for further exploration into a potential interaction between the regulation of self-renewal in GSCs and temozolomide resistance mechanisms in LGG patients.
Discussion
Our investigation utilized a gene clustering approach to explore connections between gene expression patterns and drug response across diverse cancer types, successfully identifying biologically meaningful clusters linked to drug-specific patient survival. Our drug-specific survival analysis strategy helped us identify which of these clusters influence drug efficacy while excluding those primarily tied to general cancer-related survival effects. Notably, our approach used binarized gene expression data, demonstrating that binarized gene expression retains sufficient information to find biologically informative gene expression signatures with drug-specific effects. Exploring these clusters yielded promising findings that shed light on transcription factors (TFs) and other biological relationships potentially involved in drug efficacy.
Recognizing the pivotal role of TFs in drug response, much of our analysis focused on identifying TFs whose targets are associated with drug-specific survival through our clusters and gene sets to generate potential TF-drug relationships. The number of putative TF-drug relationships we identified reflects the complexity of the regulatory landscape. We expect that some of these relationships may represent more direct involvement of the TF in drug response, especially those where both the TF target expression and expression of the TF itself were associated with drug-specific survival effects. Others are less direct but represent transcriptional states related to drug-specific survival.
In this study, we were able to trace drug-specific survival effects in clusters to biological relationships, such as chromosomal location and TF target enrichment. Examining the relationships identified by our most promising results in the context of known biology helped elucidate potential interactions. In several cases, we identified TF-drug relationships that have been reported previously. For example, we reported that expression of SALL4 and SALL4 target genes impact patient outcomes on temozolomide, which agrees with previous reports. Aligning with that was our observed interaction between temozolomide and expression of targets of HOXB4, a TF involved in similar processes as SALL4. To our knowledge, a relationship between temozolomide and HOXB4 has not been reported or studied, but such a relationship is plausible given HOXB4′s overexpression and functionality in cells with known resistance to temozolomide. These examples demonstrate the ability of our analysis strategies to identify biological relationships that were already known and suggest that the remaining results, most of which we could not find discussed in the literature, likely include novel relationships important to drug response. The strongest of these, like SNRNP70 in cetuximab efficacy or the isolation of chromosome-specific gene sets that cluster together, point to biological phenomena potentially involved in drug efficacy that are worth investigating.
While the results we present are significant, there are several important limitations to acknowledge. First, although our highlighted examples were supported by multiple separate analysis strategies, we were unable to find sufficiently comparable public datasets for independent validation of our results, nor have they been experimentally validated; thus, further study is needed to confirm the putative relationships we have identified. In addition, our analysis may be confounded by clusters encompassing multiple biological phenomena, not all of which may be directly linked to drug response but which tend to co-occur with drug response mechanisms. The complexity of cancer biology and the variety of factors influencing patient outcomes also pose challenges in pinpointing specific mechanisms solely based on clustering patterns. Lastly, while TCGA is an extensive resource, it is not unlimited. Separating patients by cancer type and drug for survival analysis often leads to small and sometimes too small sample sizes. For example, in many cases, there were too few high- or low-expressing patients to test if there were survival differences based on TF expression that were both significant and specific to the drug. Despite these limitations, our study provides a rich source of putative TF-drug interactions that are ripe for further study.
Conclusions
This study offers novel insights into relationships between gene expression patterns, drug efficacy, and transcriptional regulation across multiple cancer cohorts. We identified expression-based gene clusters associated with patient outcomes on specific drugs and linked the patterns within and among these clusters to known biology, shedding light on the underlying molecular mechanisms influencing patient responses to treatment. By suggesting potential relationships between gene expression clusters related to drug response and the commonalities shared by their genes, such as common transcriptional regulation or genomic location, our study contributes to the ongoing efforts in understanding the complexities of cancer treatment and offers promising avenues for future research for improving therapeutic strategies in the pursuit of precision medicine.
Supplemental Material
sj-docx-1-cix-10.1177_11769351241271560 – Supplemental material for Characterization of Expression-Based Gene Clusters Gives Insights into Variation in Patient Response to Cancer Therapies
Supplemental material, sj-docx-1-cix-10.1177_11769351241271560 for Characterization of Expression-Based Gene Clusters Gives Insights into Variation in Patient Response to Cancer Therapies by Bridget Neary and Peng Qiu in Cancer Informatics
Footnotes
Acknowledgements
Abbreviations
Author contributions
All authors were involved in method development. B.N. acquired and cleaned data, performed the analysis, and drafted the manuscript. P.Q. revised the manuscript. All authors have read and approved the final manuscript.
Declaration Of Conflicting Interests:
The author(s) declared no potential conflicts of interest with respect to the research, authorship, and/or publication of this article.
Funding:
The author(s) disclosed receipt of the following financial support for the research, authorship, and/or publication of this article: This work was supported by funding from the National Science Foundation (CCF2007029). PQ is an ISAC Marylou Ingram Scholar and a Wallace H. Coulter Distinguished Faculty Fellow. The funders had no role in study design, data collection and analysis, decision to publish, or preparation of the manuscript.
Research ethics and patient consent
Consent for publication
See research ethics.
Supplemental Material
Supplemental material for this article is available online.
References
Supplementary Material
Please find the following supplemental material available below.
For Open Access articles published under a Creative Commons License, all supplemental material carries the same license as the article it is associated with.
For non-Open Access articles published, all supplemental material carries a non-exclusive license, and permission requests for re-use of supplemental material or any part of supplemental material shall be sent directly to the copyright owner as specified in the copyright notice associated with the article.