
Abstract
High-throughput gene expression studies commonly employ pathway analyses to infer biological meaning from lists of differentially expressed genes (DEGs). In toxicology and pharmacology studies, treatment groups are analysed against vehicle controls to identify DEGs and altered pathways. Previously, we empirically quantified false-positive rates of DEGs in gene expression data from pools of vehicle-treated zebrafish embryos to determine appropriate study designs (sample and pool size). Here, the same data were subject to Over-Representation Analysis (ORA) and Gene Set Enrichment Analysis (GSEA) to identify false-positive enriched pathways. As expected, the number of false-positive ORA results was lowest where pool and sample sizes were largest (conditions which also generated the fewest significant DEGs). In contrast, the frequency of GSEA false-positives generated through the fast GSEA (fgsea) algorithm increased with pool and sample size and was highest for simulations that generated 0 DEGs, with ribosomal gene sets significantly enriched with the highest frequency. We describe 2 distinct mechanisms by which GSEA generated these false-positive results, both of which are most likely to generate significant gene sets under conditions where expression differences are particularly low. Finally, GSEA analyses were repeated using 1 alternative GSEA algorithm (CERNO) and 11 different ranking statistics. In almost every analysis, the number of significant results was highest where pool size was highest, with ribosome as the more frequently enriched gene set, suggesting our observations to be generalizable to different implementations of GSEA. These results from zebrafish embryos suggest caution in interpreting any GSEA results in contrasts where there are no DEGs.
Keywords
Introduction
Pathway analyses are typically used to extract meaningful biological information from complex transcriptomic datasets. These analyses are used to identify enrichment in functionally related groups of genes (gene sets) to enhance the predictive power and reproducibility of transcriptomic results across studies and species.1 -6 Over-Representation Analysis (ORA) and Gene Set Enrichment Analysis (GSEA) are among the most common methods. Over-Representation Analysis determines whether differentially expressed genes (DEGs) include proportionately more genes from a specific gene set than would be expected by chance, based on the total number of DEGs, the total number of genes in the gene set, and the total number of genes analysed in the study. 6 While ORA is well-established and widely used, one disadvantage is that it can only be applied to DEGs, and therefore smaller subtle changes across multiple functionally related genes may not be detected. 7 In contrast, GSEA does not rely on DEGs so can be more sensitive to smaller changes in expression. 8 Instead of focusing on only significant genes, all genes are sorted (commonly by fold change) and GSEA evaluates whether genes within a specific gene set are clustered towards the top or bottom of the fold change list, indicating up- or downregulation of the gene set.4,9 -11
Different gene sets can be queried using either ORA or GSEA depending on the database selected. Some of the most common include Gene Ontology (GO), 3 Kyoto Encyclopedia of Genes and Genomes (KEGG), 12 Reactome, 13 Wikipathways 14 and the Molecular Signatures Database (MSigDB). 15 There are also multiple variants of the ORA and GSEA algorithms.16 -18 Several studies have evaluated and compared these methods using either simulated9 -11 or real datasets.17,19 -21 However, with real datasets, it is difficult to be fully confident in expected results, while for simulated data it can be difficult to accurately model gene-gene correlations that may exist within the data. 18
Here, we perform ORA and GSEA on a real dataset consisting entirely of control samples. Samples were pools of zebrafish embryos each of which was exposed to 0.1% dimethyl sulfoxide (DMSO), which is typically used as a vehicle control in toxicology studies. Given that all samples received identical treatments, comparisons between samples should not generate significant results, the rank ordering of the fold changes should be random, and any significant results would be categorized as false-positives. We previously applied differential gene expression analysis and transcriptomic benchmark concentration analysis to these samples, allowing the determination of experimental design parameters that would minimize the frequency of false-positive DEGs, and which could be applied to future toxicogenomic studies using developing zebrafish. 22 Given that toxicological studies commonly include gene set analyses, these same data are analysed herein to establish false-positive rates for both ORA and GSEA across 6 gene set databases. As expected, experimental design parameters that allowed more false-positive DEGs also led to more false-positive results from ORA. Surprisingly, the opposite was observed for GSEA, where simulations that had few or no DEGs were more likely to have false-positive gene sets. Mechanisms that underlie this surprising result are explored. These findings have potential implications for GSEA in any species if applied to datasets containing few or no DEGs.
Methods
Previous sequence data generation and analysis
All analyses used sequence data generated, processed and batch corrected as described in Lee et al 22 (summarized in Supplementary Figure S1). Zebrafish (Danio rerio) maintenance and all experimental procedures were performed in accordance with the Canadian Council on Animal Care at the University of Ottawa (Protocol: BL-3057). 22 Wild-type zebrafish housed in the uOttawa Aquatics Facility colony were bred to generate embryos for the study, with embryos exposed to 0.1% DMSO from 4 to 120 hours postfertilization, an exposure paradigm commonly used in chemical toxicity testing of early zebrafish embryos.23,24 Following exposure, embryos were randomly combined into pools of 1, 5, 10 or 20 embryos (designated P01, P05, P10, P20), with 24 biologically distinct pools for each of the 4 pool sizes (96 samples in total). All embryos were anesthetized by exposure to rapid cooling on ice for 10 minutes25,26 and were immediately preserved in RNAlater Stabilization Solution (Thermo Fisher Scientific, Waltham, MA, USA).
Total RNA was extracted by RNeasy mini kits (Qiagen, Toronto, Canada) and quantified using a Qubit 4 Fluorometer (Invitrogen, Thermo Fisher Scientific, Waltham, USA), with RNA integrity numbers (RIN) measured using an Agilent 4150 TapeStation system (Agilent Technologies, Inc., Santa Clara, CA, USA). Extracted RNA was used to generate RNA libraries for sequencing with a 96-sample TempO-Seq S1500+Zebrafish Surrogate Assay panel (BioSpyder Technologies, Carlsbad, CA, USA), containing 3183 probes that detect 3112 different genes. Libraries were sequenced on an Illumina NextSeq 2000 sequencer (Illumina Inc., San Diego, CA, USA). Sequencing data are available from the National Centre for Biotechnology Information (NCBI) Gene Expression Omnibus (GEO) database (Accession no. GSE230213).
Raw sequence data were processed into count data using the Omics data analysis framework for regulatory application (R-ODAF) pipeline,27,28 which includes several standard quality control metrics that consider correlations between samples, the total number of reads, the proportion of reads that are successfully aligned, and the distribution of reads between different probes (screening for both under- and overrepresentation of reads across individual probes). All samples passed all quality control filters.
To characterize the frequency of false-positive DEGs, multiple samples sharing the same pool size (either P01, P05, P10, or P20) were selected at random without replacement to generate 2 groups for comparison. For each pool size, the sample size varied from n = 3 to n = 10, with DEG analysis performed on 1000 simulations per sample size, resulting in 8000 simulations per pool size and 32000 simulations in total. 22 DEGs were then identified from each simulation using DESeq2. 29 DEGs were defined by P value < 0.05 following Benjamini-Hochberg false discovery rate correction, 30 and an absolute linear fold change of >1.5 (log2FC > 0.58) following fold change shrinkage using the ashr R package. 31 Results from these 32000 simulations were then subject to gene set analysis using Over-Representation Analysis (ORA) and Gene Set Enrichment Analysis (GSEA) as described below. All analyses were performed using R version 4.3.0.
Over-Representation Analysis
Over-Representation Analysis compares the number of genes that are/are not classified as DEGs against the number of genes that are/are not classified as members of a specific gene set, to determine whether DEGs are overrepresented in each gene set. 6 While there are various implementations of ORA, 20 we used the clusterProfiler R package (version 4.9.1), which calculates the significance of the enrichment using a hypergeometric distribution. 5 Significantly enriched gene sets were defined using a P value of <0.05 (after Benjamini-Hochberg correction) 30 and a q-value of <0.05. 32 DEGs from each of the 32000 simulations were queried against a background of all 3112 genes represented by the TempO-Seq array, with EntrezID used to query all gene set databases. To ensure a comprehensive analysis across multiple databases, ORA was run using the Gene Ontology Biological Processes (GO-BP), Molecular Function (GO-MF), and Cellular Component (GO-CC) databases 3 (release date 2023-06-11), the Wikipathways database 14 (release date 2023-06-10), the Kyoto Encyclopaedia of Genes and Genomes (KEGG) database 12 (release version 106.0), and the Reactome database 13 (release version 85). Analyses used the clusterProfiler functions enrichGO(), enrichWP(), enrichKEGG() and enricher(), respectively. 5 ORA can only be performed if there are DEGs. For simulations that did not have DEGs, the number of significant gene sets from ORA was therefore set at 0.
Gene Set Enrichment Analysis
Gene Set Enrichment Analysis (GSEA) was initially performed with the fast GSEA (fgsea) algorithm from the clusterProfiler R package. 5 GSEA is not dependent on DEGs, and instead uses information from every probe in the dataset. 4 To generate inputs for GSEA, all probe sets analysed by DESeq2 29 (irrespective of significance) were converted to their Entrez gene ID and associated with their log2 fold change estimated from the DESeq2 statistical model, followed by fold change shrinkage using the ashr R package. 31 Entrez gene IDs were ranked by fold change. Where 1 Entrez gene ID was represented by multiple probes, only the single largest fold change was selected, and duplicate IDs were removed. For each gene set, GSEA screens for genes that are clustered near the top or the bottom of the ranked list, with the extent of clustering reflected by the calculated enrichment score (ES). This score is a Kolmogorov-Smirnov-like statistic, for which the P value is obtained through permutation analysis. The clusterProfiler 5 fgsea algorithm was run with all the default settings, except for the maximal size of genes annotated for testing (maxGSSize) which was set as the number of input genes minus 1. 33 fgsea was run with the same databases as were used for ORA, using the clusterProfiler gseGO() (for gene ontology), gseWP() (for Wikipathways), gseKEGG() (for KEGG) and GSEA() (for Reactome) functions. Significant enrichment was defined by P < 0.05 following Benjamini-Hochberg false discovery correction. 30 For KEGG fgsea, analyses were repeated using standardized fold changes as the ranking statistic, calculated by dividing log2 fold change by the standard error of the log2 fold change estimated from the DESeq2 model. 29
We further explored GSEA using the Coincident Extreme Ranks in Numerical Observations (CERNO) GSEA algorithm. 34 CERNO was implemented with default settings through the tmod R package, 34 using zebrafish KEGG gene sets obtained as a subset of MSigDB as detailed in the tmod package vignette. 34 CERNO was first used in combination with log2FC and standardized log2FC ranking statistics calculated through DESeq2 modelling, as had been used with fgsea. In addition, 9 further ranking statistics were explored using CERNO, based on analyses described in Zyla et al 17 Specifically, analysis was performed with the Baumgartner-Weiss-Schindler (BWS), the Difference, the Minimum Significant Difference (MSD), the Moderated Welch Test statistic (MWT) and Absolute MWT, the Ratio, the Signal-To-Noise ratio (S2N) and Absolute S2N, and the t statistic as ranking statistics (see Zyla et al17 for references). A custom code written in R was used to generate all ranking statistics for each of the 32000 simulations, based on the count matrix generated through the R-ODAF pipeline. In contrast to log2FC and standardized log2FC, these 9 ranking statistics were not generated as part of the DESeq2 statistical model and therefore did not include any batch-effect corrections.
Data wrangling
Results of ORA and GSEA were analysed using custom code written in R, with extensive use of tidyverse functions. 35 Pearson’s Chi-square test (uncorrected for multiple hypothesis testing) was used to determine whether the ratio of upregulated to downregulated genes within each gene set deviated significantly from the expected 1:1 ratio. For the identification of individual samples that were classified as outliers for each gene, raw count data generated by R-ODAF processing 27 were transformed to counts per million (CPM) using the edgeR package. 36 Outliers were defined separately for each gene as samples with expression levels more than 3 standard deviations from the mean of the log2-transformed CPM.
Results
Previously, DEG analysis was performed on 32000 simulations using vehicle-treated samples: 1000 simulations for every combination of pool size (pools of P01, P05, P10 and P20 embryos) and sample size (from n = 3 to n = 10) (summarized in Supplementary Figure S1). Samples for each simulation were randomly selected from among the 24 samples of each pool size. DEGs were defined as any probe with P value < 0.05 (following Benjamini-Hochberg false discovery rate correction) and an absolute linear fold change of >1.5 (log2FC > 0.58). All comparisons were between control samples and therefore any DEG identified is a false-positive. As expected, the number of DEGs decreased as pool size and sample size increased. 22 Larger pool and sample sizes reduce variability in the data; this reduction in variability likely smooths the data and contributes to the decrease in the false-positive DEGs.
We hypothesized that the false-positive DEGs identified would represent random variability in gene expression and would not be reproducibly associated with the enrichment of specific gene sets. We also hypothesized that larger sample and pool sizes would reduce the probability of detecting overrepresented and enriched gene sets. To test these hypotheses, the outputs from each of the 32000 simulations were subjected to gene set analysis through ORA and GSEA using the clusterProfiler R package 5 and 6 different gene set databases; Gene Ontology Biological Process (GO-BP), Molecular Function (GO-MF), Cellular Component (GO-CC), 3 Wikipathways, 14 Kyoto Encyclopaedia of Genes and Genomes (KEGG) 12 and Reactome. 13
ORA and GSEA false-positive results
We found that DEGs derived from most simulations generated 0 false-positive enriched gene sets using ORA (Figure 1A). The number of false-positives was highest for simulations with small sample sizes and small pool sizes. This was expected as these simulations also generated more DEGs, and ORA requires DEGs as the input. In contrast, for GSEA using the fgsea algorithm, the number of simulations generating false-positives increased as pool size and sample size increased (Figure 1B). To illustrate, across the 8000 simulations using P20 pools, 7090 (88.6%) generated 0 DEGs, 22 7808 (97.6%) generated 0 significant gene sets using ORA with the GO-CC database (Figure 1A, top right), but only 2208 simulations (27.6%) generated 0 significant gene sets through GSEA with GO-CC (Figure 1B, top right). This was entirely unexpected and counter-intuitive, as the experimental parameters that reduced the number of false-positive DEG and ORA results increased the number of false-positive GSEA-enriched gene sets. When simulations that generated exactly 0 DEGs were excluded this unexpected result disappeared, and the results mirrored those obtained by DEG analysis and ORA (Supplementary Figure S2). These patterns of false-positive results from ORA and GSEA were consistent across all 6 databases (Figure 1). While there was considerable variation between databases in the absolute number of significantly enriched terms, this likely reflects differences in the total number of annotated terms within each database (eg, the zebrafish Wikipathways v2023.06.10 database contains only 46 gene sets).
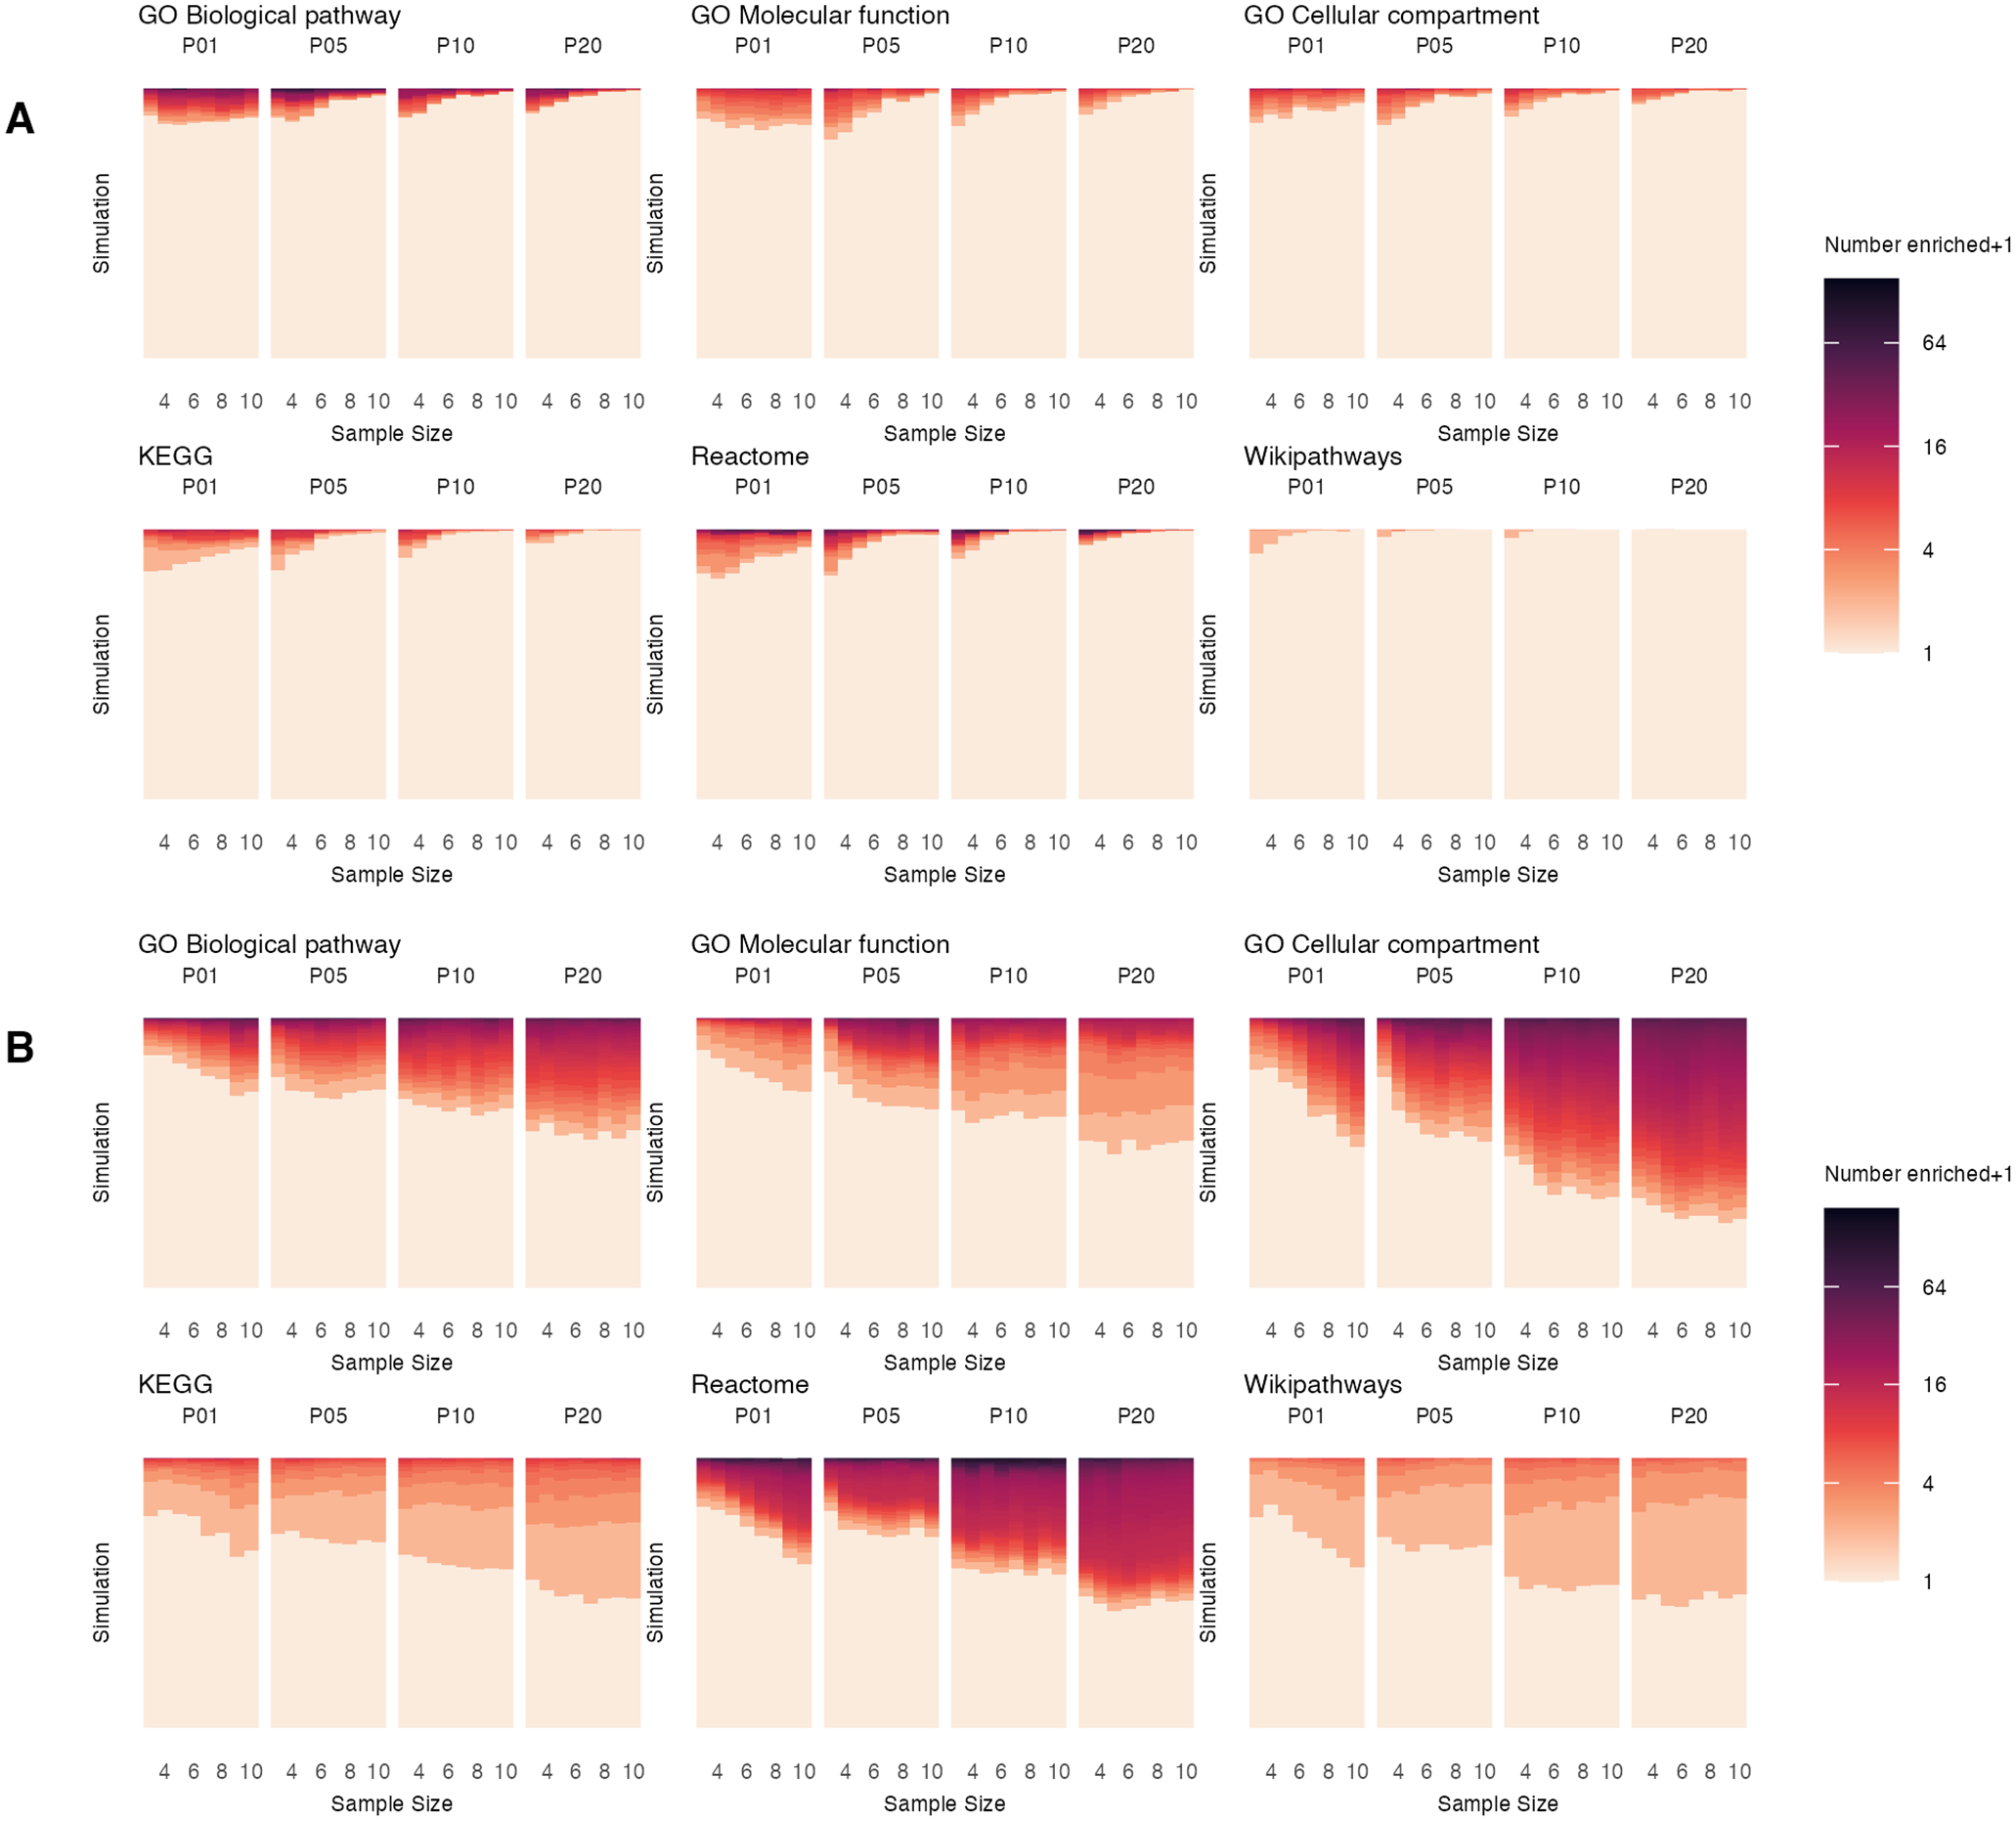
Distribution of the number of significantly enriched gene sets per simulation for ORA and GSEA. ORA (A) and GSEA (B) were run on the results of DEG analysis for each of the 1000 simulations for every combination of pool size (pools of P01, P05, P10 and P20 embryos) and sample size (n = 3 to n = 10). The number of significantly enriched terms for each of the 1000 simulations is indicated by colour (with + 1 added to accommodate the log2 scale).
Gene Set Enrichment Analysis inputs consisted of Entrez gene IDs ranked by log2 fold change (log2FC), estimated through DESeq2 modelling followed by fold change shrinkage using the ashr R package.29,31 The GSEA ES may be skewed by unusually large values of log2FC for a small number of genes, leading to higher ES values even in datasets with minimal overall signal. While the effect of unusually large log2FC would have been reduced by our application of fold change shrinkage, we sought to further guard against unusually large log2FC values by repeating GSEA with standardized log2FC (dividing log2FC by the standard error of the log2FC). The use of standardized log2FC inputs did not reduce the number of GSEA false-positive results (data not shown).
While experimental conditions that produced fewer false-positive DEGs or ORA results increased the frequency of false-positive results from GSEA, the number of DEGs from a single simulation was not predictive of the number of false-positive enriched gene sets by either ORA or GSEA within that simulation (Supplementary Figure S3). For both ORA and GSEA, simulations with large numbers of DEGs did not translate to a larger number of false-positive enriched gene sets. Indeed, most simulations generated 0 false-positive enriched gene sets for both ORA and GSEA, irrespective of whether the simulation had small or large numbers of DEGs. For example, 132 out of 32000 simulations generated more than 200 DEGs. More than 50% of these simulations generated 0 false-positive enriched gene sets for every database using either ORA or GSEA. Similarly, simulations that generated the largest number of false-positive enriched gene sets had relatively few DEGs, for both ORA and GSEA analyses (Supplementary Figure S4). Therefore, while experimental parameters that generated larger numbers of DEGs generated more false-positive results by ORA and fewer by GSEA (Supplementary Figure S3), larger numbers of DEGs were not themselves associated with larger numbers of enriched gene sets through either ORA or GSEA (Supplementary Figure S4).
Identities of false-positive enriched gene sets
We hypothesized that if false-positive enriched gene sets arise through an entirely random process, the identities of enriched gene sets would similarly be expected to be random. However, our data do not support this hypothesis. Indeed, some gene sets were very highly represented among false-positive results for both ORA (Supplementary Figure S5) and GSEA (Figure 2). This was most apparent for GSEA, where gene sets related to the ribosome were particularly overrepresented (Figure 2). For example, 8504 out of 32000 simulations (26.6%) were significantly enriched for the Cytoplasmic ribosomal proteins gene set from the Wikipathways database, 6743 simulations (21.1%) detected the Ribosome gene set in the GO-CC database, and 6203 simulations (19.4%) detected the Ribosome gene set from the KEGG database. For the remaining 3 databases (GO-BP, GO-MF, Reactome), the most frequently detected gene sets were similarly related to translation, suggesting detection of the same underlying signal in the data.
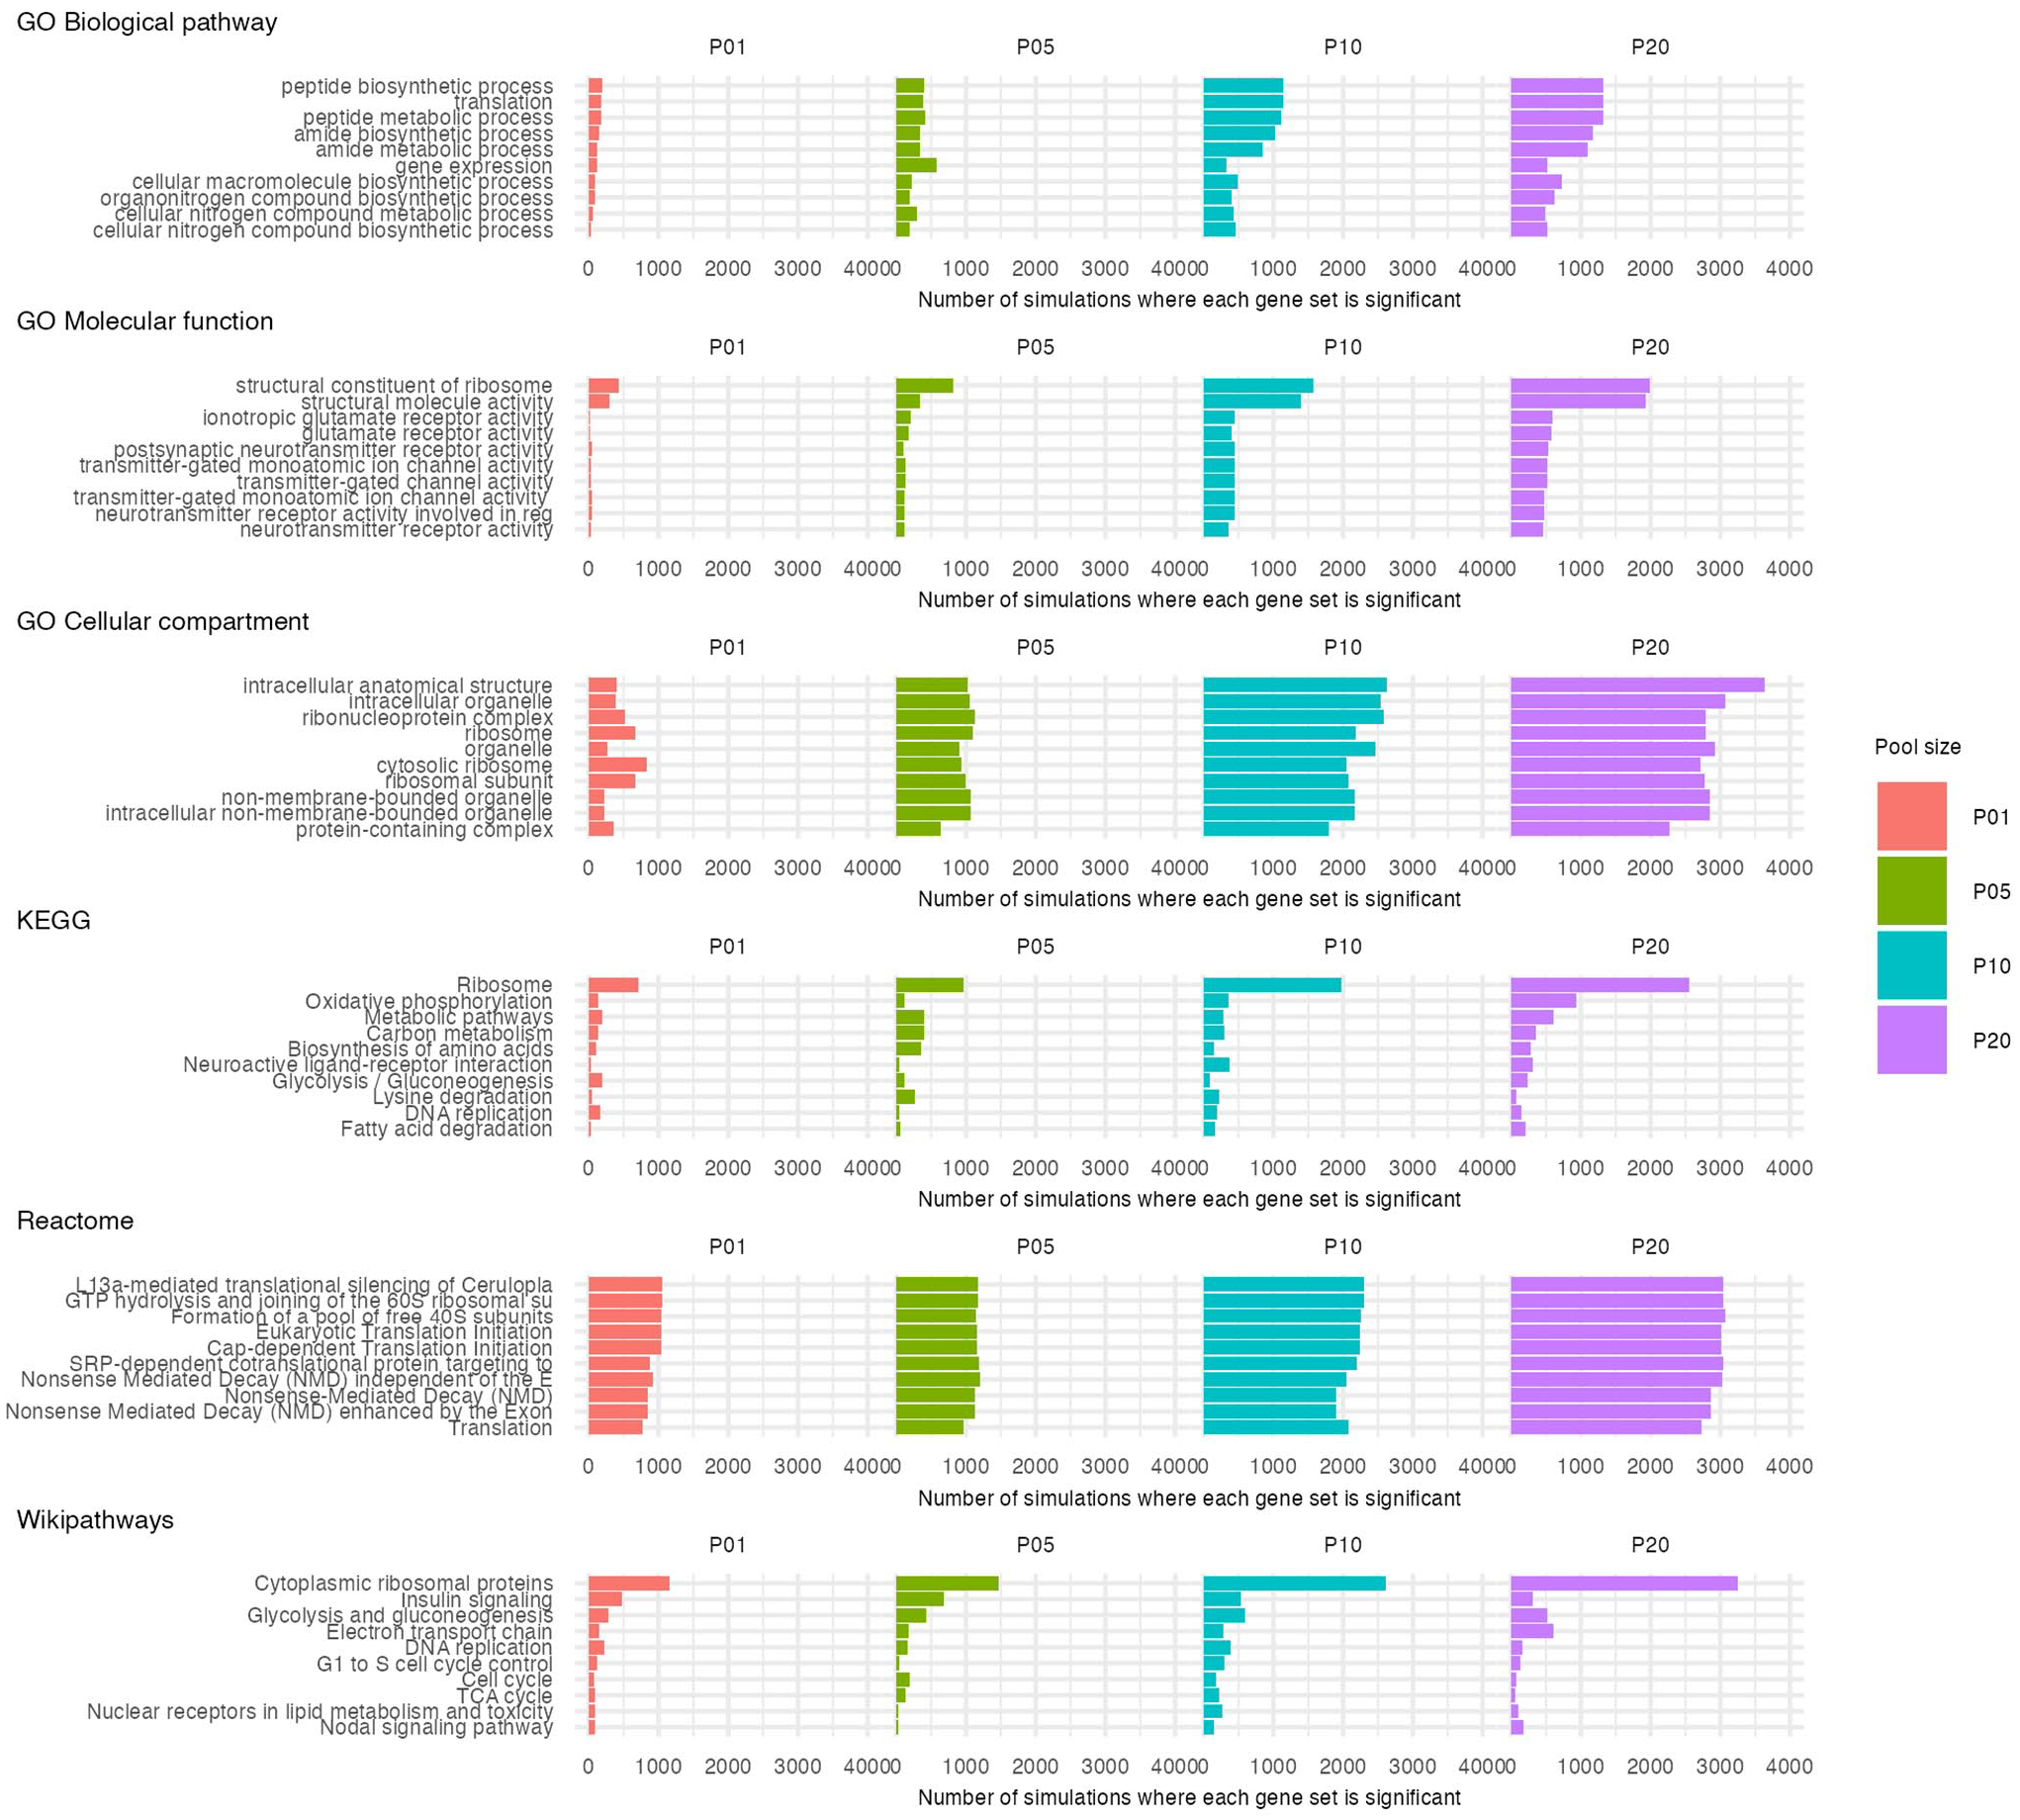
Most common significantly enriched gene sets from GSEA. The 10 most frequently enriched gene sets collated across all 32000 iterations of GSEA are shown for each database, separated by pool size. Names of gene sets with long names have been truncated.
As described above, simulations with exactly 0 DEGs underlie the increase in false-positive GSEA results that we observed with larger pool and sample sizes (Supplementary Figure S2); thus, we compared the identities of false-positive gene sets between 0-DEG and >0 DEG simulations. There was no clear distinction between the gene sets detected by these 2 sets of simulations (data not shown). Critically, ribosomal gene sets were the most common false-positive results in 0-DEG and >0 DEG simulations across all 4 pool sizes. Each pool size consists of different samples, thereby effectively replicating the enrichment across 4 distinct datasets. While the number of false-positive gene sets from ORA was much lower than for GSEA, ribosomal gene sets nevertheless were the most common gene sets for both the Wikipathways and GO-CC databases. Potential mechanisms that may contribute to these false-positive GSEA results are explored below. For simplicity, subsequent analyses will be restricted to GSEA using the KEGG database.
GSEA false-positives due to a consistent direction of fold change
Biological coregulation between genes leads to correlated expression between genes. For example, if multiple genes within a gene set contribute structurally to a single organelle, those genes will likely be positively correlated. This contrasts with other gene sets where activation of the pathway could involve upregulation of some genes and downregulation of other genes, depending on whether they have positive or negative effects within the pathway. The ribosome is a prime example of a gene set for which genes would likely be positively correlated biologically. 37 Even in the absence of any treatment, random differences in expression may exist between groups. These random differences would be shared across multiple genes within the gene set due to their biological coregulation and therefore correlation. We thus hypothesize that we may detect a signal by GSEA in our dataset when there are very low levels of background noise; in our solvent-treated zebrafish embryo contrasts, this is expected from comparisons involving either large pool sizes or large sample sizes, which are indeed the conditions under which we see the most GSEA false-positives.
This hypothesis predicts that genes within the ribosomal gene set would be either mostly up-regulated or mostly downregulated within a given contrast, which is testable using a simple Chi-square test against the null hypothesis of a 1:1 ratio of up- to downregulated genes (Figure 3). As predicted, ribosomal gene sets deviated significantly from the 1:1 ratio, with significance obtained for >50% of all simulations involving P10 and P20 pools. While deviation from the 1:1 ratio was most apparent for ribosomal gene sets, similar deviation was also detected for other gene sets, most notably oxidative phosphorylation (Figure 3).
Gene sets with significant deviations from a 1:1 ratio of upregulated to downregulated genes. For each gene set from the KEGG database, the number of upregulated and downregulated genes were tested for significant deviation from a 1:1 ratio using a Chi-square test. Across the 1000 simulations for each combination of pool and sample size, the total number of simulations with a significant Chi-square result was counted for each gene set and plotted. Six gene sets highlighted in the text are emphasized and labelled.
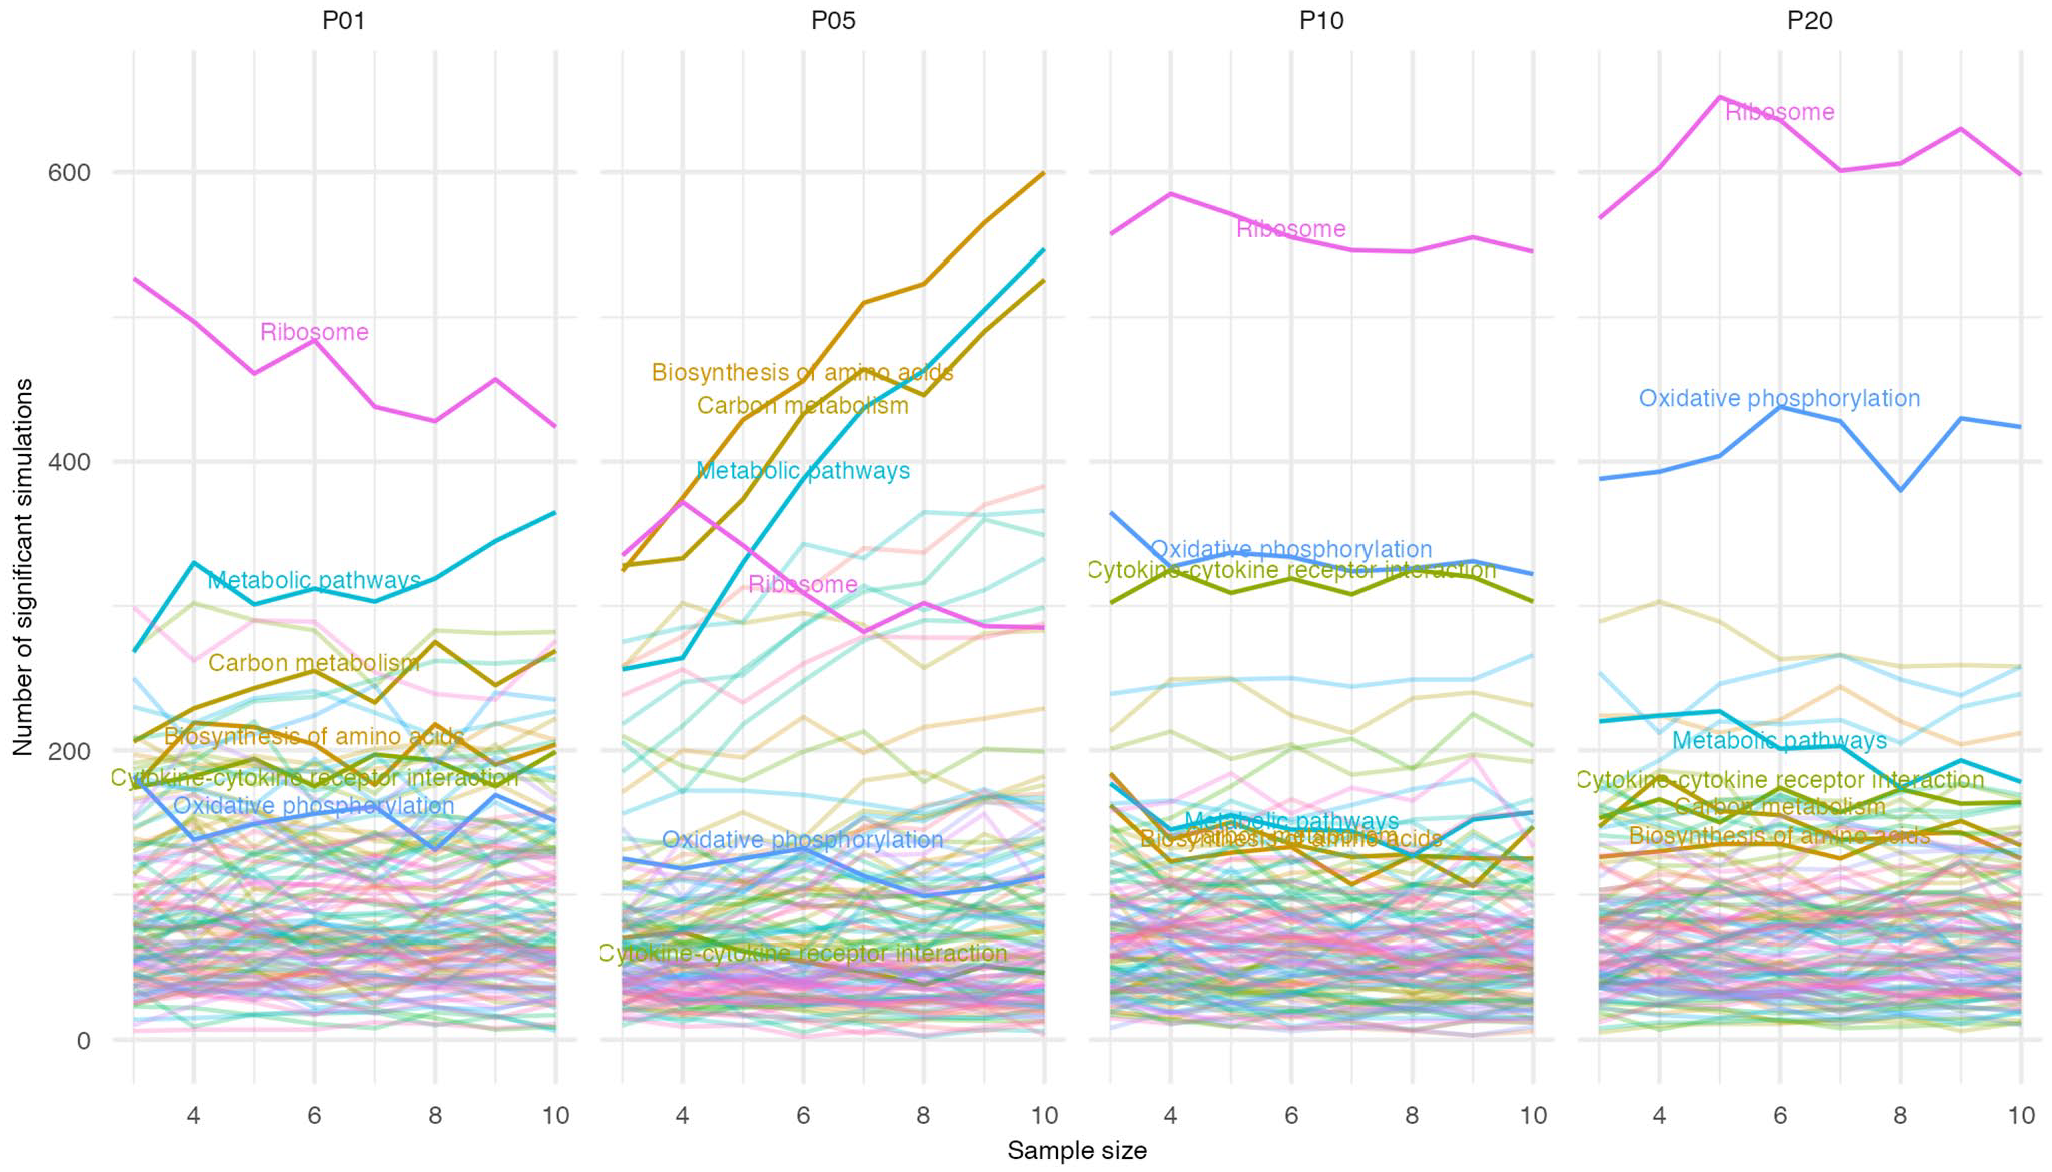
GSEA false-positives due to a single outlier sample
Simulations involving P05 pools showed considerably fewer instances where ribosomal gene sets differed from the 1:1 ratio, compared with P01, P10 and P20 pools (Figure 3). While Ribosome remains the most commonly enriched gene set (Figure 2), among the P05 pools there is a relatively high frequency of 3 additional gene sets (Biosynthesis of amino acids, Carbon metabolism, and Metabolic pathways) (Figure 2), each of which deviates from the 1:1 ratio more prominently than the Ribosome (Figure 3). In contrast to either ribosome or oxidative phosphorylation gene sets, the number of simulations that deviated from the 1:1 ratio increased with the sample size for the 3 P05 gene sets (Figure 3). This suggests a distinct and pool-specific mechanism contributing to false-positives through these gene sets in P05 samples.
We hypothesized that the sample-size dependent increase in deviation from the 1:1 ratio could be caused by a single sample if it was an outlier for several genes within a specific gene-set. Each contrast compared 2 groups sampled at random from among 24 different samples. If n = 3, only 6 of 24 samples would be used for a given simulation so the probability of including any 1 specific sample would be low (25%). However, if n = 10, the probability of 1 specific sample being incorporated into one of the groups increases to 83%. If this 1 sample is responsible for driving the deviation from the 1:1 ratio, the number of simulations deviating from the 1:1 ratio would therefore increase with sample size, as is observed (Figure 3).
Importantly, as described in the original publication of these data, 22 no sample had been identified as a potential outlier by either principal components analysis 22 or by any formal cheques for outlier identification that are used as standard within the R-ODAF analysis pipeline.27,28 These quality control measures considered the combined expression of all genes from the sample. To test our hypothesis that the sample-size dependent increase in deviation from the 1:1 ratio could be caused by a single sample if it was an outlier for several genes within a specific gene-set, each gene was analysed individually to identify potential outlying samples. Samples defined as outliers for a particular gene had log2 counts per million for the gene that were more than 3 standard deviations from the pool mean. For each gene set, the proportion of genes for which each sample was classified as an outlier is shown in Figure 4. As hypothesized, P05 included a single sample (named S14) that was classified as an outlier for 20% to 40% of genes within most gene sets, despite the overall sample having passed all quality-control checks. 28 Every other sample in every other pool had a much lower proportion of outlier calls, consistent with the above hypothesis of the origin of the sample size-dependent increases for P05 samples observed in Figure 3. It is less clear why sample size-dependent increases are particularly prominent for the Biosynthesis of amino acids, Carbon metabolism, and Metabolic pathways gene sets. However, it is of note that unlike most gene sets (Figure 4), not only is sample S14 an outlier for more than 20% of genes, but none of the other samples appear to have any outliers for any other genes. If 2 samples had both been classed as outliers for a subset of genes, those 2 samples could have appeared in the same group within a simulation or in opposing groups, and either scenario could have made the impact of the single outlier sample on the 1:1 ratio less clear.

Proportion of genes within each KEGG gene set for which each sample was classed as an outlier. Each spot on the plot represents 1 sample. The y-axis describes which gene set is being analysed. For each sample, the proportion of genes for which the sample was considered an outlier is shown (x-axis). An outlier is defined as a sample for which the expression of a given gene is more than 3 standard deviations from the mean of the pool for that gene (measured as log2 counts per million). For example, if there are 10 genes in a gene set, and the sample had 2 genes that deviated from the pool mean by >3 standard deviations, the proportion shown would be 0.2. Note that most points overlap with proportions at or near 0. One sample (S14) was an outlier for an unusually large proportion of genes in many gene sets. All data from this sample are shown in red. Three gene sets for P05 showed a particularly prominent sample-size-dependent deviation from an expected 1:1 ratio of up to downregulation of genes (see Figure 3), and are highlighted by blue boxes. Results are only shown for gene sets with >25 genes represented on the TempO-Seq array, with the gene sets containing the most genes shown at the top.
To confirm that this 1 sample caused the sample-size dependent deviation from the 1:1 ratio observed in Figure 3, DEG analyses were re-run for 1000 new simulations for each sample size from n = 3 to n = 10 for P05 samples, with and without S14 included in the data. Elimination of the S14 sample removed the sample size-dependent increase in the number of simulations differing from the 1:1 ratio for any gene set (Figure 5). Furthermore, the gene set that deviated most from the 1:1 ratio was the ribosome, similar to P01, P10 and P20 samples. The unusual results associated with P05 (Figure 3) were therefore eliminated by the exclusion of a single sample. This highlights how a single sample can potentially generate false-positive results in GSEA under conditions where there are no DEGs.
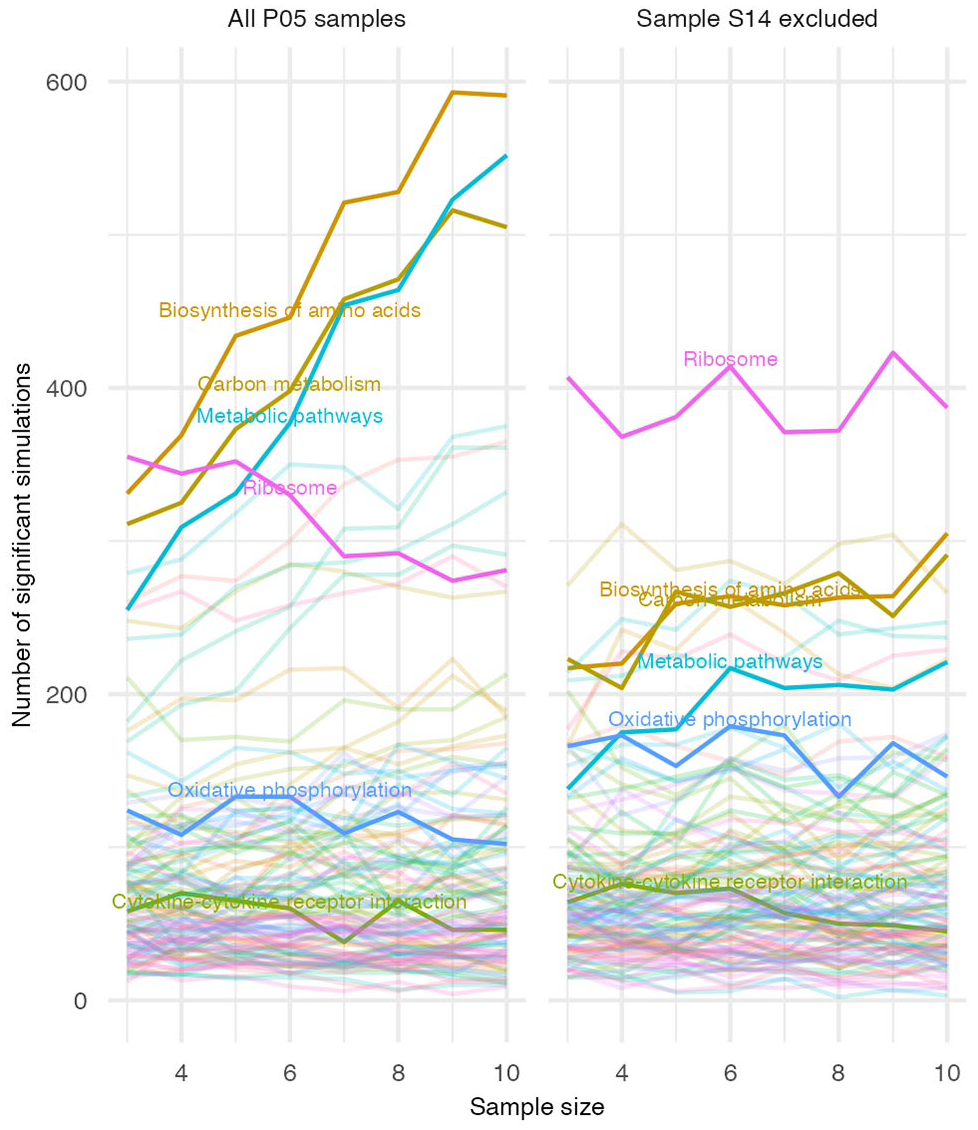
Gene sets with significant deviation from a 1:1 ratio of upregulated to downregulated genes in P05 samples, with and without inclusion of sample S14. Analyses described in Figure 3 are here repeated for new DEG simulations using P05 samples only, either including or excluding sample S14, identified as an outlier in the expression of many genes.
Impact of GSEA algorithm and ranking statistic on false-positive results
To determine whether the surprisingly high frequency of GSEA false-positive results could be an artefact associated with the specific GSEA algorithm implementation (fgsea from clusterProfiler) 5 and the specific choice of ranking statistic (standardized or unstandardized log2FC generated through DESeq2 modelling), we extended our analyses to 1 additional GSEA algorithm, and 9 additional ranking statistics, limiting our analyses to the KEGG database. The Coincident Extreme Ranks in Numerical Observations (CERNO) GSEA algorithm 34 is a useful comparator as analyses are based on only the ranks of probe sets (as opposed to both the ranks and numerical values associated with probe sets used by fgsea), making CERNO more robust to the ranking metric selected. In comparison with fgsea, CERNO did reduce the overall number of false-positive results from 24789 to 16486 (combined across all 32000 simulations) when log2FC was used as a ranking statistic, and from 29757 to 20286 when genes were ranked by standardized log2FC (Figure 6A). Despite this reduction, the overall characteristics of false-positives were similar for both GSEA algorithms, with the total number of significant gene sets highest for larger pool sizes (Supplementary Figure S6A), and the 2 most commonly-observed significant gene sets being ribosome and oxidative phosphorylation (Supplementary Figure S7A).
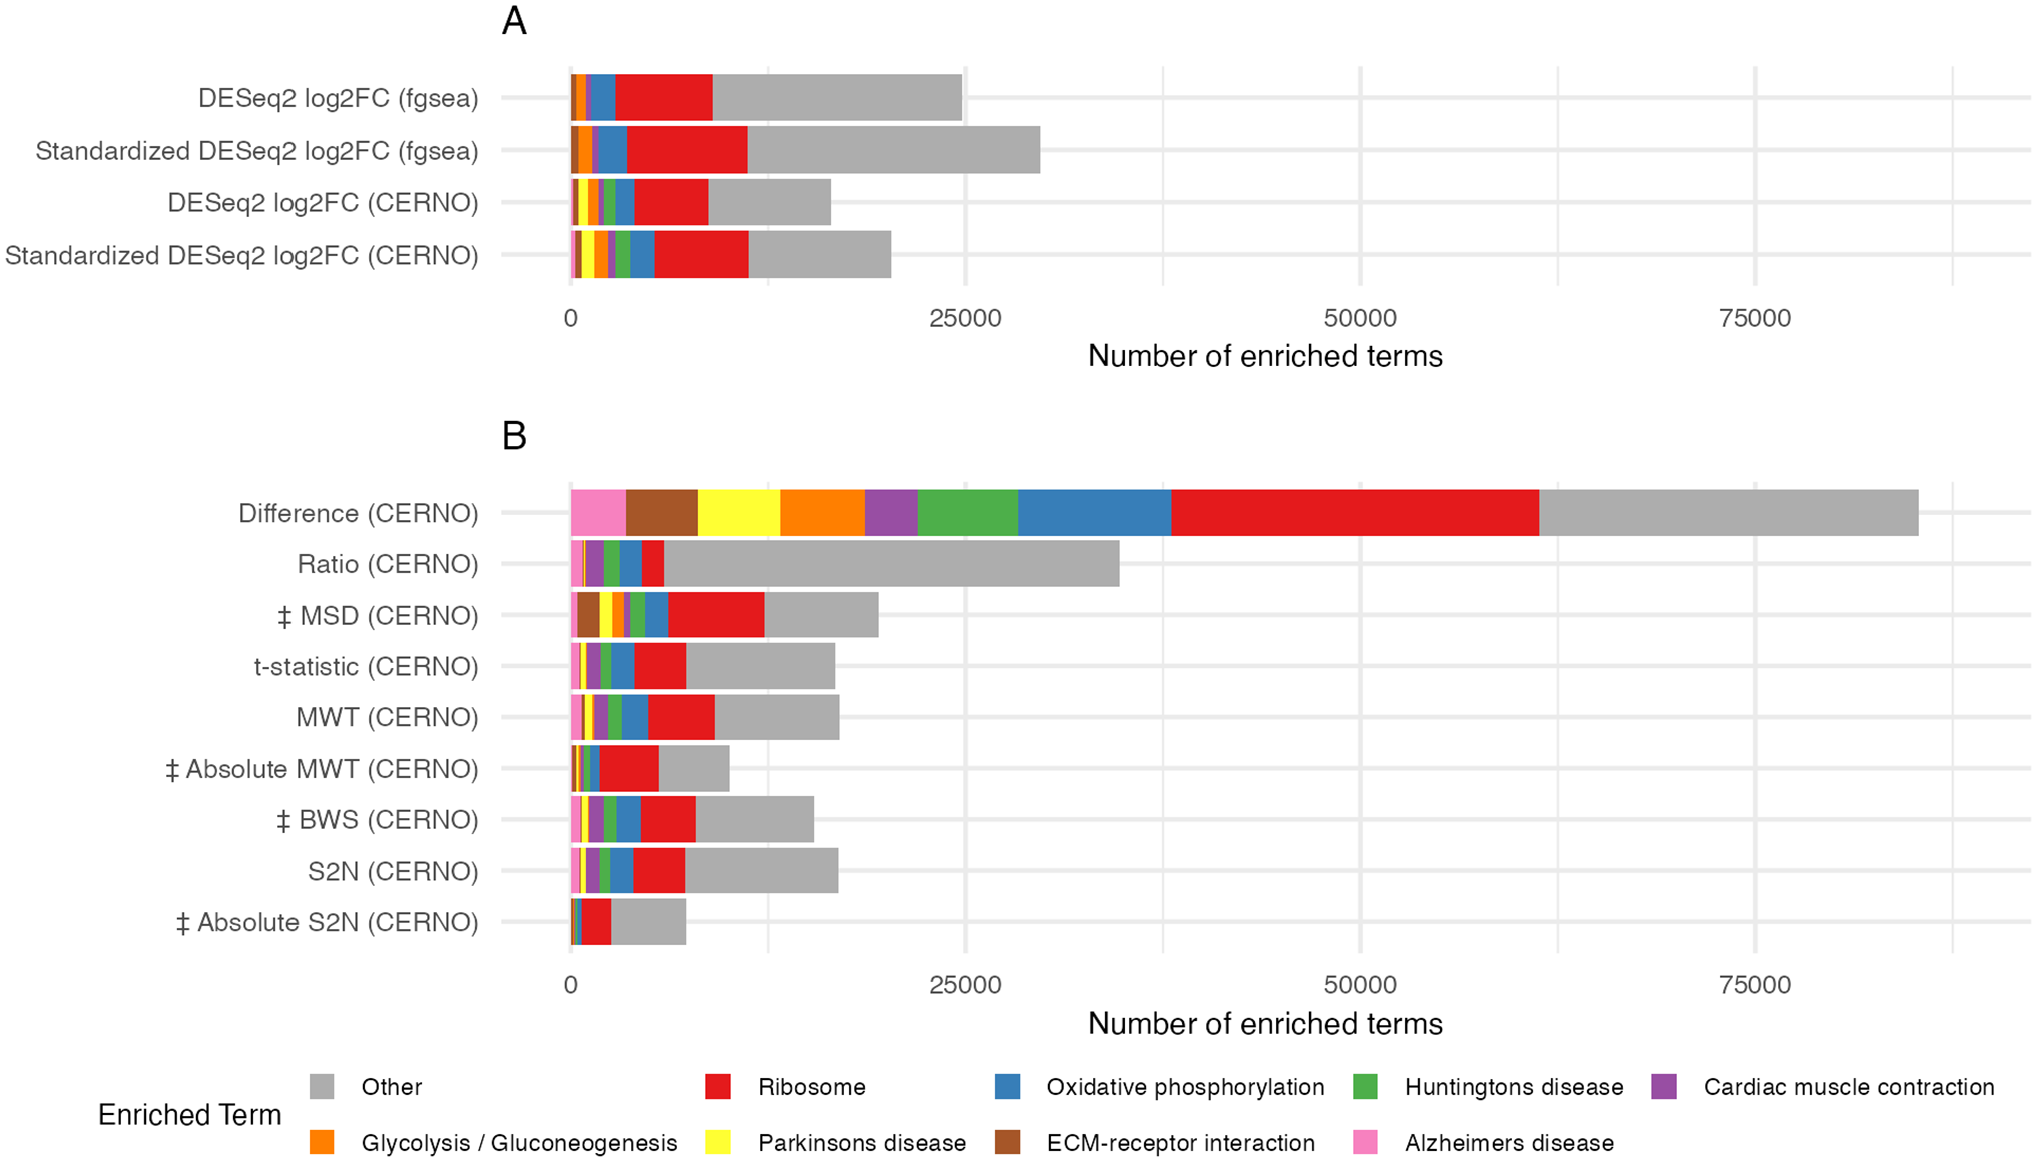
Impact of GSEA algorithm and ranking statistic on the total number of significantly enriched gene sets. The total number of significantly enriched gene sets combined across all 32000 simulations is shown for 13 different combinations of GSEA algorithm and ranking statistic. The 8 gene sets detected with the highest frequency across all 13 analyses are colorized with all other gene sets combined into the category ‘Other’.
Following the analysis by Zyla et al, 17 9 additional ranking statistics were applied to GSEA using CERNO, including the 4 statistics identified by Zyla et al 17 as having the greatest sensitivity, namely, the absolute Moderated Welch Test statistic (Absolute MWT), absolute signal-to-noise ratio (Absolute S2N), BWS and MSD, plus the MWT, S2N, Difference, Ratio and t statistic (see Zyla et al 17 for references). The Absolute S2N and Absolute MWT ranking statistics resulted in the fewest overall false-positives (7326 and 10040, respectively) (Figure 6B). Nevertheless, even for these ranking statistics the frequency of false-positives increased with pool size (Supplementary Figure S6B), and ribosome and oxidative phosphorylation remained the 2 most commonly enriched terms (Supplementary Figure S7B). The Difference and Ratio ranking statistics performed particularly poorly. The Difference statistic (calculated as the difference between the 2 group means) had a very high frequency of false-positives across all pool and sample sizes (Figure 6B, Supplementary Figure S6B). Nevertheless, the ribosome and oxidative phosphorylation gene sets remained the 2 most commonly-identified gene sets using the Difference statistics, and across all other ranking statistics with the exception of the Ratio (calculated as the simple ratio between the group means). It is perhaps unsurprising that the Difference and Ratio ranking statistics performed particularly poorly given that, unlike all other ranking statistics, they were calculated based solely on group means, without the inclusion of any measures of within-group variability.
Discussion
ORA and GSEA were applied to zebrafish embryo gene expression data derived from 32000 simulations each composed of 2 mock experimental groups of n = 3 to n = 10 across 4 pool sizes. All embryos had been exposed to the same treatment, so any significantly enriched gene sets can be classed as false-positives. Large pool and sample sizes were associated with fewer DEGs, fewer significantly enriched gene sets from ORA, but more significantly enriched gene sets from GSEA. Gene Set Enrichment Analysis false-positives were most likely from simulations with exactly 0 DEGs. The most common enriched gene sets were associated with the ribosome. This high frequency of GSEA false-positives (particularly where pool sizes were large) was observed across 2 different GSEA algorithms, and 11 different ranking statistics.
It is instructive to frame GSEA in the context of a signal-to-noise ratio, where (1) a strong signal consists of large, uniform fold changes across many genes within the gene set and (2) low noise indicates that all genes outside the specific gene set have very stable expression resulting in minimal fold change. This study likely has unusually low noise as the data compare only control samples. Noise is expected to be particularly low where sample size and pool size are both large, especially where simulations also generate exactly 0 DEGs. These are the precise conditions under which we observed the most false-positive GSEA results. Under these conditions, noise would be at a minimum allowing a signal of even small magnitude to be potentially detectable.
If expression of genes within a gene set is tightly co-regulated (resulting in gene-gene correlations within gene sets), and there is very low background noise, small biologically real but random differences between groups in any gene within the gene set would likely be reflected across many genes within the gene set, generating a signature that would be detectable through GSEA. Tight co-regulation is a characteristic of ribosomal genes,38 -40 including during zebrafish development. 41 Ribosomal genes are also highly expressed in most tissues 39 increasing the accuracy with which gene expression can be quantified. These conditions make ribosomal gene sets prime candidates for generating false-positives through GSEA, as observed in this study. After the ribosome, the second most frequently detected gene set from the KEGG database was oxidative phosphorylation, for which genes were also consistently upregulated or downregulated in many simulations using both P10 and P20 pools. As with the ribosome, oxidative phosphorylation genes may be particularly closely co-regulated, as many of its components are regulated by the PCG1A transcription factor.8,42 -44 Random differences between groups in either of these gene sets (due for example to small differences in developmental age or tissue composition for ribosomal gene sets, or oxygen consumption rate for oxidative phosphorylation gene sets) 45 would therefore be reflected across most genes within the gene set. This random difference could then be detectable through GSEA, providing that fold changes were minimal for all other genes examined (low background noise).
A second mechanism generating false-positive GSEA results was identified in P05 samples, where false-positives were due to a single sample being an outlier for multiple genes within many gene sets. This 1 sample was sufficient to alter fold changes between contrast groups for multiple genes within the gene set, generating a GSEA false-positive. In contrast to the first mechanism identified for GSEA false-positives, the identity of the enriched gene sets from this second mechanism is likely to be more random, depending on the number of genes within each gene set for which the sample is an outlier (and whether the sample is an outlier with the same direction of fold change across different genes). For both mechanisms, the frequency of false-positive results is expected to increase as the level of background noise decreases. Importantly, the P05 sample responsible for generating false-positive GSEA results had not been previously identified as an outlier, having passed a series of quality control metrics that were standard for the R-ODAF pipeline.22,27
The current dataset is unusual as we compare samples that have been exposed to identical treatments, and therefore no difference between groups is expected. The level of noise in GSEA is likely to be unusually low, and it is against this low-noise background that the above mechanisms for generating false-positive results are apparent. Nevertheless, this study does have important implications for the wider use of GSEA. One advantage of GSEA compared with ORA is that, unlike ORA, GSEA can be applied in the absence of significant DEGs.17 -20 However, our results indicate that it is under precisely these circumstances that false-positive results are most likely to occur from GSEA. Furthermore, given that these false-positive results (at least in the case of the ribosomal gene set) reflect coordinated gene expression, it would be entirely plausible to replicate these findings across multiple datasets (as ribosomes were detected in this study independently in each of the 4 pools). The 1 inconsistency that could indicate that the result is a false-positives would be if the direction of fold change differed between replications.
An important limitation of this study is that, by exclusively using control samples, we can only explore the frequencies of false-positive results and cannot therefore make any statements about sensitivity, or statistical power to detect true-positive results. We are also limiting our analyses to a single data set from a single species. Future work will explore questions of statistical power in zebrafish and in other species.
Finally, throughout this study, we have consistently used the term ‘false-positive’ to describe statistically significant enriched gene sets. This is justified given that there are no treatment differences between any samples in the study, therefore no differences are expected between any groups. However, the consistent detection of ribosomal gene sets across all 4 pools strongly implies that GSEA is detecting true but random biological differences between groups. The term ‘false-positive’ may therefore be misleading. Instead, the significant results highlight the extreme sensitivity of GSEA, where it can detect small, random, but biologically real differences between groups across multiple coordinately expressed genes within a gene set, against a background of high stability of expression of most other genes.
Conclusion
An advantage of GSEA over ORA is that it can be applied in the absence of DEGs. However, our results indicate that these are the conditions under which GSEA may also generate false-positive results. The most common GSEA false-positives were in gene sets related to the ribosome and likely reflect true but random biological differences between contrast groups. This could conceivably be replicated across multiple studies. False-positive gene sets could alternatively result from a single sample if it is an outlier for multiple genes within a gene set. Overall, there are some gene sets that are more likely to be false-positives than others under scenarios where there are no DEGs; our dataset suggests that ribosome genes may be one of these gene sets in zebrafish embryos. Similar results were observed using multiple GSEA algorithms and ranking statistics. These results suggest caution when conducting and interpreting the results of any GSEA in contrasts where few or no DEGs are detected.
Supplemental Material
sj-docx-1-bbi-10.1177_11779322251321071 – Supplemental material for Gene Set Enrichment Analysis in Zebrafish Embryos Is Susceptible to False-Positive Results in the Absence of Differentially Expressed Genes
Supplemental material, sj-docx-1-bbi-10.1177_11779322251321071 for Gene Set Enrichment Analysis in Zebrafish Embryos Is Susceptible to False-Positive Results in the Absence of Differentially Expressed Genes by John DH Stead, Hyojin Lee, Andrew Williams, Sergio A Cortés Ramírez, Ella Atlas, Jan A Mennigen, Jason M O’Brien and Carole Yauk in Bioinformatics and Biology Insights
Footnotes
Acknowledgements
We thank David Eickmeyer for excellent technical support. We thank the anonymous peer-reviewers of this manuscript for their valuable comments.
Funding:
The author(s) disclosed receipt of the following financial support for the research, authorship and/or publication of this article: CLY and JAM are grateful for funding from the Natural Sciences and Engineering Research Council of Canada (RGPIN-2017-05290; RGPIN-2021-02806). JAM and CLY acknowledge infrastructure support through the Canadian Foundation of Innovation John Evan’s Leadership Fund (#148035; #233109), the Ontario Research Fund (#35859; #40569) and uOttawa. CLY acknowledges that this project was conducted thanks, in part, to funding provided through the Canada Research Chairs Program (CRC-2020-00060). JMOB acknowledges funding from Environment and Climate Change Canada’s Chemicals Management Plan. HL acknowledges funding from the National Research Foundation of Korea through the Postdoctoral Fellowship Program.
Declaration of conflicting interests:
The author(s) declared no potential conflicts of interest with respect to the research, authorship and/or publication of this article.
Author contributions
JDHS analysed the data and drafted the manuscript. HL and SACR prepared the samples and generated the sequencing data. AW provided statistical guidance. CLY, JAM and JMOB obtained funding for the project. All authors were involved in project conceptualization and design, plus read, contributed to and approved the final manuscript.
Ethical approval
Fish maintenance and all experimental procedures were performed in accordance with the Canadian Council for Animal Care at the University of Ottawa (Protocol: BL-3057).
Data availability
The datasets generated and/or analysed during the current study are available in the National Centre for Biotechnology Information (NCBI) Gene Expression Omnibus (GEO) repository (Accession no. GSE230213).
Supplemental material
Supplemental material for this article is available online.
References
Supplementary Material
Please find the following supplemental material available below.
For Open Access articles published under a Creative Commons License, all supplemental material carries the same license as the article it is associated with.
For non-Open Access articles published, all supplemental material carries a non-exclusive license, and permission requests for re-use of supplemental material or any part of supplemental material shall be sent directly to the copyright owner as specified in the copyright notice associated with the article.