
Abstract
Salmonella enterica is a gram-negative bacterium that demonstrates a remarkable ability to acquire antibiotic resistance genes (ARGs). The role of the CRISPR-Cas system in influencing antibiotic resistance in S. enterica is still under investigation. This study explores the distribution and impact of CRISPR-Cas systems on antibiotic resistance by analyzing 316 S. enterica genomes. We conducted sequence alignments, phylogenetic analyses, and conservation studies on Cas genes, direct repeats (DRs), and leader sequences. Promoter predictions and RNA secondary structure analyses were also performed. ARGs were identified, and their correlation with Cas gene clusters was evaluated. Our findings revealed that 82.33% of strains possess complete CRISPR-Cas systems, while 17.66% have orphan CRISPRs. We identified 290 distinct DRs, most of which formed stable stem-loop structures, although no promoter regions were detected within the leader sequences. Most spacers were chromosome-targeting, with a smaller proportion homologous to phages and plasmids. Importantly, strains with complete CRISPR-Cas systems showed a higher incidence of ARGs compared with those with orphan or no CRISPR systems. Specifically, the incidence of ARGs was 54.3% higher in strains with complete CRISPR-Cas systems than in strains without CRISPR-Cas systems, and 15.1% higher than in strains with orphan CRISPRs. Spearman’s correlation analysis confirmed a statistically significant but weak correlation between the presence of Cas genes and the frequency of ARGs (P-value = 3.892e–06). These results suggest that CRISPR-Cas systems may play a role in the acquisition of ARGs, potentially through mutations under antibiotic pressure. Future studies should investigate mutations, particularly in Cas3—the signature protein of type I CRISPR-Cas systems. In addition, experimental validation, such as culturing S. enterica strains with complete CRISPR-Cas systems under different antibiotic conditions, followed by sequencing to assess the uptake or absence of newly acquired ARGs, would help clarify the potential role of CRISPR-Cas systems in bacterial adaptation to antimicrobial pressures.
Introduction
Antimicrobial resistance is a global public health concern, and Salmonella—a gram-negative, facultative anaerobic bacterium—is one of the microorganisms in which some resistant serotypes have emerged. 1 As one of the most common pathogens responsible for foodborne illnesses, S. enterica is primarily transmitted through contaminated food and water, causing diseases such as gastroenteritis and typhoid fever.2-4 Its ability to rapidly acquire antibiotic resistance genes (ARGs) through horizontal gene transfer (HGT) complicates treatment efforts and contributes to the spread of multidrug resistance. 5 HGT is facilitated by mobile genetic elements such as plasmids, transposons, and bacteriophages, enabling the rapid dissemination of ARGs across bacterial populations.6,7 This presents a critical challenge in controlling infections caused by S. enterica.5,6
The CRISPR-Cas system, an adaptive immune mechanism found in many bacteria and archaea, plays a key role in regulating HGT by recognizing and cleaving foreign DNA in a sequence-specific manner.8,9 This system consists of clustered regularly interspaced short palindromic repeats (CRISPRs) and associated Cas genes, which encode nucleases responsible for interference with foreign genetic material. 10 In this context, CRISPR-Cas systems have the potential to limit the acquisition of ARGs by disrupting the uptake of foreign genetic elements. However, their role in modulating HGT and antibiotic resistance in S. enterica is not yet fully understood.
The CRISPR-Cas system is divided into 2 main classes (class 1 and class 2) and further subdivided into 6 types based on the structure and action of their associated proteins. Class 1 systems, such as type I-E, rely on multiprotein complexes for interference, while class 2 systems employ single multidomain proteins. 11 The S. enterica CRISPR-Cas system is primarily categorized as type I-E, with Cas3 acting as the unique signature protein responsible for DNA degradation.12,13 Despite this classification, the extent to which the CRISPR-Cas system impacts the acquisition and spread of ARGs in S. enterica remains an open question.
Studies in other bacterial species provide conflicting insights into the CRISPR-Cas system’s influence on ARG acquisition. For example, in Klebsiella pneumoniae, the CRISPR-Cas system appears to restrict the uptake of ARGs, 14 whereas in Escherichia coli, it has little to no effect on the spread of plasmids and ARGs. 15 These findings highlight the need for species-specific investigations into the role of the CRISPR-Cas system in regulating antibiotic resistance.
Given the growing threat of antibiotic resistance in S. enterica, understanding the relationship between CRISPR-Cas systems and ARGs is crucial. This study aims to address the knowledge gap by conducting a detailed bioinformatics analysis of S. enterica genomes. Specifically, we investigate the distribution of CRISPR-Cas systems across multiple strains and assess their potential role in the acquisition and dissemination of ARGs. The findings from this study could have broader implications for developing strategies to curb the spread of antibiotic resistance in pathogenic bacteria.
Materials and Methods
Data collection and identification of CRISPR-Cas systems
As of October 2024, the National Center for Biotechnology Information (NCBI) database contained 1 879 220 complete genome records of Salmonella enterica. From this data set, 316 genomes were randomly selected based on high sequencing quality, ensuring the inclusion of only fully sequenced strains. This unbiased selection, without preferences for specific serotypes or geographic origins, enabled a representative analysis of S. enterica’s genetic diversity.
This subset facilitated an exploratory analysis to identify key genetic patterns within the species. CRISPR loci, Cas genes, DRs, and spacers were identified using the CRISPR-Cas Finder server (http://crispr.i2bc.paris-saclay.fr/Server/) with default parameters.16,17 The Cas gene loci were identified through gene annotation of the whole genome sequences of S. enterica strains from the NCBI Nucleotide database. Multiple sequence alignments of the Cas genes were performed with the Clustal W algorithm in MEGA X software, and phylogenetic trees were constructed using the Neighbor-Joining method.
Analysis of the DRs, spacer and leader sequences, and prediction of RNA secondary structures
The DRs obtained from the CRISPR-Cas Finder server were aligned using Clustal W in MEGA X, and a neighbor-joining tree was constructed and visualized with iTOL. Conservation analysis of the DRs and leader sequences was performed using Weblogo, 18 and promoter presence was evaluated with Promoter 2.0.7 (https://services.healthtech.dtu.dk/services/Promoter-2.0/). The RNA secondary structure of the DRs and their minimum free energy were predicted using the RNAfold server (http://rna.tbi.univie.ac.at//cgi-bin/RNAWebSuite/RNAfold.cgi) with default settings. Spacer sequence origins were identified with BLASTn on NCBI, requiring ⩾85% match (minimum 28 of the 33 matches) to sequences in the GenBank database.19-21 A chart was created to illustrate the origins of these sequences.
Screening for ARGs
Antibiotic resistance genes in S. enterica strains were detected by submitting each strain’s whole genome to the ARGAnnot, 22 NCBI (https://www.ncbi.nlm.nih.gov/pathogens/antimicrobial-resistance/), ResFinder, 23 and CARD 24 databases.
Statistical analysis
R software (version 4.3.2) was used to analyze the correlation between ARGs and the presence of Cas genes. The Shapiro-Wilk test was first applied to assess data normality, followed by the Kruskal-Wallis test to identify significant differences in ARG prevalence among S. enterica strains with complete CRISPR-Cas systems, orphan CRISPRs, and no CRISPR-Cas systems. Spearman’s correlation was then used to evaluate the relationship between the presence of Cas genes and ARG prevalence.
In addition, genome size distribution analysis across all 3 groups was conducted in Python (version 3.9.10) to explore whether strains with complete CRISPR-Cas systems have a higher ARG uptake compared with those with orphan or no CRISPR-Cas systems. The analysis was visualized using the pandas, seaborn, and matplotlib packages, while the Kruskal-Wallis test for significant differences in genome size distribution was performed with the scipy package. A P-value of <.05 was considered statistically significant.
Results
Distribution of CRISPR-Cas systems in the S. enterica genomes
In this study, a total of 316 complete genome sequences of S. enterica were collected. Among the isolated strains, 300 strains contained at least 1 CRISPR locus, while 16 strains had none. Of these, 247 (82.33%) strains possessed a complete CRISPR-Cas system (including both CRISPR loci and Cas gene clusters), and 53 (17.66%) comprised orphan CRISPRs (lacking Cas gene clusters). A total of 636 CRISPR loci were identified across the 300 strains with CRISPR loci. According to the CRISPR-Cas Finder server, CRISPR loci are assigned an evidence level ranging from 1 to 4, with levels 1 and 2 indicating low confidence in the presence of that specific locus within the genome. Typically, CRISPR loci with evidence levels 1 and 2 are excluded from analysis. In this research, the “hide evidence level 1” filter was applied when screening for CRISPR loci. Of the 636 identified CRISPR loci, 3 loci (0.47%) had an evidence level of 3, while 633 loci (99.52%) had an evidence level of 4.
Among the 300 strains with CRISPR loci, the distribution of these loci varied significantly. Notably, 43 strains contained only 1 CRISPR locus, 198 had 2 loci, 53 possessed 3 loci, and 6 had 4 or more. A single strain, S. enterica subsp. enterica strain C68, exhibited the highest number of CRISPR loci, totaling 11. Out of the 247 strains with Cas gene clusters, only 1 strain, S. enterica subsp. diarizonae strain SA20121591, contained 2 sets of Cas gene clusters. This strain had 2 copies each of the following genes: Cas1, Cas2, Cas3, Cas5, Cas6, Cas7, cse1, and cse2, whereas the remaining strains had only 1 set. The type I-E Cas gene cluster consisted of Cas1, Cas2, Cas3, Cas5, Cas6, Cas7, cse1, and cse2. A structural diagram of the CRISPR-Cas system within the S. enterica genome is illustrated in Figure 1.

The cluster of Cas genes in the CRISPR-Cas system type I-E of S. enterica.
Cse1 plays a vital role in recognizing target DNA and recruiting Cas3 for degradation. It interacts with the phosphate backbone of the DNA near the protospacer adjacent motif (PAM), which is essential for stabilizing the target DNA during the interference process. This interaction ensures that Cas3 can effectively degrade the target DNA in type I-E CRISPR-Cas systems. 13 In addition, cse2 is part of the Cascade complex, which includes other proteins such as Cas7, Cas5, and Cas6, contributing to the overall architecture and stability of the complex. 25 While these roles are critical for the proper functioning of the interference complex, our analysis focused on genes more directly associated with phylogenetic relationships in the context of CRISPR adaptation and interference.
Further study the diversity and conservation of Cas genes in S. enterica, we translated the obtained nucleotide sequences into MEGA-X. We then aligned and analyzed the sequences of the Cas1, Cas2, Cas3, Cas5, Cas6, and Cas7 gene and constructed a phylogenetic tree (Figure 2). The results indicated that the Cas1 genes formed 2 clusters, which exhibited significant similarity to each other. The first cluster used “GTG” as a start codon, while “ATG” served as the start codon for the second cluster. This duality in start codons may reflect evolutionary adaptations to different environmental or selective pressures. Both clusters shared the same conserved motifs. An analysis of the Cas6 gene yielded results similar to those of the Cas1 gene, with some strains exhibiting different start codons. Strains with the same start codon displayed high similarity to each other but diverged considerably from strains with alternative start codons. As depicted in Figure 2E, strains 1505 and 2014AM-1331, both using “ATG” as their start codon, were highly similar to each other but different from other strains with different start codons.

Phylogenetic trees of Cas1, Cas2, Cas3, Cas5, Cas6, and Cas7 proteins. Phylogenetic trees for Cas1, Cas2, Cas3, Cas5, Cas6, and Cas7 were constructed using the Neighbor-Joining method. All strains displayed similar results, and 10 representative strains were selected to illustrate the phylogenetic relationships. (
As for Cas3 gene, while strains differed in their start codons, they exhibited high conservation throughout the rest of the sequence (Figure 2C). Phylogenetic analysis of Cas2 genes revealed no differences in start codons, and the Cas2 gene locus was highly conserved across all strains compared with Cas1 (Figure 2B). Similar to Cas2, both Cas5 and Cas7 in S. enterica strains showed no variations in start codons. However, the Cas2 and Cas5 genes demonstrated higher conservation rates than Cas7 (Figure 2D and F).
Analysis of DR sequences
A total of 290 distinct DRs were identified in 300 S enterica strains. The length of each DR sequence ranged from 24 to 31 bp, with an average length of 28.1 bp (Supplementary Table 1). All the DRs belonged to the type I-E CRISPR system. We conducted sequence alignment, conservation analysis (Figure 3A), and phylogenetic analysis on the 290 repeat sequences.

Analysis of CRISPR leader and DR sequences. (
As depicted in Figure 4, some DRs were detected more frequently than others. Among the identified 290 DRs, 243 exhibited a frequency of fewer than 10 occurrences across the 300 strains with CRISPR loci, meaning they were detected in only 1 or 2 strains (Supplementary Table 1). This limited occurrence rendered them unsuitable for further analysis. In contrast, the 9 DRs with a frequency greater than 60 were found in 95% of the analyzed strains, making them prime candidates for further analysis. Among these, DR1 and DR19 were the most frequently identified (Supplementary Table 1).
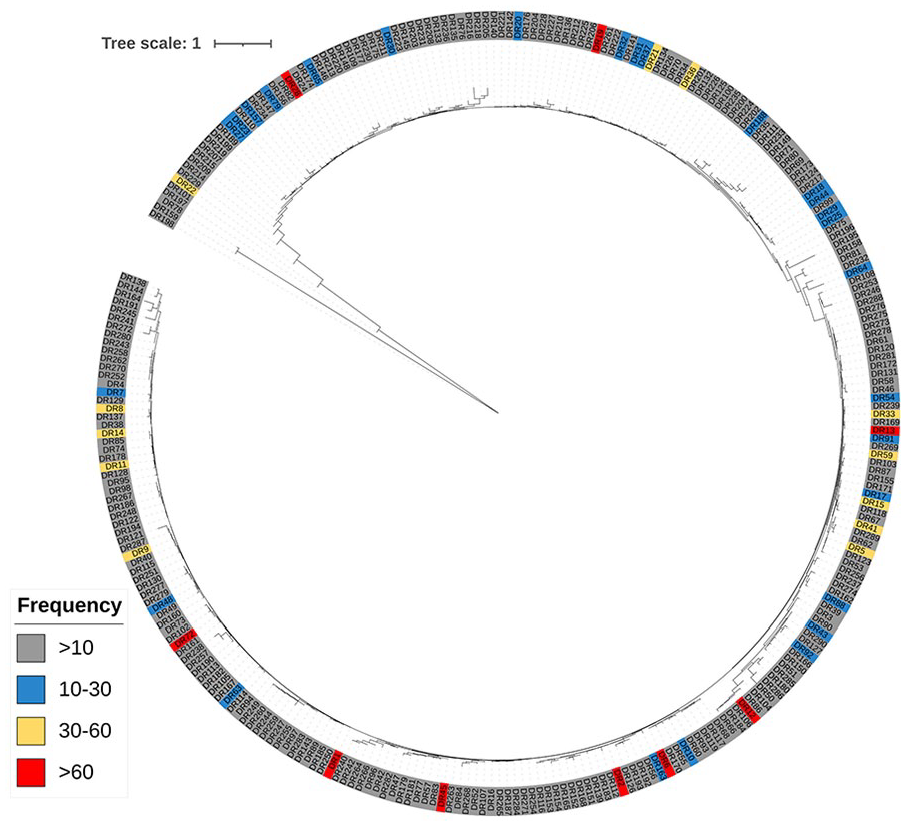
Phylogenetic tree of direct repeats and their frequency throughout the CRISPR loci of 300 S. enterica strains.
Secondary structures of repeat sequences
The RNA secondary structures and minimum free energy (MFE) of the DRs with the highest frequency (>60), as illustrated in Figure 4, were predicted using the RNAfold web server (Figure 5). All 9 DRs formed stable stem-loop structures, which signal the locations where cuts should be made on pre-crRNA. 26 DR1, DR2, DR6, and DR13 displayed identical secondary structures and MFEs of −15.20 kcal/mol, while DR19 and DR28 shared the same structure with an MFE of −14.20 kcal/mol. The MFE values across the analyzed DRs ranged from −3.00 kcal/mol to −15.20 kcal/mol.

The predicted RNA secondary structures and the MFE of the 9 DRs with the highest frequencies using RNAfold.
Further examination revealed that DR1, DR2, DR6, DR13, DR19, DR45, and DR72 each contained a small ring of 5 nucleotides at one end of the stem, paired with a larger ring at the opposite end. In contrast, DR12 displayed the highest MFE of −3.00 kcal/mol, featuring a larger ring at one end and a shorter stem compared with the other DRs. These MFE values correspond to the stability of the RNA structures; specifically, a lower MFE indicates greater stability. Thus, the structures of DR1, DR2, DR6, and DR13 demonstrated the highest stability, while DR12 exhibited the least stability.
Analysis of leader sequences
The leader sequence, which is rich in adenine and thymine (AT), is typically found at the upstream 5′ end of the CRISPR locus. Alignment of the leader sequences, specifically 100 bp upstream of the CRISPR1 locus in the S. enterica strains, revealed a high abundance of AT bases and a strong conservation at the 3′ end (Figure 3B). However, the Promoter 2.0.7 server indicated that there is no promoter present within the leader sequence.
Homology analysis of spacers
A total of 5130 spacer sequences were identified in CRISPR1 of 300 S. enterica strains. After removing duplicates, 2177 unique sequences remained. The lengths of these sequences ranged from 25 to 72 bp, with the majority measuring 32 bp. To analyze the origins of the 2177 spacer sequences, we used BLASTn against the GenBank database. Notably, 5.69% (124 of the 2177) of the spacers were homologous to phages, 2.52% (55 of the 2177) showed homology to plasmids, and 91.77% (1998 of the 2177) targeted chromosomal DNA (Figure 6). Among the chromosomal spacers, 81.85% (1782 of the 2177) originated from other S. enterica strains (non-self-genomes), while the remainder was related to other bacterial species, primarily Citrobacter spp. Interestingly, the majority of homologous phages (3.03%) were specific to S. enterica.

The origin of CRISPR spacers. The spacer homology was determined by sequence identity through the BLASTn in the GenBank database to find a homology sequence with ⩾85% coverage.
These results highlight the diverse recognition targets present in the CRISPR-Cas systems, including sequences that are unrelated to S. enterica and similar to those found in other bacteria. Furthermore, the spacers showed immunity against common infectious S. enterica phages such as P22, Gifsy-1, Gifsy-2, Fels-1, and ES18. This underscores the significance of CRISPR-Cas systems in S. enterica species, as they play a crucial role in providing protection against foreign elements, including lytic phages. For the CRISPR-Cas system to mount a targeted immune response against homologous sequences, it relies on spacers inherited from invading viral components. Consequently, the profiles of these spacers can offer valuable insights into the bacterial lifestyle and the environment in which they exist.27,28
Analysis of the ARG profile and its correlation with the CRISPR-Cas system
Among the 316 S. enterica strains analyzed, 247 strains carrying Cas gene clusters contained a total of 61 ARGs, with 14 of these genes detected at higher frequencies (Table 1). These genes included the antibiotic inactivation enzyme gene AAC(6′)-ly (n = 215) and several efflux pump complex genes, such as acrA (n = 728), emrB (n = 247), mdfA (n = 490), mdsA (n = 393), mdsB (n = 212), and mdsC (n = 210) (Figure 7). In addition, genes involved in modulating antibiotic efflux through 2-component regulatory systems—MdtK (n = 431), baeR (n = 486), cpxA (n = 520), CRP (n = 243), golS (n = 212), and sdiA (n = 243)—were frequently detected. bacA (n = 246), which confers antibiotic resistance via molecular bypass, was also prevalent. While these genes were present in strains without Cas clusters, they occurred at lower frequencies. The average number of ARGs among strains with complete CRISPR-Cas systems, orphan CRISPRs, and no CRISPR-Cas systems was approximately 14.18, 12.32, and 9.19, respectively. Strikingly, the incidence of ARGs in strains with complete CRISPR-Cas systems was 54.3% higher than in strains without CRISPR-Cas systems and 15.1% higher than in strains with orphan CRISPRs. Notably, only 5 strains did not contain any ARGs (Supplementary Table 2).
The frequency of antibiotic resistance genes in the presence or absence of Cas gene clusters.
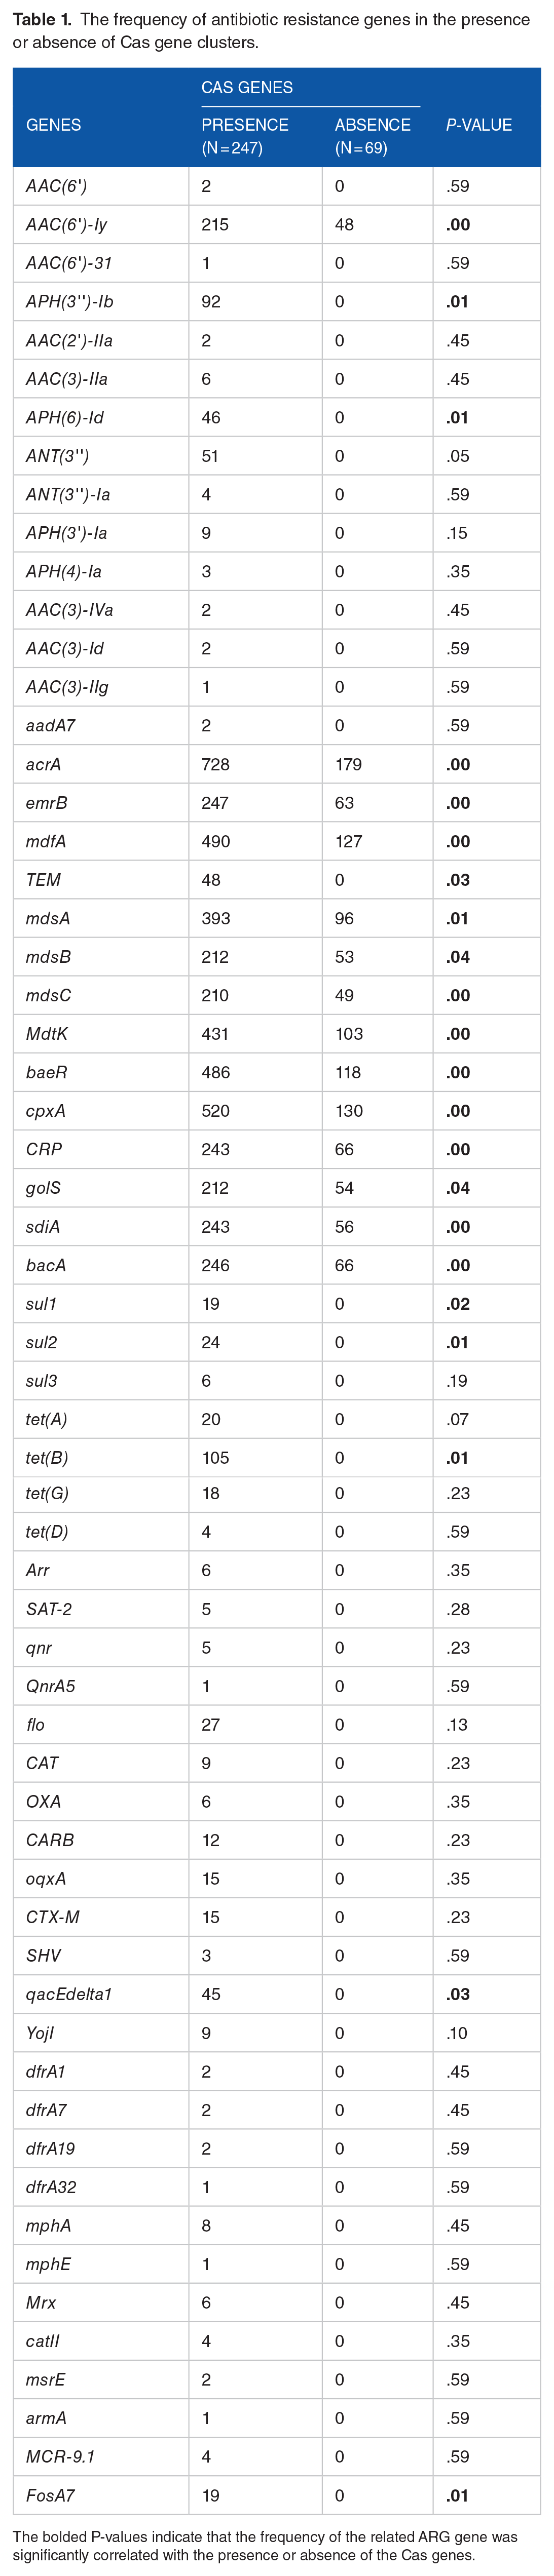
The bolded P-values indicate that the frequency of the related ARG gene was significantly correlated with the presence or absence of the Cas genes.

The most frequently detected antibiotic resistance genes in the 316 S. enterica strains.
To evaluate whether significant differences existed in the frequency of ARGs across strains with complete CRISPR systems, orphan CRISPRs, and no CRISPR-Cas systems, a Kruskal-Wallis test was performed. Prior to this analysis, the Shapiro-Wilk test was conducted to assess the normality of the data, yielding a W-value of 0.77458, which indicated that the data were not normally distributed. A P-value of 2.2e–16 further confirmed the rejection of the null hypothesis of normality. The Kruskal-Wallis revealed a statistically significant difference in the frequency of ARGs among the 3 groups (P-value = 7.417e–08).
In addition to gene frequency analysis, Spearman’s correlation analysis was performed to examine the relationship between the presence of Cas genes and the number of ARGs. This analysis yielded a P-value of 3.892e–06, indicating a statistically significant relationship. However, the Spearman rank correlation coefficient (rho) was 0.2563919, suggesting that while the correlation was significant, the strength of the relationship was relatively weak.
To complement the results from the correlation test, we also examined the genome size distribution of the 3 groups (Figure 8). All groups exhibited similar median genome sizes, ranging from approximately 4.7 to 4.9 million base pairs, with little variation within each group. Although a few strains with complete CRISPR-Cas systems and 1 strain with orphan CRISPRs displayed slightly broader genome size ranges compared with strains without CRISPR-Cas systems, the Kruskal-Wallis test did not indicate a statistically significant difference in genome size among the groups (P-value = .48).
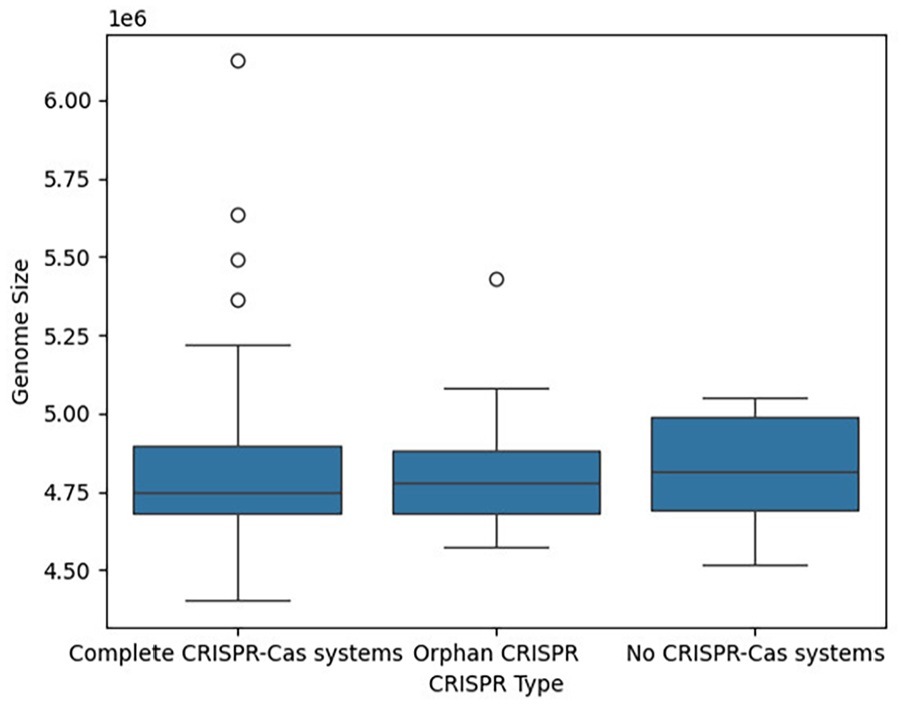
Genome size distribution of Salmonella enterica strains with different CRISPR-Cas systems. Boxplot shows the distribution of genome sizes (in base pairs) for S. enterica strains categorized by the presence of complete CRISPR-Cas systems, orphan CRISPR systems (without Cas genes), and no CRISPR-Cas systems. The genome sizes are shown in scientific notation (eg, 1e6 equals 1 000 000 base pairs). No statistically significant differences in genome size were observed between the groups (Kruskal-Wallis P-value = .48), suggesting that the presence or absence of CRISPR-Cas systems does not significantly affect genome size in S. enterica strains.
Discussion
A natural barrier to the spread of ARGs is the CRISPR-Cas system, a defense mechanism that bacteria have evolved to resist the invasion of foreign genetic material. 29 In this study, we analyzed the structure of the S. enterica CRISPR-Cas system and its potential impact on the acquisition of ARGs. Our results revealed a significant correlation between the presence of Cas gene clusters and ARGs, including acrA, emrB, mdfA, baeR, cpxA, CRP, and bacA, among others. The role of CRISPR-Cas in the spread of antibiotic resistance varies among different bacteria. 30 For example, contrary to our findings, studies such as that by Tao et al 31 reported an inverse correlation between the presence of Cas clusters and ARGs in Enterococcus strains. This discrepancy raises the question of whether environmental or evolutionary factors specific to S enterica might explain the higher incidence of ARGs in strains containing CRISPR-Cas systems.
One possible explanation is that certain selective pressures unique to S. enterica may favor the acquisition of ARGs despite the presence of CRISPR-Cas systems. For instance, S. enterica often resides in complex environments like the gut, where frequent exposure to antibiotics may drive mutations in the CRISPR-Cas system, allowing these bacteria to retain or acquire ARGs for survival. This hypothesis is supported by a study indicating that, under antibiotic pressure, mutations in the CRISPR sequence or Cas proteins could enable bacteria to bypass the system’s defense mechanisms and acquire ARGs. 32 Furthermore, the CRISPR-Cas system in S. enterica may exhibit biases that favor the acquisition of ARGs from chromosomal sources rather than from extrachromosomal ones, potentially explaining the limited impact of plasmid or phage invasions observed in this study. Future research should explore whether selective pressures or specific CRISPR-Cas variants contribute to this pattern, as understanding these factors could provide more clarifications on how S. enterica adapts to antibiotic challenges.
Most S. enterica strains analyzed in this study (66%) contained 2 CRISPR loci, all belonging to the type I-E CRISPR-Cas system, characterized by the presence of the Cas3 gene.33,34 The frequency of the CRISPR-Cas system in the S. enterica genome was significantly higher than the average rate observed across bacteria, which is reported to be around 45%. 35 This suggests that these strains are highly adapted to environmental pressures. Interestingly, 17.66% of the strains possessed orphan CRISPRs. The presence of orphan CRISPRs could indicate remnants of decaying CRISPR-Cas systems, as suggested by previous studies. 36 Alternatively, orphan CRISPRs might be retained for other functional advantages, such as acting as regulatory elements or providing immunity in conjunction with different defense mechanisms.37,38 Exploring these evolutionary dynamics further could help explain why S. enterica strains maintain orphan CRISPR loci and the selective pressures driving their retention.
The repeat sequences have a high degree of conservation and are primarily palindromic. The RNA secondary structure can be stabilized when the transcript of the DRs forms a hairpin structure. This stem-loop structure, created by the DRs, facilitates the interaction between an external RNA or DNA molecule and a Cas-encoded protein. 39 This finding implies that the stability of the RNA secondary structures could influence the efficacy of CRISPR. Numerous studies have predicted the MFE of RNA secondary structures using either the DRs alone or a combination of DRs and spacers.40,41 In our study, we focused solely on DRs for MFE analysis. Research has shown that DRs from complete CRISPR-Cas systems are more effective at forming stable RNA secondary structures with lower MFE compared with DRs from orphan CRISPRs. 42 Similarly, in our analysis, 34% of orphan CRISPRs contained DR12, which exhibited the least stable secondary structure compared with other frequently occurring DRs. Other orphan CRISPRs may also indicate unstable secondary structures, as predictions were only made for the most frequent repeat sequences. Previous studies have reported that structures with longer stems generally have lower MFEs and greater stability, 40 which is consistent with our results.
The size of the leader sequences in CRISPR-Cas systems often varies from tens to hundreds of base pairs. These sequences are primarily located at the 5′ end of the first repeat and are typically noncoding, AT-rich structures. 43 It has been hypothesized that the leader sequence functions as a promoter for the initiation of CRISPR loci transcription. 44 Although reports indicate that transcription defects occur in CRISPR systems lacking a leader sequence, the exact reason for this deletion remains unknown. 44 In our study, the leader sequences in S. enterica strains were relatively conserved and AT-rich, but no promoter was predicted, which supports the findings of previous studies 31,45and raises questions about how CRISPR loci transcription is initiated. One possible explanation is that alternative mechanisms, such as interactions with RNA polymerase or other regulatory proteins, might facilitate transcription initiation in the absence of a functional promoter. 46
The average length of a spacer was 32 bp, accommodating DRs within the range of 27 to 32 bp, as previously described.21,34,47 The number of spacer sequences within a locus can indicate the frequency of invasions, as spacers serve as a memory repository for CRISPR-Cas systems to resist foreign nucleic acid invasion. 48 In this study, only a small percentage of spacers originated from phages and plasmids (5.69% and 2.52%, respectively), implying that S. enterica strains have been less invaded by these genetic elements. These percentages were lower than those reported for Pseudomonas spp. (52% and 22% for phages and plasmids, respectively) 45 but were similar to those reported for Enterococcus spp. (7.16% for phages and 1.74% for plasmids). 31 Furthermore, spacers in strains with complete CRISPR-Cas systems demonstrated higher diversity compared with spacers in orphan CRISPR loci.
The Spearman correlation analysis revealed a significant correlation between the presence of Cas genes and the frequency of ARGs; however, the Spearman rank correlation coefficient indicated that this relationship was weak. In addition, the genome size distribution analysis showed that strains with Complete CRISPR-Cas systems, orphan CRISPR, and no CRISPR-Cas systems exhibited little variation in genome sizes. These results support the hypothesis that genome size remains consistent across S. enterica strains, regardless of the presence or absence of complete CRISPR-Cas systems or orphan CRISPRs. This suggests that the CRISPR-Cas systems may be largely inactivated, as the genome sizes are comparable across these categories, reinforcing the notion that CRISPR-Cas systems may not significantly impact genome size in these strains.
The CRISPR-Cas system significantly affects the HGT of ARGs. 49 In a study by Palmer and Gilmore, Enterococci-harboring ARGs were found to lack the CRISPR-Cas system. 50 However, in our study, only 5 strains lacked any ARGs. Notably, strains with complete CRISPR-Cas systems exhibited a higher rate of ARGs compared with those with orphan CRISPRs or those lacking CRISPR-Cas systems altogether. This result suggests that the role of the CRISPR-Cas system in the acquisition of ARGs is nonnegligible. It is suspected that under antibiotic pressure, the CRISPR sequence may mutate, enabling bacteria to acquire exogenous resistance genes for survival. 32 Future research should focus on mutations, particularly in Cas3—the signature protein of the type I-E CRISPR-Cas system—as these may play a pivotal role in the acquisition of ARGs. In addition, experimental validation, such as culturing S. enterica strains with complete CRISPR-Cas systems under various antibiotic conditions, followed by sequencing to detect newly acquired ARGs, would help clarify the role of the CRISPR-Cas system in bacterial adaptation to antibiotic pressure. Such studies could enhance our understanding of how selective pressures influence the functionality and evolution of CRISPR-Cas systems in S. enterica and other bacterial species.
Conclusion
Overall, this study aimed to enhance our understanding of the function of the S. enterica CRISPR-Cas system and its resistance mechanisms by analyzing its gene structure and investigating its interaction with ARGs. Although the number of strains analyzed may be limited and may not fully represent all S. enterica strains available in the NCBI and CRISPR databases, this research contributes to our understanding of the evolutionary trajectory and functional diversity of S. enterica CRISPR-Cas systems. Furthermore, it establishes a foundation for future research on the relationship between CRISPR-Cas systems and antibiotic resistance in S. enterica.
Supplemental Material
sj-docx-1-bbi-10.1177_11779322241307984 – Supplemental material for Comprehensive Analysis of CRISPR-Cas Systems and Their Influence on Antibiotic Resistance in Salmonella enterica Strains
Supplemental material, sj-docx-1-bbi-10.1177_11779322241307984 for Comprehensive Analysis of CRISPR-Cas Systems and Their Influence on Antibiotic Resistance in Salmonella enterica Strains by Tina Fallah and Morvarid Shafiei in Bioinformatics and Biology Insights
Supplemental Material
sj-docx-2-bbi-10.1177_11779322241307984 – Supplemental material for Comprehensive Analysis of CRISPR-Cas Systems and Their Influence on Antibiotic Resistance in Salmonella enterica Strains
Supplemental material, sj-docx-2-bbi-10.1177_11779322241307984 for Comprehensive Analysis of CRISPR-Cas Systems and Their Influence on Antibiotic Resistance in Salmonella enterica Strains by Tina Fallah and Morvarid Shafiei in Bioinformatics and Biology Insights
Footnotes
Funding:
The author(s) received no financial support for the research, authorship, and/or publication of this article.
Declaration of conflicting interests:
The author(s) declared no potential conflicts of interest with respect to the research, authorship, and/or publication of this article.
Author contributions
TF : Conceptualization, Methodology, Writing—original draft, Visualization. MS : Writing—review and editing, Supervision.
Ethical approval
Ethical approval was not required for this study.
Supplemental material
Supplemental material for this article is available online.
References
Supplementary Material
Please find the following supplemental material available below.
For Open Access articles published under a Creative Commons License, all supplemental material carries the same license as the article it is associated with.
For non-Open Access articles published, all supplemental material carries a non-exclusive license, and permission requests for re-use of supplemental material or any part of supplemental material shall be sent directly to the copyright owner as specified in the copyright notice associated with the article.