
Abstract
This study was conducted to assess the possible antidiabetic potential of Conyza bonariensis by employing in vitro as well as in vivo assessments. The dried plant material was extracted in methanol, ethanol, and water. The in vitro results showed that the ethanolic extract (EthCb) was found to have higher antioxidant and antidiabetic potential as compared with the aqueous (AqCb) and methanolic extracts (MthCb) so it was further evaluated in the in vivo trial using a diabetic rat model. Diabetes was induced in male Wistar rats by administering 5% sucrose in drinking water and a cafeteria diet for 8 weeks, followed by nicotinamide and streptozotocin administration. Subsequently, the diabetic rats were divided into 4 groups (n = 8 each): Positive control (no treatment), standard control (Metformin @ 10 mg/kg bw), treatment 1 (C. bonariensis ethanolic extract @ 200 mg/kg bw), and treatment 2 (C. bonariensis ethanolic extract @ 400 mg/kg bw). In addition, there was a negative control group of 8 rats without diabetes induction or treatment. After 21 days of treatment, blood samples were collected from all rats. The serum was evaluated through different means for glucose level, lipid profile, oxidative stress, carbohydrate metabolic enzymes and thyroid hormones. ANOVA was used to evaluate the data statistically. Total oxidant status (TOS) and the serum glucose levels of the streptozotocin-treated rats were reduced significantly (P ⩽ .05) in Conyza bonariensis treated group. Whereas total antioxidant capacity (TAC) along with enzymes like paraoxonase and arylesterase were increased in Conyza bonariensis treated group. The antihyperlipidemic activity was also observed in Conyza bonariensis treated group Interestingly the subnormal levels of T3 and T4 which were observed in the PC group were also normalized in both treatment groups. This study demonstrated the antidiabetic as well as antioxidant activity of different extracts of Conyza bonariensis.
Introduction
Several traditional/conventional medicinal plants and their extracts reportedly have strong antioxidant role at the cellular level. Herbal extracts generally contain diverse bioactive compounds deemed useful in various therapeutics.1,2 Herbal antioxidant bioactive molecules have been shown to exhibit several pharmacological properties. 3 Approximately 25% of all prescriptions contain 1 or more active compounds derived from plants. 4 Pathologically, the cellular presence of excessive reactive oxygen species (ROS) has been implicated as the primary source of tissue oxidative damage leading to systemic diseases like diabetes mellitus.5-8 The glucose oxidation, protein glycation and lipids peroxidation in hyperglycemic conditions damage cells and lead to insulin resistance.9,10
Synthetic exogenous insulin and hypoglycemic medications are the primary treatment options for hyperglycemia in diabetes. These treatment options have shown considerable side effects in long term. 11 Herbal medication has been estimated to be used by most of the diabetics as their primary treatment option. According to ethnobotanical information, the number of plants utilized globally as traditional treatment options for diabetics. 12 According to the World Flora Online (WFO), Conyza bonariensis (L.) Cronquist. (Asteraceae) belongs to the genus Conyza [wfo-0000043751 13 ]. A perennial, intrinsic plant, traditionally used as a natural antioxidant. 14 Conyza bonariensis (L.) is a commonly used remedial plant in Ayurveda and Unani medicine to treat a variety of disorders including diarrhea, dysentery, hemorrhage, hemorrhoids, kidney disorders and bronchial complaints and is externally used for eczema and ringworm. 15 The whole plant contains curative constituents having potent antioxidant and antiinflammatory properties owing to the high amounts of flavonoids, phenolic acids, alkaloids, terpenoids, tannins and volatile oils.16,17 Recently the aqueous methanolic extract of Conyza bonariensis (L.) has been shown to impart hypoglycemic effect in alloxan-induced hyperglycemic rats after 14 days of treatment. 18 This study was conducted to examine the in vitro properties of different extracts of Conyza bonariensis (L.) and the in vivo ability of Conyza bonariensis (L.) supplementation to regulate hyperglycemia, oxidative stress status, lipid profile, and thyroid hormones in a type 2 diabetic rat model.
Methodology
Procurement of the plant
Conyza bonariensis (L.) was collected from Government College University Faisalabad, Pakistan. With a voucher specimen labeled as 270-bot-20, the plant was identified by an experienced botanist from the Department of Botany, Government College University Faisalabad, Pakistan.
Extract preparation
After drying in the shade, the plant was grounded into powdered form. Subsequently, 50 g of the powder was drenched in 250 mL of different solutions including ethanol, methanol, and distilled water, along with periodic mixing and stirring for 72 hours. Afterward, the solutions were refined by filtering through Whatman filter paper. After filtering, each extract was evaporated and subsequently concentrated in the rotary evaporator (SCI100-Pro; SCILOGEX, USA) at 40°C. Concentrated extracts were then poured into petri plates and stored in the incubator at 40°C until they became scorched. For the different extracts, the percentage yield was 15.2% (methanolic), 14.7% (ethanolic), and 13.01% (aqueous). The extracts were kept at 4°C until further process.
Qualitative phytochemical analysis
The plant extracts were estimated for various phytochemicals using standard protocols. 19
Quantitative assessment of phytochemicals
Total phenolics (mg of gallic acid equivalent/g dry weight of plant)
A volume of 30 µL plant extracts at a 1 mg/mL concentration was mixed with 30 µL of folin ciocalteu reagent, and then 600 µL of 2.5% Na2CO3 was added. After 1 hour, the absorbance was measured at 760 nm by chemical analyzer (Biolab-310). For TPC assessment, a gallic acid standard curve (0.5 to 300 µg/mL) was used. 19
Flavonoid content (mg of quercetin equivalent/g dry weight of plant)
Quercetin was used as a reference for flavonoid quantification (0 to 100 µg/mL) according to the protocol by Mustafa et al. 19 Briefly, 100 µL extract was mixed with 1 mL of distilled water. After 5 minutes, 125 µL of AlCl3% and 75 µL of 5% NaNO2 were added. Then, after 6-minute pause, addition of 125 µL of NaOH (1M) and additional 2.5 mL of distillated water was conducted. Finally optical density (OD) was assessed at 540 nm through the chemistry analyzer (Biolab-310).
Phenolic constituents
For the estimation of the phenolic contents, methanol with the 10 µL volume of 0.1 g/mL concentration was inserted in the columns of HPLC equipment (HP 1050 gradient) comprising the detector (SPD-10AV). The stationary phase comprised of Shim-Pack CLC-ODS C-18 column (5 µm, 5 cm×4.5 mm) (Shimadzu, Japan). For the mobile phase, glacial acetic acid solution and distillated water with a volume ratio of 24:0:4:320:56 were employed. Various phenolic compounds were quantified at room temperature with a 10-minute linear gradient. 20
In vitro assessment of antioxidant activity
Ferric reducing antioxidant potential (FRAP; µmole Fe2+/g DW)
Ferric reducing antioxidant potential was assessed through the method by Mustafa et al. 19 Briefly, 3.995 mL of the working reagent [10 parts of 300 mM acetate buffer, 01 part of 10 mM 2,4,6-tri{2-pyridyl}-s-triazine in 40 mM HCL, 01 part of 20 mM Ferric chloride] mixed with 5 µL of the extract. Optical density was taken at 593 nm to assess the reducing power. Calculation of the results using the equation from the reference curve of FeSO4 (0 to 1000 µMole) and written as µmole Fe2+/g dry weight of the extract.
ABTS scavenging activity (Trolox equivalent/g DW)
A previously reported protocol was followed to assess the ABTS scavenging activity of plant extracts. 19 Briefly, 7 mM of ABTS was mixed with equal amounts with 2.5 mM potassium persulfate. Methanol was added to this solution to until the absorbance of 0.7 at 734 nm was achieved. Then, 5 µL extract was added to 3.995 mL of this solution. After 30 minutes, the absorbance at 734 nm was calculated. Results were finally determined using Trolox reference curve equation at 0 to 800 µMole.
DPPH• radical scavenging activity
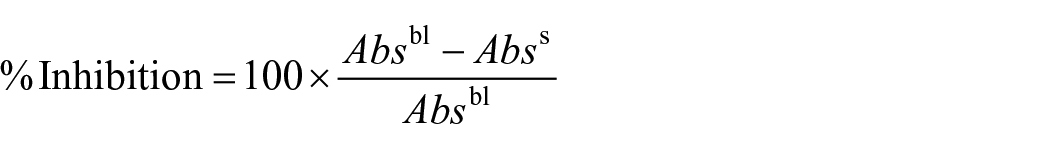
According to a previously reported protocol, 19 5 µL of different concentrations of extract samples in methanol (3.12-5 mg/mL) was diluted with 585 µL of 0.2% DPPH• solution blended with methanol. After 20 minutes, using the chemical analyzer (Biolab-310) the absorbance of the solution was determined at 515 nm. The scavenging ability of the extracts was estimated using the below-mentioned equation, where Absb stands for the absorbance of blank solution (DPPH•), Absex stands for the absorbance of the extract samples. IC50 was calculated using GraphPad prism 8.19,21

Antidiabetic potential
α-Amylase inhibition
A previously reported protocol 19 was employed to determine the α-amylase inhibition capability of the extracts in vitro. Briefly, 500 µL of different concentrations of extracts in methanol (3.12-5 mg/mL) were mixed with 500 µL of porcine pancreatic amylase solution (0.5 mg/mL in 0.02M PBS of 6.9 pH mixed with 0.006M NaCl). After 10 minutes, 1% starch solution in PBS (0.5 mL) was mixed with 1 mL of DNSA. Afterward to stop the reaction the starch and DNSA solution was placed in the hot water bath for 10 minutes. Later, mixed with 10 mL of dH2O. Finally, the absorbance of the solution was measured by the chemical analyzer (Biolab-310). Acarbose (Acr) was used as the reference and blank was used for 100% enzyme activity. To calculate the enzyme inhibition activity in percentage following equation was employed. Where Absbl stands for the absorbance of the blank solution, Abss stands for the absorbance of the samples or standard. IC50 was calculated using GraphPad prism 8.
α-glucosidase inhibition
To assess the ability of different extracts to inhibit α-glucosidase activity in vitro 980 µL of pNPG solution (290 mM β-D glucopyranoside in 20 mM citrate buffer of pH 5.6) was added with 200 µL of different concentrations of extract samples and acarbose in methanol (3.12-5 mg/mL) according to a previously reported protocol. 19 After 5 minutes, 20 µL of 1 U/mL α-glucosidase was added and placed in incubation at 35°C for 40 minutes. Termination of the reaction was achieved through the addition of 200 µL of HCl (6N). Using the chemical analyzer, the absorbance was determined at 405 nm (Biolab-310).

Here Absbl stands for the absorbance of the blank solution, Abss stands for the absorbance of the samples or standard. IC50 was calculated using GraphPad prism 8. 19
Cell line and glucose uptake
HepG2 cell lines were cultivated in a culture flask using DMEM solution enriched with 2% fetal bovine serum (FBS), penicillin G (100 mg/mL; Sigma), and streptomycin (100 U/mL; Sigma) for a period of 5 days. The flask was maintained within a humidified CO2 incubator set at 37°C with 5% CO2. The experiments were carried out on 3 separate occasions, each with replicates. For the subsequent phase, the cells were seeded until they reached confluence in a 96-well plate, and 3 wells were intentionally left empty as controls. The DMEM medium was then aspirated and replaced with RPMI-1640, which contained 2 g/L of glucose and was supplemented with 0.2% BSA. Following a 2-hour incubation period, the medium was once again replaced with fresh medium, which was used to treat the cells with various plant extracts (EthCb, MthCb, and AqCb) at concentrations 5.0 and 2.5 mg/mL, along with 0.01 mM metformin as standard. In the first 3 wells designated as blanks, DMSO was added. After a 2-day treatment period, the glucose concentration in the medium was quantified using the glucose-oxidase method. 22
Evaluation of antioxidative enzymes
Catalase (CAT) assay
The Catalase enzyme activity was assessed following a previously established method in a 96-well plate. Each well contained a mixture of 12 mM KH2PO4 (pH 7.0), 31.25 mM H2O2, and secretome. This experimental setup included blank wells, wells treated with metformin, EthCb, MthCb, and AqCb. After exposing the samples to light for a duration of 30 to 60 seconds, the absorbance at 240 nm was measured relative to a blank. The difference in absorbance between the 45-second and 60-second time points was utilized to calculate the Catalase (CAT) enzyme activity. Enzyme activity was quantified as enzyme units per gram of fresh weight (U g−1 FW). These procedures were repeated 3 times to ensure accuracy and reproducibility. 22
Superoxide dismutase (SOD) assay
The method described by Nisar et al. 22 was followed to in order to determine the activity of the SOD enzyme within a 96-well plate containing HepG2 cells. In each well, a reaction solution was prepared, which included secretome from various treatment groups. This solution was mixed with a buffer consisting of 100 mM KH2PO4 at a pH of 7.8, EDTA (0.1 mM), methionine (13 mM), nitro-blue tetrazolium chloride (NBT; 2.25 mM), and riboflavin (60 µM). Subsequently, this mixture, along with metformin and different concentrations of various plant extracts, was introduced to the HepG2 cells. In all wells except the blank, exposure to light was carried out for a duration of 10 minutes, followed by the measurement of absorbance at 560 nm. The final value representing SOD activity was calculated using a specific equation and expressed as units per gram of fresh weight (U g−1 FW). The procedure was repeated 3 times to ensure the reliability of the results.

Animals Experimentation
The in vitro results of antioxidant and antidiabetic essays show that ethanolic extract of Conyza bonariensis showed the best results as compared with methanolic and aqueous extracts, so it was further evaluated for its antioxidant and antidiabetic activity in the in vivo experimental trial.
After the official approval from the Animal Care and Ethical Committee, G.C. University Faisalabad, and according to the previously set out criterion for the care and use of laboratory animals in biomedical research (EEC Directive of 1986; 86/609/EEC), a total of 48 male albino rats of Wister strain (aged 2 ± 1 weeks, weight 60 ± 10 g) were acquired from the inhouse animal experiment research station of the Department of Physiology, G.C. University Faisalabad, Pakistan. Animals were housed in elevated wire cages with food and water ad libitum. The drinking water was supplemented with 5% sucrose under standard temperature and light conditions (temp = 26°C ± 2°C; light = 12 hour light and dark cycle; humidity = 40%-60%). A separate group of animals (n = 8) which was considered the negative control was housed under the same conditions with normal drinking water for the total length of the experiment. After 8 weeks, rats were injected with a single intraperitoneal dose of nicotinamide (NIC; 110 mg/kg). 15 minutes post administration of nicotinamide, intraperitoneal injection of streptozotocin mixed with the cold citrate buffer (0.1 M, pH 4.5) at the dose rate of 65 mg/kg body weight was administered. After 72 h, hyperglycemia was confirmed by glucometer-based blood glucose measurements (Glucocard 01-mini, Arkray Factory Inc., Japan). 23 Animals with blood glucose levels ⩾ 250 mg/dL were recognized as hyperglycaemic. These hyperglycemic animals were then further divided in 5 equal groups. The detail of each group is as follows: rats fed with CMD only were positive control (PC); hyperglycemic rats were standard control (SC); hyperglycemic rats given the oral lavage of metformin at the dose of 1 mg/kg body weight were negative control (NC); hyperglycemic rats supplemented with the plant ethanolic extract through oral lavage at the dose rate of 200 mg/kg body weight were treatment group 1 (CB1) and finally hyperglycemic rats supplemented with plant ethanolic extracts via oral lavage at the dose rate of 400 mg/kg body weight were treatment group 2 (CB2). All the rats after 21 days were sacrificed as humanly as possible through cervical decapitation and whole blood was collected. Centrifugation at 500g for 10 minutes was used for serum separation. The serum was then stored at -20°C until further analysis.
Serum lipid profile and glucose level
Determination of the levels of total cholesterol, triglyceride and HDL-cholesterol was achieved by employing colorimetric assay kits commercially available from Sigma-Aldrich Co. Details of the individual kits used are as follows; Total Cholesterol (Catalog Number CS0005; mg/dL; Detection range: 1-5µ g), Triglycerides (Catalog Number MAK266; mg/dL; Sensitivity: 2 pmole-10 nmole; Detection range: 2-10 000 µM range), HDL-Cholesterol (Catalog Number MAK045; mg/dL; Detection range: 1-5µ g). Fredrick equation was used to estimate the LDL-cholesterol levels in the serum. Bioclin Glucose Mono-reagent diagnostic kit (detection range: 2-500 mg/dL, CV%: <3.11) was employed to determine serum glucose levels.
Carbohydrate metabolic enzymes
Levels of different enzymes responsible for the carbohydrate metabolism in the serum were determined by employing commercially available immunoassay kits. Specifically, Glucose-6-phosphate dehydrogenase, Phosphofructase and Pyruvate Kinase levels were assessed through immunoassay ELISA kits from ElabScience, USA. Detail of the specific kits used includes Glucose 6-Phosphate Dehydrogenase; Rat G6PD; µLU/mL; Cat. No. E-EL-R0428; Sensitivity: 0.10 ng/mL; Detection Range: 0.16-10 ng/mL; Phosphofructokinase; Rat 6. PFK; ng/mL; Cat. No. E-EL-R1214; Sensitivity: 0.94 ng/mL; Detection Range: 1.56-100 ng/mL; Pyruvate kinase; Rat PK; ng/mL Cat. No. E-EL-R0837. The coefficient of variation was <10% for these immunoassay kits.
Total antioxidant capacity (TAC, mmol Troloxequiv./L)
The evaluation of the total antioxidant capacity (TAC) in serum samples was conducted by following a previously defined method. 24 The principle followed was that the antioxidants present in the sample ends up bleaching the color of orthodianisidine which is present in the assay reagent. Higher levels of bleaching indicates higher antioxidant concentration which will result in the reduction of the absorbance, presented as an inversely proportional standard curve. Specifically, vitamin C standards were calibrated with biochromatic wavelengths (660 and 870 nm) at increasing concentrations using a semi-auto analyzer (Biolab 310). The minimum possible value observed was around 0.18 mmol/L with the linearity of around to 7 mmol vitamin C equivalent/L, and the value of the intra-assay coefficient of variance (CV) being under 3%.
Total oxidant status (TOS; µmol H2O2 equiv./L)
Total oxidant status (TOS) of the serum samples was determined using the previously defined method. 24 Different concentrations of hydrogen peroxide (H2O2) were used to generate the standard curve. Total oxidant status levels were presented as equivalent to the μmol H2O2/L. The minimum detection range of the assay was around <3%. While the intra-assay coefficient of variance was <10% and the linearity of around 200 μmol H2O2/L. 25
Paraoxonase activity (U/L)
The activity of Paraoxonase enzyme in the serum samples was determined through a previously defined method. 25 The formula used to measure the enzyme activity has been stated in the reference methodology. The enzyme activity was presented as Unit/min/L. The intra-assay coefficient of variance was <10%. The paraoxon reaction or the hydrolysis rate was constant for a maximum of 5 minutes. The minimum detection limit ranged from 80 to 100 U/min/L for the assay used.24-26
Arylesterase activity (KU/L)
Determination of the enzymatic activity of serum arylesterase was performed according to a previously defined method. 25 The hydrolysis rate was constant for 5 minutes and the intra-assay coefficient of variance was <7%.
Serum Hormones
Serum levels of different hormones from the thyroid and pituitary gland were determined by employing commercially available immunoassay kits. Specifically, Tri-iodothyronine (T3), thyroxine (T4) and thyroid stimulating hormone (TSH) levels were assessed through immunoassay ELISA kits from ElabScience, USA. Details of the specific kits used are as follows tri-iodothronine (fT3) Cat. No. E-EL-0079; Sensitivity: 0.94 pg/mL; Detection limit: 1.56-100 pg/mL, Thyroxin (fT4) Cat. No. E-EL-0122; Sensitivity: 0.94 pg/mL; Detection limit: 1.56-100 pg/mL and Thyroid Stimulating Hormone (TSH) Cat. No. E-EL-R0976; Sensitivity: 0.75 ng/mL; Detection limit: 1.25-80 ng/mL. The coefficient of variation CV for all these kits was <10%.
Statistical analysis
The SPSS software (version 23) was employed for the statistical analysis of the results. For the in vitro experimentation, all the calculations were taken in triplicates. All the data sets are presented as ±standard error means (±SEM). To analyze the differences among various groups, 1-way Analysis of Variance (ANOVA) was followed by Turkey’s post hoc test. Where the difference among the results of various groups was considered significant at P < .05. Correlations were assessed by utilizing bivariate linear correlations (P < .05 and P < .01) through Pearson’s correlation coefficient (r) in Microsoft Office Excel software (version 2019).
Results
Phytochemical analysis
The concentration-specific presence of various phytochemicals in all the extracts studied is presented in Table 1. TFC and TPC were found to be significantly (P ⩽ .05) high in EthCb (16.82 ± 0.03 mgQE/g and 22.00 ± 0.34 mgGAE/g, respectively) and in comparison with MthCb (10.99 ± 0.27 mgQE/g and 19.04 ± 0.27 mgGAE/g, respectively) and AqCb (6.27 ± 0.37 mgQE/g and 12.53 ± 0.36 mgGAE/g, respectively) (Figure 1). The quantity of various phenolic and flavonoid compounds analyzed through HPLC in all the plant extracts is presented in Table 2. Chlorogenic acid, among the phenolic contents, was found to be mostly present in the EthCb (3502.07 ± 76.91 mg/g) and MthCb (974.94 ± 26.92 mg/g). Whereas the maximum concentration of gallic acid was found to be present in the EthCb (775.32 ± 39.21 mg/g). The maximum quantity of flavonoid group present in all the extracts was Rutin and its sequence of concentration was as follows EthCb >MthCb >AqCb (Table 2).
Qualitative chemical analysis of Conyza bonariensis..

Abbreviations: AqCb, Conyza bonariensis Aqueous extract; EthCb, Conyza bonariensis Ethanolic extract; MthCb, Conyza bonariensis methanolic extract.
(+++) indicates strong presence, (++) indicates moderate presence, and (+) shows weak presence and (–) means not detected for presence.

Total phenolic contents (A) and total flavonoid contents. (B) of various extracts of Conyza bonariensis. The results are presented as ±SEM. Bars having different alphabetical superscripts (a to c) show significance at P ⩽ .05.
Determination of total flavonoid contents and total phenolic contents in different extracts of Conyza bonariensis through HPLC.

Abbreviations: AqCb, Conyza bonariensis Aqueous extract; EthCb, Conyza bonariensis Ethanolic extract; MthCb, Conyza bonariensis methanolic extract; n/d, not detected.
Results are shown as standard error means (±SEM). Values with a different superscript (a to c) in a row show a significant difference at P ⩽ .5.
In vitro antioxidant activity
FRAP and ABTS scavenging activity
EthCb have exhibited the maximum reducing ability toward Fe3+ into Fe2+ (718.51 ± 26.92µmoleFe2+/g) as compared with the MthCb (424.76 ± 5.40µmole Fe2+/g) and AqCb (295.53 ± 3.63µmoleFe2+/g) in FRAP assay (Table 3). Similar results were obtained in the case of ABTS radical scavenging activity being highest in EthCb (695.00 ± 25.47µMTE/g), followed by MthCb (589.33 ± 5.36µMTE/g) and AqCb (108.52 ± 17.23µMTE/g).
Phytochemicals and antioxidant activity of different extracts of Conyza bonariensis.

Abbreviations: AqCb indicates Conyza bonariensis Aqueous extract; EthCb, Conyza bonariensis Ethanolic extract; MthCb, Conyza bonariensis methanolic extract; FRAP, Ferric reducing antioxidant potential; TEAC, Trolox equivalent antioxidant capacity; TFC, total flavonoid content; TPC, Total phenolic contents.
Results are shown as standard error means (±SEM). Values with a different superscript (a to c) in a row show a significant difference at P ⩽ .5.
DPPH• radical scavenging potential
A dose-dependent increase was observed in the DPPH• radical scavenging activity of all the extracts and was found to be highest in EthCb in terms of having the lowest IC50 (0.67 ± 0.0 mg/mL) as compared with MthCb (2.71 ± 0.09 mg/mL) and AqCb (2.89 ± 0.06 mg/mL) as shown in Figure 2.
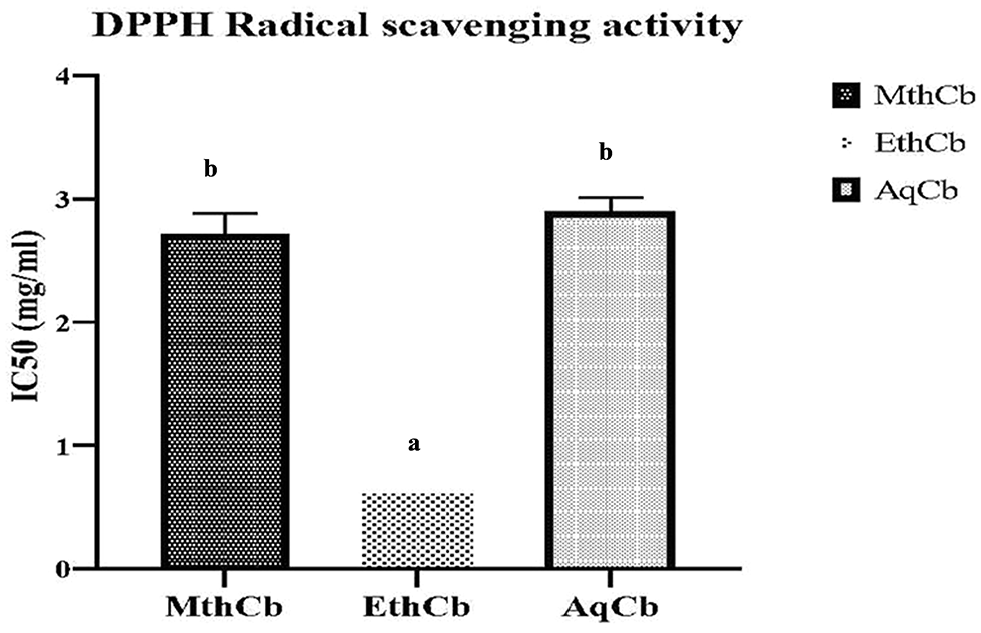
Activity of DPPH• radical scavenging by various extracts of Conyza bonariensis. The results are shown as standard error means (±SEM). Bars having different alphabets (a to b) show significance at P ⩽ .05.
Antidiabetic activity
Inhibition of α amylase enzyme activity
Conyza bonariensis extracts exhibit considerable potential in a dose-dependent manner to inhibit the activity of α amylase (Figure 3). EthCb was found to induce maximum inhibition with the lowest IC50 value (0.48 ± 0.02 mg/mL) which is slightly greater than the acarbose standard (0.32 ± 0.008 mg/mL) and lower than AqCb (0.70 ± 0.03 mg/mL) and MthCb (0.54 ± 0.04 mg/mL).

Inhibition of α-amylase activity by different Conyza bonariensis extracts. The results shown are shown as standard error means (±SEM). Bars having different alphabets (a to b) show significance at P ⩽ .05.
Inhibition of α-glucosidase enzyme activity
Concentration or dose-dependent inhibition of the α-Glucosidase enzyme activity was observed. The IC50 value was found to be highest for AqCb indicating that it has the lowest potential to inhibit α-glucosidase. Ascending sequence of the ability of different extracts and standard to inhibit α-Glucosidase activity was as follows AqCb <MthCb <EthCb < Acr (Figure 4).

α-Glucosidase inhibitory activity of various extracts of Conyza bonariensis. The results shown are shown as standard error means (±SEM). Bars having different alphabets (a to c) show significance at P ⩽ .05.
Correlation among phytochemicals, antioxidants, and antidiabetic potential
A positive correlation of almost 100% between TPC and FRAP (r = 0.996) and 91% between TPC and ABTS scavenging potential (r = 0.949) was found (Table 4). Interestingly correlation between TPC, IC50 value of DPPH• and TPC was found to be highly negative (98%) with correlation coefficient value in the negative (r = -0.991). This means that increasing TPC will also increase the concentration of the extract needed to scavenge at least 50% of the DPPH• radical. The correlation of TFC with different antioxidant activity parameters was assessed (Table 4). The results suggested that the antioxidant activity of the phytochemicals is strongly linked with the α-amylase and α-glucosidase inhibitory activity. Supporting the notion that higher the TPC and TFC, the higher the antioxidant and antidiabetic activity.
Pearson’s correlation of various phytochemicals in Conyza bonariensis with antioxidant and antidiabetic activities.

Means the significance of Correlation at P ⩽ .01.
Cell line
Table 5 shows the catalase and SOD activities of EthCb, MthCb, and AqCb extracts on different concentrations. Results show that EthCb has significantly more catalase and SOD activities on both concentrations as compared with MthCb and AqCb extracts. Glucose consumption ability was also observed maximum in EthCb as compared with MthCb and AqCb extracts.
Catalase activity, superoxide dismutase activity and glucose consumption of different extract of Conyza bonariensis in HepG2 cell lines.

Abbreviations: AqCb, Aqueous extract of Conyza bonariensis; EthCb, Ethanol extract of Conyza bonariensis; MthCb, Methanol extract of Conyza bonariensis; SOD, superoxide dismutase.
Asterisk (*) describe the highest activity of the extract as compared with other extracts of the same concentrations in a column.
In vivo antioxidant activity
Effect of Conyza bonariensis (L.) extract on oxidative stress
The total antioxidant capacity (TAC) was found to be increased significantly (P ⩽ .05) in the CB2 (2.29 ± 0.50b mM/L) as compared with other treatment groups (Table 6). An increase in the TAC value was also observed in the CB1 (1.81 ± 0.10ab mM/L) but it was found to be statistically nonsignificant when compared with the PC (0.82 ± 0.18a mM/L) group. Conyza bonariensis (L.) extract also decreased the total oxidant status (TOS) although nonsignificant in the CB1 (24.37 ± 1.68b uM/L) and CB2 (18.67 ± 0.43b uM/L) group when compared with the PC group (29.95 ± 2.73ab uM/L; Table 5). There was also a significant (P ⩽ .05) increase observed in the serum arylesterase and paraoxonase activities in the CB2 (167.29 ± 6.96b KU/L and 30.64 ± 0.81b U/L, respectively) group as compared with PC (127.11 ± 5.41a KU/L and 17.47 ± 4.66a U/L, respectively) group. However, enzyme activities were found to be increased in the CB1 group, but the increase was statistically nonsignificant (Table 6).
Effect of Conyza bonariensis (L.) on oxidative stress markers.
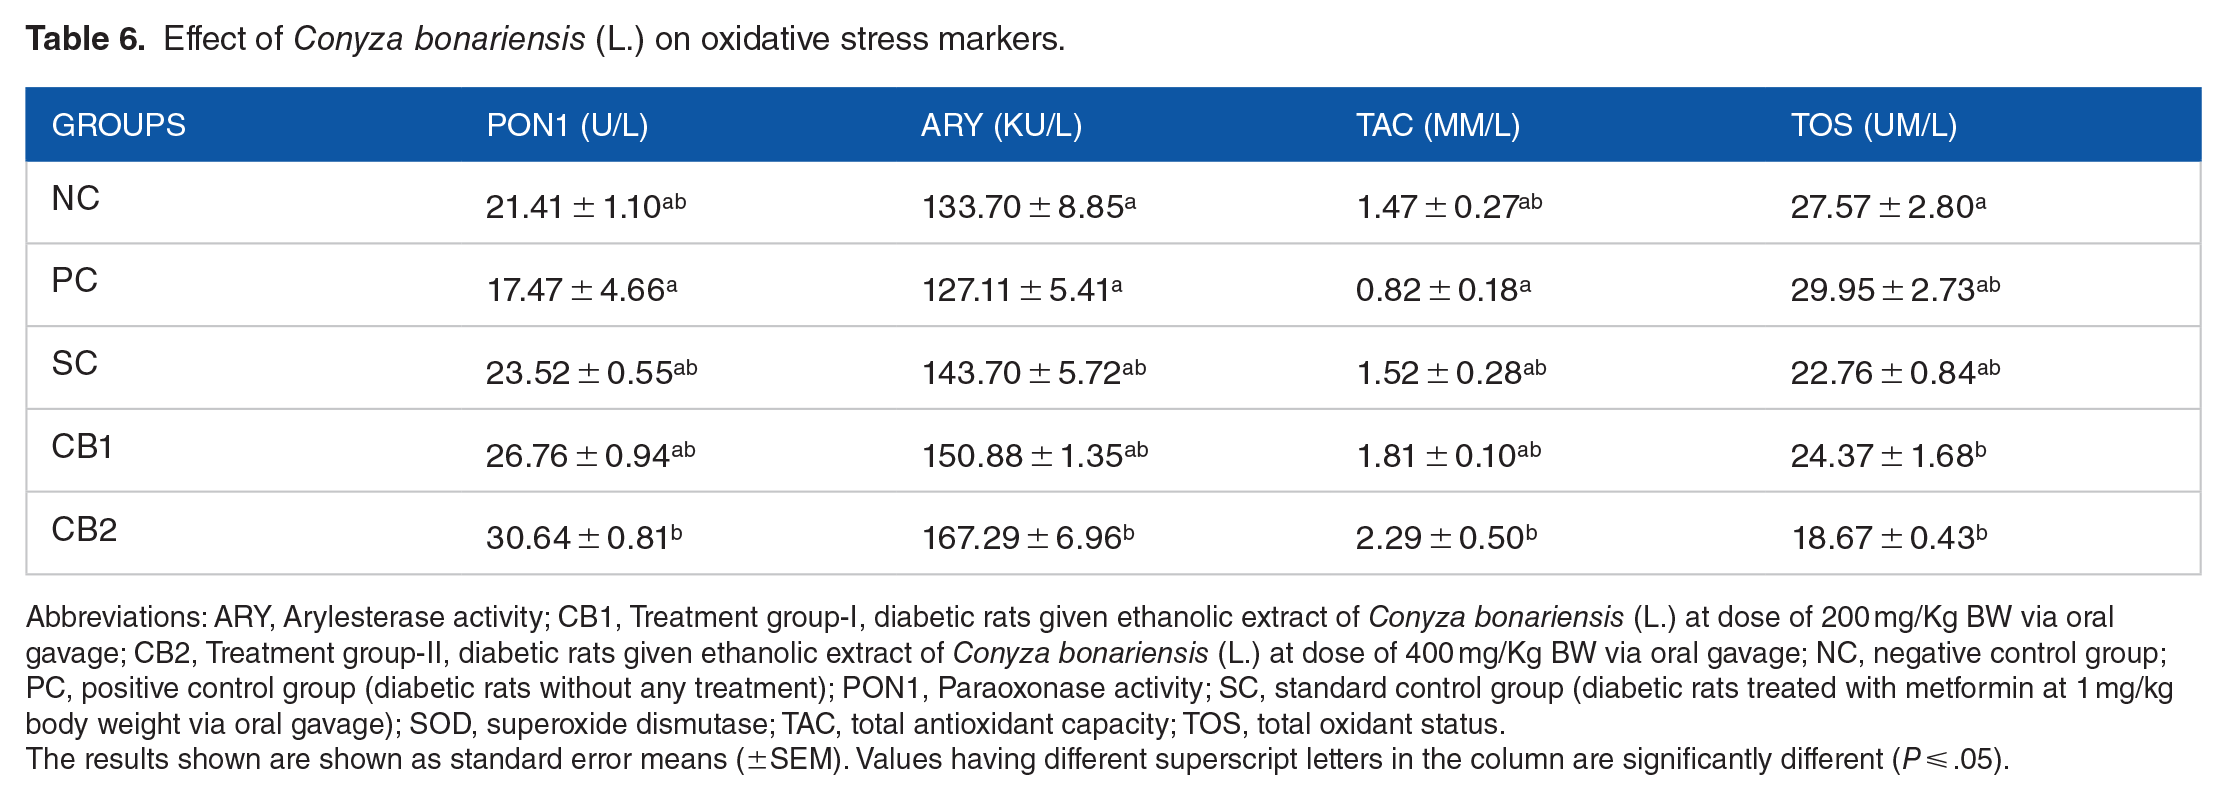
Abbreviations: ARY, Arylesterase activity; CB1, Treatment group-I, diabetic rats given ethanolic extract of Conyza bonariensis (L.) at dose of 200 mg/Kg BW via oral gavage; CB2, Treatment group-II, diabetic rats given ethanolic extract of Conyza bonariensis (L.) at dose of 400 mg/Kg BW via oral gavage; NC, negative control group; PC, positive control group (diabetic rats without any treatment); PON1, Paraoxonase activity; SC, standard control group (diabetic rats treated with metformin at 1 mg/kg body weight via oral gavage); SOD, superoxide dismutase; TAC, total antioxidant capacity; TOS, total oxidant status.
The results shown are shown as standard error means (±SEM). Values having different superscript letters in the column are significantly different (P ⩽ .05).
Effect of Conyza bonariensis (L.) on glucose
The mean serum levels of glucose were found to be significantly (P ⩽ .05) increased in the PC (182.42 ± 15.48b mg/dL) group as compared with NC (124.06 ± 9.59a mg/dL) group (Figure 5). Glucose levels dropped significantly (P ⩽ .05) when animals were treated with metformin in the SC group (125.90 ± 11.53a mg/dL) and with ethanolic extract of Conyza bonariensis (L.) in the CB1 (125.88 ± 9.58a mg/dL) and CB2 (109.23 ± 2.76a mg/dL) groups relative to the PC (182.42 ± 15.48b mg/dL) group (Figure 5).

Effect of Conyza bonariensis (L.) on glucose. The results are shown as standard error means (±SEM). Bars with different superscript letters are significantly different (P ⩽ .05).
Effect of Conyza bonariensis (L.) on carbohydrate enzymes
Pyruvate Kinase, Glucose 6 phosphate dehydrogenase, and phosphofructokinase levels in serum were increased in the CB1 (31.85 ± 0.56b ng/mL, 6.36 ± 0.54ab ng/mL, 26.09 ± 0.90b ng/mL, respectively) and CB2 group (35.72 ± 4.56b ng/mL, 8.74 ± 0.93b ng/mL, 38.06 ± 1.52c ng/mL, respectively) as compared with the PC (14.68 ± 4.54a ng/mL, 1.61 ± 0.62a ng/mL, 11.03 ± 1.77a ng/mL, respectively) group (Figure 6A to D). However, the difference was nonsignificant only in the case of serum levels of Glucose 6 phosphate dehydrogenase in the CB1 group as compared with NC, PC, and SC.

Effect of Conyza bonariensis (L.) on carbohydrate metabolic enzymes. (A) Pyruvate Kinase. (B) Glucose 6 Phosphate Dehydrogenase. (C) Phosphofructokinase. (D) Glucokinase. The results are shown as standard error means (±SEM). The results shown are shown as standard error means (±SEM). Bars with different lowercase letters are significantly different (P ⩽ .05).
Effect of Conyza bonariensis (L.) on lipid profile
Total cholesterol, LDL and triglyceride levels (mg/dL) were significantly (P ⩽ .05) decreased in CB1 (229.64 ± 6.83a, 76.98 ± 9.16a, 161.39 ± 3.44a, respectively) and CB2 (184.35 ± 28.00a, 67.04 ± 5.80a, 134.52 ± 15.30a, respectively) group as compared with PC (324.48 ± 21.69b, 200.01 ± 25.61b, 230.93 ± 20.26b, respectively) group (Figure 7A, B, D). Whereas serum HDL levels were significantly increased in the SC (112.28 ± 2.87b mg/dL), CB1 (120.37 ± 4.69b mg/dL) and CB2 (108.07 ± 8.98b mg/dL) groups as compared with the PC (78.28 ± 6.11a mg/dL) and no significant change was observed among NC, CB1 and CB2 groups (Figure 7 C).
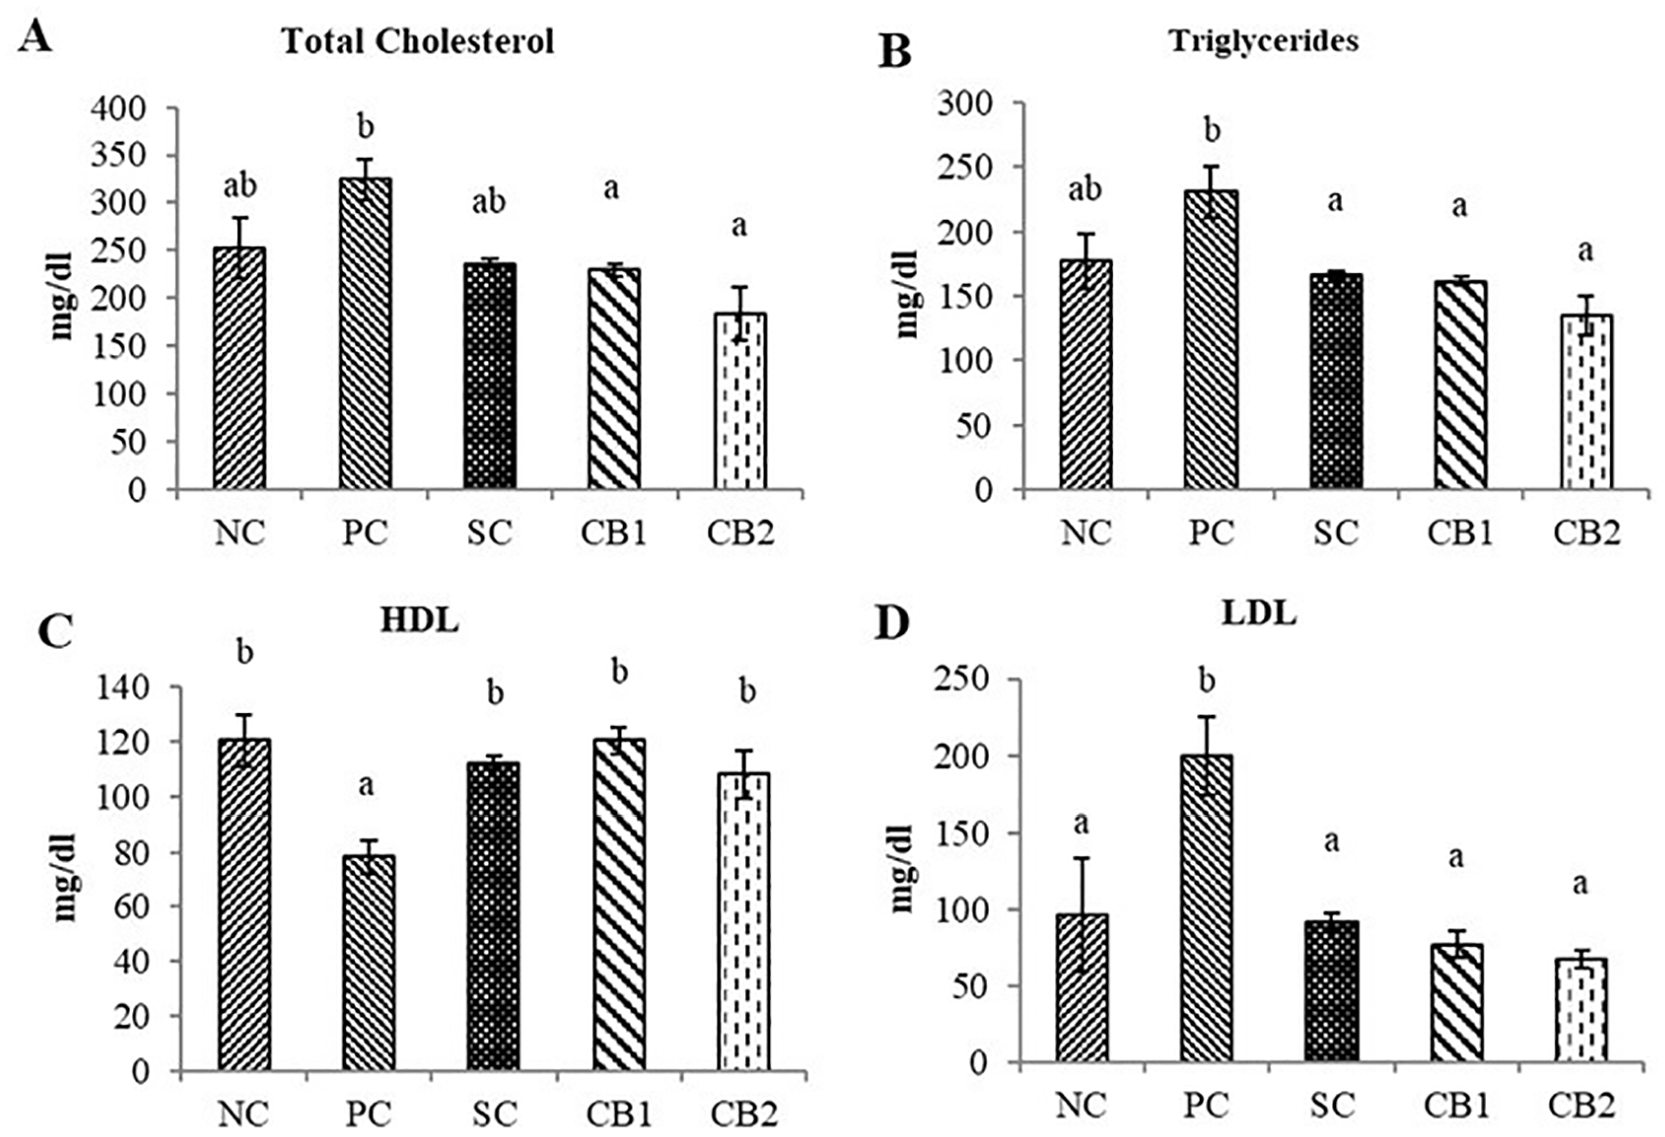
Effect of Conyza bonariensis (L.) on lipid profile. (A) Total Cholesterol (B) Triglycerides (C) High Density Lipoproteins (HDL) (D) Low Density Lipoproteins (LDL). The results are shown as standard error means (±SEM). Bars with different letters are significantly different (P ⩽ .05).
Effect of Conyza bonariensis (L.) on thyroid hormones
Mean values of T3 and TSH were significantly (P ⩽ .05) increased in the CB1 (59.80 ± 1.68b pg/mL and 113.39 ± 2.43b ng/mL, respectively) CB2 (76.15 ± 5.50b pg/mL and 133.09 ± 2.69b ng/mL, respectively) group as compared with PC (34.01 ± 3.00a pg/mL and 46.08 ± 24.59a ng/mL, respectively) group. Serum T4 was also increased in the CB2 group but the increase in serum T4 levels in CB1 was not significant when compared with the PC group (Table 7).
Effect of Conyza bonariensis (L.) on thyroid hormones and amylin and leptin.

Abbreviations: CB1, Treatment group-I (Diabetic rats given ethanolic extract of Conyza bonariensis (L.) at dose of 200 mg/Kg BW via oral gavage); CB2, Treatment group-II (Diabetic rats given ethanolic extract of Conyza bonariensis (L.) at dose of 400 mg/Kg BW via oral gavage); NC, negative control group; PC, positive control group (diabetic rats without any treatment); SC, standard control group (diabetic rats treated with metformin at 1 mg/kg body weight via oral gavage); T3, triiodothyronine; T4, thyroxin; TSH, thyroid stimulating hormone.
Data are expressed as standard error means (±). Values having different lowercase letters in a column are significantly different (P ⩽ .05).
Discussion
Natural antioxidants in medicinal plants helps in the adsorption and neutralizing of free radicals produced as result of cellular oxidative stress. Phytochemicals have the potential to treat human ailments and are used in conventional herbal medicine. 3 This study has found that EthCb possessed the highest phenolic contents as compared with the MthCb and AqCb extracts. Similarly, the total flavonoid contents (TFC) were also highest in the EthCb extract in contrast to the MthCb and AqCb extracts. A previous study reported that the ethanolic extract of Conyza bonariensis has maximum antioxidant activity due to its high total phenolic contents. 17 As the exact amount of phenolic and flavonoid contents in the plant extracts cannot be revealed through the colorimetric assays. 27 High-profile liquid chromatography (HPLC) was employed in this study to quantify the exact amount of phenolic and flavonoid contents in the plant extracts (Table 2). All 3 flavonoid components and phenolic acids were identified in all 3 extracts. But the chlorogenic and gallic acids were present in the highest concentrations in EthCb. Strong antioxidant properties are associated with phenolic compounds and their ability to scavenge free radicals.28-30 The in vitro antioxidant capacity of the extracts was assessed using the DPPH, FRAP, and ABTS assays in this study. These assays demonstrated a substantial level of antioxidant potential of the extracts used. In relative comparison with MthCb and AqCb, the EthCb has demonstrated the most potent antioxidant activity. The possible in vivo antioxidant and antidiabetic effects of ethanolic extract of Conyza bonariensis were assessed in a type 2 diabetic rat model. The total antioxidant capacity (TAC) in the CB2 group (high dose treatment group) was significantly increased. The total oxidant status (TOS) was significantly reduced in both treatment groups (CB1 and CB2) as compared with the PC group. The antioxidant activity of Conyza bonariensis (L.) was explored previously using the DPPH and FRAP methods. 31 Ethyl acetate extract of Conyza bonariensis (L.) was found to possess the highest DPPH radical scavenging capacity and lowest ferric tripyridyltriazine complex. Another study has also reported the highest antioxidant activity of Conyza bonariensis (L.) in its ethyl acetate extract in terms of FRAP as compared with its methanolic, n-hexane, chloroform, and n-butanolic extract. 32 Strong positive association exists between phenolic and flavonoid contents with antioxidant activity. 33 Alcoholic extracts (methanol or ethanol) are considered good solvents to extract phenolic and flavonoid contents from various medicinal plants.34-37 This study by employing DPPH•, FRAP, and ABTS assays suggested a close relationship between total flavonoid and phenolic contents of the extracts with antioxidant activity. We conclude that the higher the values of TPC and TFC, the higher the antioxidant activity in terms of DPPH•, FRAP, and ABTS values. Earlier, Chandra et al. 38 demonstrated that total phenolic content causes about 61% to 75% antioxidant potential in the tower garden and field-grown plants. A positive Pearson correlation of DPPH• scavenging potential was seen with total phenolic and total flavonoid content. While the FRAP was positively correlated with DPPH scavenging activity. 31
Our in vitro results also demonstrates that the EthCb induced the maximum inhibition of α-amylase and α-glucosidase enzyme activities compared with MthCb and AqCb. The correlation of TFC and TPC with the antidiabetic potential of the extracts has shown that the greater the amount of TFC and TPC, the greater will be the ability of the extracts to inhibit α amylase and α glucosidase enzyme activities. Although the exact mechanisms of inhibition of these enzymes by polyphenols are poorly understood, it is speculated that flavonoids may have the ability to induce conformational modifications in the structure of these enzymes and thus restrict their activity. 10 Narkhede et al. 39 stated that gallic acid could block the activity of α-amylase. EthCb in this study has high levels of gallic acid and thus exhibits higher α-amylase and α-glucosidase inhibition as compared with the MthCb and AqCb which have low amounts of gallic acid.
In this study, the enzyme activities of phosphofructokinase, glucose 6-phosphate dehydrogenase and pyruvate kinase declined significantly in the PC group as previously reported by Nordlie et al, 40 and Abdel-Rahim et al. 41 However, the diabetic rats treated either with ethanolic extract of Conyza bonariensis (L.) or metformin showed a significant increase in serum glucose-6-phosphate dehydrogenase which might increase the influx of glucose into the pentose monophosphate shunt and might result in an increased production of the reducing agent, NADPH, with a concomitant decrease in oxidative stress. 42 The decrease in the activity of pyruvate kinase in diabetic rats in this study readily accounts for the decreased utilization of glucose (glycolysis) and increased hepatic production of glucose (gluconeogenesis) indicating that these 2 pathways are altered in the type 2 diabete. 43 In this study, the rats treated with ethanolic extract of Conyza bonariensis (L.) in CB1 and CB2 groups and metformin in SC group exhibited an increase in the pyruvate kinase activity. Implying a beneficial role of Conyza bonariensis (L.) supplementation in reducing hyperglycemia in type 2 diabetes.
In this study levels of T3, T4, and TSH were decreased in the untreated diabetic group (PC). The decrease in T3 may be explained by impaired T4 conversion into T3 which is involved in the improvement of glycemic control. 44 In previous studies, a significant decrease in the level of serum thyroid hormone was observed in experimentally induced hyperglycemic rats.45,46 However, serum T3, T4 and TSH levels were improved in the treated groups in comparison with the PC group. The exact mechanism through which Conyza bonariensis (L.) supplementation restored the serum T3, T4, and TSH levels remains to be investigated. Conyza bonariensis (L.) supplementation in this study increased the HDL levels with a decline in the plasma lipid levels. High flavonoid contents in Conyza bonariensis (L.) might be responsible for this dose-dependent effect in the treated groups.47-49
Conclusions
This study demonstrates in an in vitro setting that the ethanolic extract of Conyza bonariensis (L.) has the maximum antioxidant and antidiabetic potential due to the higher TFC and TPC values as compared with methanolic and aqueous extracts. The ethanolic extract also exhibited improved antioxidant enzyme activity. A higher concentration of the ethanolic extract of Conyza bonariensis (L.) is found to be more potent in ameliorating the glucose level, lipid profile, and thyroid profile in type 2 diabetic rat model. These results may emphasize the beneficial influence of natural antioxidants present in the Conyza bonariensis (L.) by improving thyroid hormone levels and decreasing hyperlipidemia associated with diabetes mellitus in an animal model. Further studies employing gene and protein expression analysis are needed to highlight the exact molecular pathways through which Conyza bonariensis (L.) exerts its antioxidant and antidiabetic actions.
Footnotes
Acknowledgements
Not Applicable.
Author Contributions
IM, HA, and MNF conceptualized the study. IM and JN performed the in vitro antioxidant and antidiabetic analysis. HM, GH, and MUI helped in the plant extraction and phytochemical analysis. IM, SI, and HM performed the animal experimentation and the subsequent assays. IM and SI participated in the technical writing of the manuscript. HA, SI, and MUJ conducted a critical review and editing of the manuscript. All authors read and approved the final manuscript.
Declaration of conflicting interests:
The author(s) declared no potential conflicts of interest with respect to the research, authorship, and/or publication of this article.
Funding:
The author(s) received no financial support for the research, authorship, and/or publication of this article.
Ethics Approval and Consent to Participate
The study has been approved by the Directorate of Advance studies, Government College University, Faisalabad, Pakistan, GCUF/DAS/19/2469.
Consent for Publication
All authors give their consent for this manuscript to be published.
Availability of Data and Materials
The data sets used or analyzed during the current study are available from the corresponding author on reasonable request.