
Abstract
De novo assembly of transcriptomes from species without reference genome remains a common problem in functional genomics. While methods and algorithms for transcriptome assembly are continually being developed and published, the quality of de novo assemblies using short reads depends on the complexity of the transcriptome and is limited by several types of errors. One problem to overcome is the research gap regarding the best method to use in each study to obtain high-quality de novo assembly. Currently, there are no established protocols for solving the assembly problem considering the transcriptome complexity. In addition, the accuracy of quality metrics used to evaluate assemblies remains unclear. In this study, we investigate and discuss how different variables accounting for the complexity of RNA-Seq data influence assembly results independently of the software used. For this purpose, we simulated transcriptomic short-read sequence datasets from high-quality full-length predicted transcript models with varying degrees of complexity. Subsequently, we conducted de novo assemblies using different assembly programs, and compared and classified the results using both reference-dependent and independent metrics. These metrics were assessed both individually and combined through multivariate analysis. The degree of alternative splicing and the fragment size of the paired-end reads were identified as the variables with the greatest influence on the assembly results. Moreover, read length and fragment size had different influences on the reconstruction of longer and shorter transcripts. These results underscore the importance of understanding the composition of the transcriptome under study, and making experimental design decisions related to the need to work with reads and fragments of different sizes. In addition, the choice of assembly software will positively impact the final assembly outcome. This selection will affect the completeness of represented genes and assembled isoforms, as well as contribute to error reduction.
Keywords
Introduction
High-throughput sequencing of RNA (RNA-seq) 1 has become the preferred method to reveal the complex landscape and dynamics of transcriptomes since the advent of next-generation sequencing (NGS) platforms.2,3 One of the most popular use cases is to generate a catalog of transcripts without genomic information and to study gene expression using short-read sequencing.4,5 In this process, RNA molecules are isolated, enriched and reverse transcribed into complementary DNA (cDNA). The cDNA sequences are fragmented, random primed, amplified by polymerase chain reaction (PCR), and sequenced. 6 Fragmentation and PCR amplification are due to the technical constraints inherent in short-read sequencing equipment. The result of sequencing is millions of short reads containing a mixture of fragments corresponding to different parts of different transcripts. The sequencing data obtained for each study can be affected by different variables grouped as coming from sequencing artifacts, 7 experimental design, 6 and biological complexity. 8 For example, the alternative splicing level produces transcript isoforms and results in the appearance of very similar short reads from shared exons. 9 In the presence of a genomic reference or transcript catalog, the process of expression quantification involves mapping and counting the number of sequencing reads coming from each gene.
In the absence of a genomic reference, the short reads must be assembled to recreate the sequences from which they originated. Ideally, this process can be performed taking into account all the issues mentioned above to obtain full-length transcripts (or isoforms). This is the computationally demanding task of transcriptome assembly10,11 and it must be performed using only the information contained in the reads. The completeness and quality of the final assembly are very important as they affect all subsequent steps of the data analysis, eg, annotation12,13 or quantification of the expression level.14,15 The assembly process is typically accomplished by analyzing overlaps to concatenate the reads into extended contiguous sequences or contigs. In most cases, researchers achieve this concatenation using De Bruijn graphs. This graph is a compact representation of a series of nucleotide-overlapping k-mers of reads that form a directed graph structure. A k-mer is a substring of size k derived from reads, 1 nucleotide shifted at a time, resulting in a total of N − k + 1 k-mers of size k from a read of size N. In the De Bruijn graph, each node represents a k-mer, and the edges between the nodes indicate overlaps of size k-1 between neighboring k-mers. The De Bruijn graph-based assembly is sensitive to the k-mer size, since it determines the set of assembled contigs by controlling the complexity of the graphs. In general, the choice of k-mer size has a varying impact on different sizes and abundance in isoform reconstruction.16-18
Certainly, the assembly process is not error-free19,20 and the quality of assembly can be assessed from different perspectives. Recent research has found species-specific differences in the performance of assembly tools. It has also been described that no tool delivered the best results for different data sets; 21 suggesting that there is a strong dependence on the conformation of each particular sample.
To our knowledge, most research has focused on assembly methods rather than the impact of sequencing data complexity on de novo assembly. In the last decade, research has been conducted to analyze the effect of some variables, such as sequencing depth, 22 error correction, 23 and read length. 9 These studies highlight the importance of selecting appropriate values for these variables, taking into account the objectives of the experiment and the characteristics of the species studied. Here, we analyze the impact of several variables that compound the complexity of RNA-Seq data and assess how these variables affect the completeness and quality of the assembly. Understanding the impact of each variable is critical in the initial stages of the project design to adequately account for them. To achieve this, we generated simulated Illumina RNA-Seq data sets and used a set of open-source de novo assembly tools to assess possible different outcomes. To evaluate the accuracy of each assembly and identify the commonalities between them, we compared the results using multiple quality metrics. In addition, we investigated which metrics best predict assembly accuracy to develop a criterion that can be applied in practice and real-world experimental designs.
Materials and Methods
A simulation test was performed by simulating Illumina data to examine the impact of read length, fragment size, alternative splicing, and dynamic expression range on the de novo assembly of RNA-Seq data. The test comprised the following steps: (1) generation of simulated data; (2) assembly of transcripts using free available software; (3) calculation of metrics for quality assessment; and (4) analysis of the obtained metrics.
Generation of simulated data
The data generation process was implemented in an in-house Python script starting with random sampling from the Homo sapiens genome obtained from Ensembl (GRCh38.p12), 24 followed by simulation of nonstranded sequencing reads. This version of the H sapiens genome has 54 644 genes with 160 474 transcripts (113 620 mRNAs and 46 854 ncRNAs) conformed by 408 659 exons. The alternative splicing events can be estimated from approximately 95% of multi-exon genes. 25 During the sampling process, 3000 genes were randomly selected from the structural annotation of the genome for each sample. The degree of alternative splicing in the samples was controlled by the maximum number of isoforms extracted from those available for each gene in the structural annotation, and by considering the desired level of alternative splicing. In the simulation process, the read length, fragment size, and transcript expression were controlled by the art_illumina software. 26 A lognormal distribution was used to generate expression values with a consistent mean and a variable standard deviation to allow the desired dynamic range of expression. 27 The generated datasets and their characteristics are shown in Table 1. Each dataset was generated by maintaining all variables constant except the tested variable. Three independent replicates were performed for each condition. Gene duplications were eliminated by employing the Duplicated Gene Database (DGD) 28 and keeping only 1 locus from each family, which provided the largest predicted transcript. The gene deduplication process using DGD prevented the presence of gene families from contributing to the complexity of the datasets. Consequently, the bias due to gene duplications was not included in the effect of each variable tested.
Parameter setup for generating simulated datasets without sequencing errors.

The selected variables were measured to assess the nature and complexity level of the simulated datasets: (1) quality of reads, (2) number of sequencing errors, (3) dynamic expression range, (4) degree of alternative splicing, (5) size of reads and fragments (PE), (6) sequencing depth of transcripts, and (7) random fragment selection. The evaluation of the sequencing quality, read length, read duplications, and random sampling were performed using the figures obtained from FastQC 29 and MultiQC. 30 However, the reads were globally mapped to the reference transcripts using Bowtie2 31 to determine the number of sequencing errors and indels. Furthermore, the expression level was estimated by counting and normalizing the mapped reads/fragments for each transcript, with the fragments per kilobase million (FPKM) values acquired using RseQC. 32
The sequencing errors were quantified using mpileup 33 and VarScan. 34 A sequencing error at a position was defined when at least 1 nucleotide of a read differed from the reference transcript. The BAM files were used to analyze sequencing depth and fragment size (PE) with RseQC. The differences in alternative splicing levels were assessed by obtaining all possible alignments of at least 100 bps between the reference transcripts using nucmer. 35
Assembly of transcripts using 6 free available software
The assembly process was performed using the 6 most popular assembly tools with default parameters: Trinity, 36 Bridger, 37 Oases, 16 Trans-abyss, 17 SOAP, 38 and IDBA-Tran 39 with 2 k-mer values: 25 and 31 for the first; 23 and 31 for the second; and 23, 35, 47, and 59 for the others. The selected k-mer size ranges relate to sizes commonly used in practice for short-read assemblies. Specifically, for Trinity and Bridger, only sizes up to 31 were tested because it is the maximum value allowed by the programs. Other commonly used assembly tools were tested, including Shannon, 40 BinPacker, 41 and rnaSPAdes 42 (Supplemental Table 1).
Calculation of metrics for quality assessment
A set of 12 assembly metrics specifically interesting to our study were selected based on previously defined metrics from the literature and divided into 2 classes: 6 reference-based (RB) and 6 reference-free (RF).9,18,20,43-47 The RB metrics compare the nucleotide composition of the contigs against the reference transcripts rather than the complete genome sequence. The selected RB metrics were chosen to evaluate the assembly content, focusing on both completeness and correctness. We curated a concise set of metrics to assess reconstruction and nucleotide-level accuracy. We prioritized error quantification metrics such as transcript coverage, collapsed contigs, and fragmented transcripts (Table 2). When selecting metrics, we excluded metrics that only consider amounts of contigs and their sizes. The RB metrics were computed using reciprocal BLAT 48 alignments between the reference transcripts and the contigs, along with an internal Python script that considered only alignments with an identity greater than 95%. The alignment length was determined by adding the length of matches, mismatches, repmatches (matches on repetitive regions), and indels from the results of BLAT. Based on the alignment length, we defined a correct nucleotide as a nucleotide with an exact match within an alignment that covers at least 50% of a contig. In addition, the metric “70% reconstructed transcripts” was calculated. This measurement represents the percentage of reference transcripts that have an alignment covering over 70% of both the transcript and the contig, with an indel length of less than 1% relative to the alignment length.
Reference-based metrics definition.
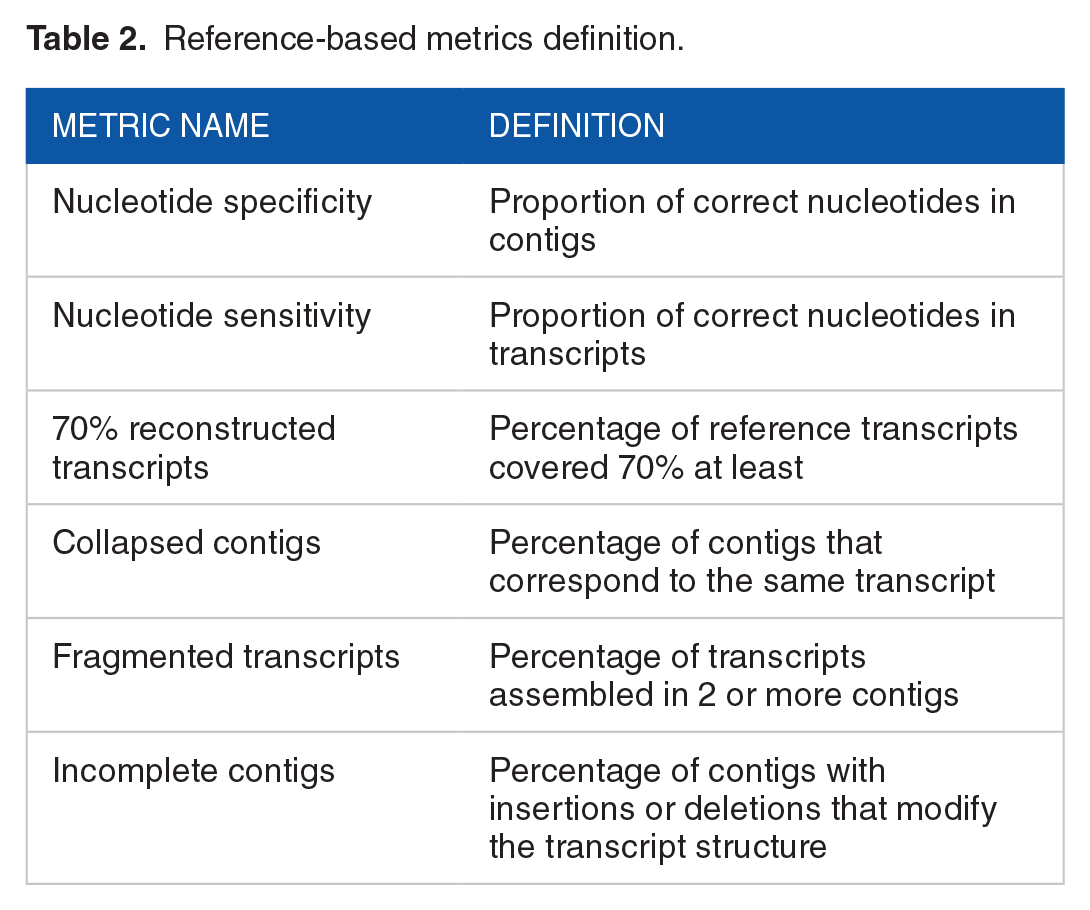
Regarding collapsed contigs, a contig is considered collapsed if it aligns with 2 or more transcripts with at least 50% coverage over the contig and 40% coverage over each transcript. In addition, the alignments between the contig and the transcripts must overlap by more than 80%. A transcript was classified as fragmented if it is aligned with 2 or more contigs with at least 50% coverage of each contig and 10% coverage of the transcript. The alignment between the transcript and contigs must have less than 5% indels. Furthermore, the alignments must overlap by less than 20% but collectively cover more than 50% of the transcript. Finally, a contig was categorized as incomplete if it matched at least 50% of a transcript but more than 5% of the alignment length composed of indels. To be classified as 1 of these 3 types of erroneous contigs, the contig must not have been previously classified as a transcript reconstruction with 70% coverage. For the datasets containing alternative splicing, in addition to quantifying transcript reconstruction, we also calculated the percentage of assembled genes. In this case, a gene was considered as assembled if at least 1 transcript from that gene was classified as 70% reconstructed.
RF metrics (Table 3) were evaluated using the values obtained from 2 specific packages: RSEM-EVAL 46 and Transrate. 47 The RSEM-EVAL package was used by extracting the general score provided by the DETONATE software. However, 5 statistics were considered with the Transrate package: assembly score, percentage of mapped fragments, number of potential bridges, percentage of uncovered contigs, and percentage of segmented contigs. Transrate statistics are obtained by mapping reads to contigs with SNAP, 49 assigning multimapping reads with Salmon, 50 and finally checking alignments with transrate-tools. 51 It is worth noting that RF metrics were calculated exclusively for paired-end datasets, as Transrate only supports this type of reads.
Reference-free metrics definition.

Analysis of the obtained metrics
The 2 groups of evaluation metrics (RB and RF) were analyzed using multivariate and correlation methods. The average values of each metric were compiled into matrices for each assessed variable. Only the average values were used because the standard deviations were very small in all cases (considering all metrics, approximately 95% of the samples showed a standard deviation of less than 5% from the average). These matrices were examined using the R package “GGally,” 52 whereas correlations between groups and within groups were estimated using the Spearman coefficient. The correlation coefficients were estimated using the results metrics for all samples together, encompassing all variables and their levels, as well as all assemblers and k-mer sizes. Analyzing all the samples collectively enabled us to derive robust correlations between metrics, independent of the variable or assembler utilized. Principal component analysis (PCA) was performed separately for the 2 classes of metrics using the R package “stats.” 53 Regarding PCA, only the results with the extreme k-mer values (maximum and minimum) were used for each of the assembly software to reduce the complexity of the plot. In addition, the metric values were scaled previously. PCA was chosen as a methodology to observe the evaluation metrics collectively, rather than viewing them separately in individual figures.
An analysis was conducted to examine the relationship between the reconstruction level of the transcripts and fragment sizes prior to sequencing. The average and standard deviation of “70% reconstructed transcripts” were calculated across the replicates for each 5% percentile of the length distribution of reference transcripts. The impact of the fragment size on assembling transcripts of different lengths was assessed by simulating 4 groups of datasets with varying standard deviation values for the fragment size distribution (Supplemental Table 2). Finally, a series of graphs was generated to visualize the reconstruction level for different forms of fragment size distributions (represented by different standard deviation values) using cumulative curves based on transcript length.
The “expression range” dataset was analyzed by calculating the average and standard deviation of the “70% reconstructed transcripts” across replicates for each 5% percentile of expression. This analysis aimed to investigate the relationship between dynamic expression range and k-mer size. These data were shown in a series of cumulative plots depicting the reconstruction level per expression percentile, which was normalized relative to the total reconstruction level.
Results
Simulated dataset quality and distribution
Initially, we verified the quality and composition of our simulated datasets. Sequencing quality, random fragment sampling, GC content, and read duplication degree analyses were performed based on the FastQC and MultiQC plots. For all datasets, the sequence quality profile, as determined by read position, showed a quality value greater than 40 with extremely low variability. The nucleotide content per read position was independent of the position, with a uniform distribution of 25% for each nucleotide. This indicates accurate random sampling at the read positions. The GC content histograms displayed an expected Gaussian distribution with a mean close to 50% (Supplemental Figure 1).
Low read duplication rates were observed (Supplemental Figure 2), generally below 5%, except in the presence of alternative splicing. In datasets where all reference genes had 2 or more isoforms, duplication values were found to be between 10% and 20%. Increased duplication was also present in the “expression range” dataset with the highest dynamic range, where duplications reached nearly 15%. This was attributable to sampling limitations, as the highly expressed transcripts had a restricted number of possible distinct fragments.
Bowtie2 yielded mapping rates of 100% in all datasets with multimapping values below 5% and equal assignments to both strands. The multimapping rates increased up to 75% in datasets with the highest degree of alternative splicing. Furthermore, no sequencing errors were detected in any of the datasets. The 100% mapping rates were a result of intentional exclusion of sequencing errors. Although this scenario does not necessarily reflect real-world conditions, it was important for our analysis as it allowed us to avoid bias due to sequencing errors. All curves for depth as a function of relative transcript position were as expected, with a plateau in the central region and drops at the ends. However, for the curves that involve the “fragment size” variable, the depth also decreased in the central regions (Supplemental Figs. 3 and 4). In these cases, the central depth drops were deeper and wider with increasing fragment size. These effects of depth drops at the ends and in the middle of transcripts were defined as sampling issues. The sampling issues were caused by the decreasing number of possible fragments in these regions. In paired-end datasets, the depth drop effect occurred mainly in the middle of transcripts whose size is less than twice the fragment size. In the “alternative splicing” datasets, the total number of alignments obtained between pairs of different transcripts using nucmer was 60 000, 120 000, and 180 000 in the datasets with up to 4, 7, and 10 transcripts per gene, respectively. Datasets without alternative splicing had a number of transcripts pairwise alignments of 5000 or less. The fragment sizes obtained were as expected in all cases (Supplemental Figure 5).
Finally, the histograms of the FPKM values followed the expected distributions. For datasets lacking the expression range effect, they showed similar shapes, with close expression values and smaller expression ranges between different samples and replicates. In contrast, the FPKM distribution in “expression range” datasets showed different shapes, expression values, and dynamic ranges between samples (Supplemental Figure 6).
Overall metrics analysis
Figure 1 and Supplemental Figure 7 summarize the effects of the assessed variables on the assembly results. Two groups of assembly programs were distinguished based on their behavior in the evaluation metrics. Group “A,” which included the results from Trinity, Oases, and Bridger, had higher rates of collapsed and incomplete contigs, lower fragmentation rates, and higher percentages of transcripts reconstructed at 70%. In contrast, Group “B”—which included the results of SOAP, Trans-abyss, and IDBA-Tran— had higher fragmentation rates and lower percentages of reconstructed transcripts. The differences between the 2 groups become even more pronounced, particularly in the presence of alternative splicing. For other commonly used assemblers that were tested but not included in the analysis, we observed similar results that were within the limits of those originally included. rnaSPAdes behaved similarly to the tools in Group “A” (Sup Table 1), while Shannon and BinPacker showed similar behavior to the tools in Group “B” (Data not shown).

Boxplots of the reference-based metrics (rows) for each dataset (columns), separated by assembly program. Each boxplot for every assembler includes the results of the metrics for all samples combined, covering all levels of each variable and all k-mer sizes. For the datasets with alternative splicing, there is a clear difference between Group “A” (Trinity, Oases, and Bridger) and Group “B” (SOAP, Trans-abyss, and IDBA-Tran), especially for the metrics: “Specificity,” “Incomplete contigs,” “Collapsed contigs,” and “fragmented transcripts.”
We examined the correlation coefficients across all assessed variables for the metrics separately for each group: RB (Supplemental Figure 8) and RF (Supplemental Figure 9). However, we found remarkable correlation coefficients (greater than 0.8 or lower than −0.8) between RB and RF metrics (Supplemental Figure 10) included “70% reconstructed transcripts” with “RSEM assembly score,” “Transrate percentage of mapped fragments,” “Transrate number of potential bridges,” and “Transrate percentage of segmented contigs”; and “Fragmented transcripts” with “RSEM assembly score” and “Transrate percentage of mapped fragments.” The positive correlation of “Transrate percentage of mapped fragments” with “70% reconstructed transcripts” corresponded to the fact that the presence of a greater number of reconstructed transcripts increased the mapping percentages. Moreover, the fragmentation of contigs produced lower mapping rates because only part of the reads could be aligned, resulting in the observed negative correlations of “Transrate percentage of mapped fragments” and “Fragmented transcripts.” Finally, “RSEM assembly score” correlated positively with “70% transcripts reconstructed” and negatively with “Fragmented transcripts,” demonstrating that the generated model was informative for evaluating the assembly correctness.
Multivariate analysis
Figure 2 illustrates the results of the PCA based on the RB metrics, divided by the evaluated variable. The figures display the first and most informative 2 principal components, with vectors representing the evaluation metrics. The direction and orientation of the vectors indicate the weight and sign of the metrics in each principal component. The absence of alternative splicing generally resulted in high rates of reconstructed transcripts and low error rates. Again, we could observe a clear separation into 2 groups, which was even more pronounced in the presence of alternative splicing. Group “A” tended to have higher levels of reconstruction at the expense of more incomplete and collapsed contigs. The assembly results were grouped first by assembly program and then by k-mer size when evaluating expression range and read length (Figure 2B and C). This suggests that these variables had a smaller effect on the results, especially at higher k-mer sizes. For the variable read length, the worst results were consistently observed with the smallest read length (100 bps), while read lengths of 150, 200, and 250 bp had similar outcomes. Finally, when analyzing the variable fragment size with a standard deviation of zero (Figure 2D and E), we found that the results improved with smaller fragment lengths, regardless of whether alternative splicing was present or not.

PCA plots for reference-based metrics divided by evaluated variables. The average scaled values of each metric and only the results from the extreme k-mer sizes (maximum and minimum) are included. The direction and orientation of the vectors indicate the weight and sign of the metrics in each principal component. A clear separation between the groups can be observed, especially in the presence of alternative splicing (A and E), with distinctions based on “fragmented transcripts” as opposed to “70% reconstructed transcripts” mainly represented on the PC1 dimension. The metrics “Incomplete contigs” and “collapsed contigs” appear to be related. For the expression range (B) and read length (C) variables, the results were primarily grouped by assembler and then by k-mer size. For the fragment size variable (D and E), better results were obtained with smaller fragment lengths.
Figure 3 shows the PCA using the RF metrics. The results were similar to those obtained with the RB metrics. Better results corresponded to higher values for “Transrate assembly score,” “RSEM assembly score,” and “Transrate percentage of mapped fragments” and lower values for “Transrate percentage of segmented contigs,” “Transrate number of potential bridges,” and “Transrate percentage of uncovered contigs.” These findings are in line with the observations made for the RB metrics in terms of assembly software and datasets. The best outcomes were obtained with the largest k-mer size and smallest fragment size, which further enhance the separation between groups in the presence of alternative splicing.

PCA plots for reference-free metrics for fragment size datasets with (A) and without alternative splicing (B). In the PC1 dimension, a clear separation was observed based on the metrics “Transrate percentage of mapped fragments,” “Transrate assembly score,” and “RSEM assembly score” as opposed to “Transrate number of potential bridges,” “Transrate percentage of uncovered contigs,” and “Transrate percentage of segmented contigs..” Better results were consistently obtained with shorter fragment lengths, regardless of the presence of alternative splicing and k-mer sizes.
Transcript and gene reconstruction evaluation
In the absence of alternative splicing, the average percentages of transcript reconstruction ranged from 62.8% to 76.5% for the minimum k-mer size, and from 73.5% to 96.3% for the maximum k-mer size. However, for the maximum degree of alternative splicing, the percentages decreased to a range of 11.6% to 46.4% for the minimum k-mer size, and of 17.9% to 48.7% for the maximum k-mer size. In the case of the fragment size dataset with alternative splicing, the reconstruction levels ranged from 14.5% to 52.5% for the minimum k-mer size, and from 21.3% to 55.6% for maximum k-mer size. In addition, the average percentage of assembled genes in the alternative splicing dataset with the higher degree of splicing ranged from 44.5% to 91.3% for the minimum k-mer size, and between 61.3% and 93.5% for the maximum k-mer size. Moreover, in the fragment size dataset with splicing, the percentage of assembled genes ranges from 36.1% to 85.3% for the minimum k-mer size and from 51.2% to 88.9% for the maximum k-mer size. The higher percentages of assembled genes corresponded to the assembly programs classified under Group “A.”
Transcript reconstruction as a function of expression level
The relative transcript reconstruction levels were plotted against the expression level (Figure 4). The plot shows the challenges of assembling low-expression transcripts. The lower expression percentiles at the minimum k-mer size for Oases, SOAP, and Trans-abyss assemblers gave the better results. However, these differences did not yield significant results, as indicated by the Mann–Whitney test. It is worth noting that Trinity and Bridger exhibit a difference of 6 and 8, respectively, between the maximum and minimum k-mer sizes, while the other programs show a difference of 36. In addition, IDBA-Tran generates the De Bruijn graph by iteratively considering a range of k-mer values and constructing the contigs stepwise. This strategy of IDBA-Tran could potentially account for the results obtained.

“70% reconstructed transcripts” per percentile of expression in the expression range dataset with a standard deviation of 1, separated by assembler. The average and standard deviation of the “70% reconstructed transcripts” across replicates for each 5% percentile of expression were calculated and relativized to the total reconstruction level. All programs had difficulty reconstructing transcripts with low expression. Oases, SOAP, and Trans-ABySS showed differences in reconstruction levels for low-expression transcripts at extreme k-mer sizes.
Transcript reconstruction as a function of transcript size
Figure 5 presented the reconstruction levels as a function of the length of the reference transcripts. It is important to note that all datasets used for Figure 5 had a standard deviation of zero for the distribution of fragment sizes. As the fragment size increased, the percentage of smaller transcripts that could be reconstructed decreased. This phenomenon was observed across different assemblers and can be attributed to the deep sampling problem illustrated in Supplemental Figure 3 and Supplemental Figure 4. For instance, at a fragment size of 400 bps, no assembler was able to reconstruct transcripts up to the 10th percentile. As the fragment sizes increased to 500 and 600 bps, this threshold shifted to the 15th percentile. Supplemental Figure 11 illustrates the reconstruction level as a function of transcript length percentile for the datasets described in Supplemental Table 2. Evidently, the reconstruction level of short transcripts improves with an increase in standard deviation, irrespective of the assembler used. For the fragment size datasets of 300 and 400 bps, a standard deviation of 50 bps or greater yielded better results compared with the best outcome achieved in the absence of a standard deviation (300 bps). Similarly, for the datasets of 500 and 600 bps, a standard deviation of 100 bps or greater led to improved outcomes compared with the scenario without a standard deviation.

“70% reconstructed transcripts” per percentile of reference transcripts length for the fragment size datasets with standard deviation of zero, separated by assembly program. The average and standard deviation of “70% reconstructed transcripts” were calculated across replicates for each 5% percentile of the length distribution of the reference transcripts. All programs had difficulty reconstructing transcripts of smaller size. Moreover, this phenomenon increases with fragment size, and extends to a greater number of lower percentiles.
Discussion
In this work, we evaluated the effects of 4 variables on the completeness and quality of transcriptome assembly using error-free simulated datasets from the Human Genome Project. We selected a set of RF and RB metrics to evaluate the assembly results. The same test was performed using rnaQUAST, 54 a newly developed tool, by computing a comprehensive set of RB metrics that yielded similar results (Supplemental Figure 12). By measuring the correlations between the used metrics, we gained further insights into which metrics are better predictors of assembly quality. Our correlation analysis revealed that the RF metrics “RSEM assembly score,” “Transrate percentage of mapped fragments,” “Transrate number of potential bridges,” and “Transrate percentage of segmented contigs” provide valuable information for predicting the degree of fragmentation and reconstruction, but not for assessing collapsed and incomplete contigs. It is important to note that recent studies emphasize the importance of using a consistent set of metrics for the systematic evaluation of assembly results.11,18 Rather than reducing the evaluation to a single value, a comprehensive study takes into account the weighting of different metrics, ensuring a most accurate assessment of assembly quality.20,44,45 This approach allows for a more comprehensive understanding of the strengths and limitations of different assembly methods. The selected metrics can then serve as valuable decision support for selecting execution parameters and comparing the results obtained from different methods. Multivariate analysis and charts have proven to be good options for looking at a set of metrics as a whole and capturing the relationships and interactions between the different metrics, providing a more holistic perspective on assembly quality. The correlated RF metrics identified in our analysis can be used to evaluate assemblies, while also considering the consistent results obtained from multivariate analysis using both RB and RF metrics.
The global analysis of the assembly metrics showed that alternative splicing had the greatest negative impact on transcript reconstruction. The quality analysis showed that variations in alternative splicing increase the biological complexity of the datasets, leading to high levels of read duplication, multimapping rates, and the number of alignments between reference transcripts. Recent studies on plant and animal genomes have shown that almost all multi-exonic genes in vertebrates and up to 70% of multi-exonic genes in plants have alternative splicing isoforms.55,56 These high percentages indicate that alternative splicing is widespread in real-world samples. However, the effects of other evaluated variables such as read length, fragment size, and expression range were comparatively more moderate. This behavior could be clearly observed in the PCA and boxplots, where the effects of splicing were stronger than the effects of k-mer size and other variables. The metrics most affected by alternative splicing were “70% reconstructed transcripts,” “collapsed contigs,” and “incomplete contigs,” which can be attributed to the challenge of resolving very similar transcripts. While the dependence of assembly on splicing level has been investigated in Chang et al 9 with similar results, the effects of variables were not independently evaluated. Increasing read length, without sequencing errors, in single-end data improved the assembly but had limitations on its length, as obtained in previous studies. 9 Individual analysis of metrics showed minimal changes between 200 and 250 bps read lengths, with some metrics showing even worse results at 250 bps. The PCA plots showed that the results at 150, 200, and 250 bps were close to each other and different from the results at 100 bps. However, these differences could deepen at the minimum contig length of 200 bps. In this case, the distribution of the transcript length should be taken into account due to sampling issues, especially for transcripts whose length is comparable to the read length.
Regarding variations in the dynamic range of expression, it was observed that samples with smaller standard deviations (0.001, 0.01, and 0.1) are minimally separated from samples with a standard deviation of 1. In general, the results improved for all the metrics as the k-mer size increased, regardless of the evaluated variable. This finding agrees with previous reports that suggest smaller k-mer sizes can theoretically only lead to better reconstruction of transcripts with low expression levels.10,17,21 However, we did not find significant differences in reconstruction for the lower percentiles of expression with respect to k-mer size. It is worth noting that previous studies have reported contrasting results,16,44 with higher reconstruction levels observed in the lower percentiles of expression, using small k-mer sizes. It is important to consider that these studies did not control for the effects of different variables on transcriptome complexity. They used real data and experimentally quantified transcript expression with RPKM. Reads per kilobase million has been shown to be inconsistent, because it does not account for all the biases inherent in transcriptomic datasets, such as relative abundance. 57 Based on our results, we can state that no differences were observed for the expression levels tested in this study, which had an average minimum expression of 1X and a 5th percentile of 10X. However, it is possible that differences in reconstruction occur at more extreme minimal expression and k-mer values.
When analyzing the assays with different fragment sizes, it became clear that the reconstruction of shorter transcripts became more difficult with increasing fragment size. This phenomenon was not specific to a particular software but rather a general characteristic of the assembly process. Despite the expectation that increasing the size of the Illumina fragments, which contain more information, would lead to better results, the evaluation metrics deteriorated in the opposite way. One would anticipate that larger fragments would allow resolution of regions that are difficult to assemble with shorter fragments, such as determining the order of exons in different isoforms.17,38 The decrease in sequencing depth within the central region of transcripts poses a limitation in correctly assembling transcripts. This sampling issue is particularly relevant when the length of transcripts is equal to or shorter than twice the fragment size. For instance, with a fragment size of 600 bps, we found this problem with transcripts of sizes around 1200 bps and smaller. It is important to note that the zero values for standard deviation in fragment size distributions do not reflect real-world scenarios, where distributions typically exhibit standard deviations around a mean value. Generally, efforts are made to minimize the standard deviations in fragment sizes, as this information is crucial for accurate assembly. By introducing a nonzero standard deviation, smaller fragments were generated, leading to increased depth uniformity and, consequently, improved assembly results. Furthermore, the observed trend indicated that larger average fragment sizes required larger standard deviation values to achieve better assembly results. Similar reasoning can be applied as a hypothesis to explain the minimum threshold of read length, considering the relative abundances of transcripts that are comparable in size with the read length. In transcriptomes with a higher abundance of smaller transcripts, optimal read lengths and fragment sizes tend to be smaller. The results of Chang et al 9 indicate that different organisms may have varying optimal read sizes for transcriptome assembly. In their study, they found that a lower threshold read size of 75 bps was sufficient for Saccharomyces cerevisiae, while H sapiens and Mus musculus required a larger read size of at least 150 bps. This read size threshold can be attributed to several factors, including differences in the distributions of transcript size between the organisms. H sapiens and M musculus have larger transcript size distributions that are similar to each other, while S cerevisiae has a comparatively smaller transcript size distribution. As a result, S cerevisiae can achieve satisfactory assembly results with shorter reads, whereas larger transcriptome organisms require longer reads to adequately capture their complexity.
Conclusions
The evaluation of de novo transcriptome assemblies has been a topic of frequent study; however, there is still a lack of knowledge regarding the impact of variables that compound these datasets on assembly results. In this study, we present a comprehensive assessment of RNA-Seq datasets complexity using 6 commonly used de novo assembly tools and controlled simulated data. We selected a set of 4 variables that affect the biological and technical complexity of the RNA-Seq data. Subsequently, we created different datasets to explore the effects of each variable and their interactions. Simulated data were employed instead of real data to ensure knowledge of the true transcriptome and maintain control over each variable’s contributions to the complexity. Although simulated datasets may not fully reflect the complexity of real transcriptomes, they are valuable for isolating and examining the individual effect of each variable on transcriptome assembly.
Among the variables evaluated, alternative splicing level emerged as the variable with the most negative impact on assembly results as it leads to increased biological complexity. While the presence of alternative splicing strongly affected the percentage of transcript reconstruction, the decreases in the percentage of reconstructed genes were not as significant. These results are relevant in real-world scenarios and should be considered in subsequent analysis steps, such as expression quantification. In general, the programs of Group “A,” consisting of Trinity, Oases, and Bridger, achieved better results in terms of reconstruction of genes and transcripts in datasets with high complexity. Among these programs, Trinity stands out as the one with the best performance in most cases. Regardless of the variable being evaluated, higher assembly results were consistently obtained when the k-mer size was increased. However, the evaluation of the degree of reconstruction as a function of expression level did not reveal a significant performance advantage for smaller k-mer sizes for the transcripts with low expression levels. It is important to note that these evaluations could be extended to include the lower extremes of the expression distributions, and adjust the relative abundance of lower-expressed transcripts, to fully understand and generalize their effects.
The multivariate analysis of RB metrics allowed the integration and comparison of results across samples. In addition, the RF metrics employed yielded similar results to the RB metrics. The RF metrics, including “RSEM assembly score,” “Transrate percentage of mapped fragments,” “Transrate number of potential bridges,” and “Transrate percentage of segmented contigs,” derived from probabilistic models of assemblies or by analyzing the results of mapping reads to contigs. Here, the RF metrics showed their potential for use in real-case comparisons. Finally, multivariate analysis proved to be a valuable tool for comparing assemblies, as it considers multiple metrics simultaneously.
Increases in read length and fragment size enhanced assembly results by providing additional information. However, difficulties arose when encountering sampling issues, particularly impacting the reconstruction of transcripts shorter than twice the read or fragment size. The sampling issues resulted from the number of fragments of size N that can be obtained from a transcript of size M. These sampling issues resulted in depth drops at the ends of the transcripts and, in the case of paired-end reads, also led to depth reductions in the middle of the transcripts. Optimal size values for reads and fragments depend on the size distribution of the transcripts, what is related to the level of alternative splicing, and the size and number of exons within the sample. Notably, the results improved by increasing standard deviation and working with fragments of different sizes. Larger reads and fragments facilitated the resolution of splicing isoforms by capturing information about the order of exons, while smaller ones were necessary to achieve uniform depth. Considering the sampling issues resulting in variations in sequencing depth across regions of transcripts, and in a real scenario where the distribution of transcript sizes is unknown, it is advisable to generate at least 2 libraries with different fragment sizes to achieve a uniform depth across transcript positions. For example, one could utilize a paired-end library with long fragment sizes (600 bps) along with another single-end library with short reads (150 bps).
Supplemental Material
sj-docx-1-bbi-10.1177_11779322241274957 – Supplemental material for Comprehensive Analysis of the Influence of Technical and Biological Variations on De Novo Assembly of RNA-Seq Datasets
Supplemental material, sj-docx-1-bbi-10.1177_11779322241274957 for Comprehensive Analysis of the Influence of Technical and Biological Variations on De Novo Assembly of RNA-Seq Datasets by Gonzalez Sergio Alberto, Rivarola Maximo, Ribone Andres, Lew Sergio and Paniego Norma in Bioinformatics and Biology Insights
Supplemental Material
sj-docx-2-bbi-10.1177_11779322241274957 – Supplemental material for Comprehensive Analysis of the Influence of Technical and Biological Variations on De Novo Assembly of RNA-Seq Datasets
Supplemental material, sj-docx-2-bbi-10.1177_11779322241274957 for Comprehensive Analysis of the Influence of Technical and Biological Variations on De Novo Assembly of RNA-Seq Datasets by Gonzalez Sergio Alberto, Rivarola Maximo, Ribone Andres, Lew Sergio and Paniego Norma in Bioinformatics and Biology Insights
Footnotes
Acknowledgements
We sincerely thank Dra. Julia Sabio y Garcia and Dr Diego Zavallo, research scientists at the Instituto Nacional de Tecnología Agropecuaria (INTA), for proofreading the manuscript. We would like to thank the reviewers for their invaluable contribution to our scientific publication.
Author Contributions
SG implemented the simulation assay, wrote the scripts and analyzed data. SG, MR, SL, and NP drafted the manuscript. MR, AR, SL, and NP collaborated with the assay design and analysis. SG, MR, and NP conceived and financed the project. All authors read and approved the final manuscript.
Declaration of conflicting interests:
The author(s) declared no potential conflicts of interest with respect to the research, authorship, and/or publication of this article.
Funding:
The author(s) disclosed receipt of the following financial support for the research, authorship, and/or publication of this article: This work was supported by PICT-2020 003507. This work used computational resources from BIOCAD, IABIMo-UDD INTA-CONICET, Programa de Sustentabilidad y Competitividad Forestal/BID 2853/Oc-Ar, Consorcio Argentino de Tecnología Genómica, MinCyT PPL 2011 004.
Supplemental Material
Supplemental material for this article is available online.
Data Availability Statement
The set of simulated datasets is available on https://doi.org/10.6084/m9.figshare.24666090. The set of in-house scripts is available on ![]() .
.
References
Supplementary Material
Please find the following supplemental material available below.
For Open Access articles published under a Creative Commons License, all supplemental material carries the same license as the article it is associated with.
For non-Open Access articles published, all supplemental material carries a non-exclusive license, and permission requests for re-use of supplemental material or any part of supplemental material shall be sent directly to the copyright owner as specified in the copyright notice associated with the article.