
Abstract
The emergence of transcriptomics, fuelled by high-throughput sequencing technologies, has changed the nature of cancer research and resulted in a massive accumulation of data. Computational analysis, integration, and data visualization are now major bottlenecks in cancer biology and translational research. Although many tools have been brought to bear on these problems, their use remains unnecessarily restricted to computational biologists, as many tools require scripting skills, data infrastructure, and powerful computational facilities. New user-friendly, integrative, and automated analytical approaches are required to make computational methods more generally useful to the research community. Here we present INsPeCT (INtegrative Platform for Cancer Transcriptomics), which allows users with basic computer skills to perform comprehensive in-silico analyses of microarray, ChlPseq, and RNA-seq data. INsPeCT supports the selection of interesting genes for advanced functional analysis. Included in its automated workflows are (i) a novel analytical framework, RMaNI (regulatory module network inference), which supports the inference of cancer subtype-specific transcriptional module networks and the analysis of modules; and (ii) WGCNA (weighted gene co-expression network analysis), which infers modules of highly correlated genes across microarray samples, associated with sample traits, eg survival time. INsPeCT is available free of cost from Bioinformatics Resource Australia-EMBL and can be accessed at http://inspect.braembl.org.au.
Keywords
Background
Over the last decade, the biological sciences have been revolutionized by the development of high-throughput technologies for the study of gene expression, initially microarrays, and then next-generation sequencing (NGS). One result is the enormous quantity of data now publicly available for different cancer types, from independent researchers and consortia such as The Cancer Genome Atlas (TCGA) 1 and the International Cancer Genome Consortium (ICGC), 2 via online data repositories including Sequence Read Archive (SRA), 3 gene expression omnibus (GEO), 4 and ArrayExpress.5,6 With the continuing improvement in technologies and decreasing costs, transcriptome analysis is becoming routine in cancer research. Analysis and interpretation of large data, however, remain an ongoing challenge. 7
Many tools are available for transcriptome analysis,8–11 but their use too often remains limited to those skilled in bioinformatics because these tools have been developed as stand-alone packages, written in different programming languages with only command-line control, intended for a very specific use and/or without support for sharing input and output data with other programs.12–15 For instance, Bowtie 13 and Samtools 15 are powerful tools for processing raw sequencing reads, but are difficult for biologists to install, configure, and use, and require memory-efficient high-performance computational resources.
User-friendly web interfaces have been developed,9,10,16,17 particularly for initial data processing, file-format conversion, and downstream functional analysis. However, most such interfaces provide only a limited set of tools without automated procedures for data import; they impose file-format and data-size restrictions, are difficult to set up, are expensive to access, and/or have been developed commercially. For example, the MEME Suite 18 provides powerful tools for motif-based sequence analysis and is available free of cost to the academic community, but analyzing ChIP-seq reads and preparing data for input to MEME can be challenging for a biologist with limited informatics skills, and it can likewise be difficult to format and redirect their output to programs outside the suite, eg for druggability analysis. To address these barriers to adoption, we have developed INsPeCT. INsPeCT consists of two central types of components: primary modules for high-throughput data analysis, and secondary modules for gene-list analysis and automated network inference.
Three primary analysis modules are provided for microarray, ChIP-seq, and RNA-seq data. In the microarray data-analysis framework, for example, a researcher can import data available online, or upload data from his or her own computer; carry out differential expression analysis and use the list of differentially expressed genes to infer a gene regulatory network (GRN); conduct pathway, druggability, and survival analysis; and/or redirect interesting genes to secondary functional analyses.
Two secondary analysis modules are provided: one covers gene-list analysis, the other provides automated workflows for module-based GRN inference and analysis. The gene-list analysis framework can be used with any gene list of interest; for a given list of genes, it supports analyses including promoter-sequence extraction, druggability analysis, functional enrichment analysis, and transcription factor binding-site over-representation analysis. In the automated workflow framework, researchers can take advantage of our novel analytical framework regulatory module network inference (RMaNI) for automated identification of cancer subtype-specific transcriptional module networks, and execute the widely used weighted gene co-expression network analysis (WGCNA) method, to identify the module network associated with a clinical variable of interest, for example overall survival, relapse-free survival, or metastasis-free survival.
Individual components in INsPeCT have previously been benchmarked and/or compared with earlier tools; below, we provide leading literature citations. For example, the RMaNI framework within INsPeCT supports the inference of modules and their condition-specific regulators, based on the publicly available learning module networks (LeMoNe) algorithm, which was benchmarked against the state-of-the-art genomica and other methods.19,20 Similarly, differential gene-expression analysis methods edgeR and DEseq, used in the RNA-seq framework, were compared against each other. 21 All components in INsPeCT can be executed quickly in a fully automated way, without need for specialized informatics skills. For the options selected, INsPeCT automatically prepares the input data for downstream analyses. It provides result tables and figures in user-friendly formats, and stores these outputs as individual R objects so the user can reproduce that part of the analysis or perform additional procedures locally without repeating the complete set of operations. Overall, INsPeCT is a computational system biology tool to integrate the analysis of multiple high-throughput data types with advanced downstream functional analysis and network inference for cancer transcriptomics. Our focus on usability and accessibility will make these advanced tools available to a new audience of research scientists.
Implementation
Figure 1 shows the system architecture diagram of INsPeCT. INsPeCT is a web- based application with Drupal CMS front end and server side tools developed mainly by integrating R 22 and Bioconductor 23 packages, Python, Matlab, API-based scripts, web-automation, and web-scraping functions. The web interface to individual programs has been created using Rwui, 24 a Java-based application that uses the Apache Struts framework. The complete application is running on a high-performance computing cluster. The platform integrates over 110 publicly available R, Bioconductor, and custom packages and functions for data import, processing, analysis, integration, and visualization. All packages are currently running under R version 2.15.2 and can be easily updated with newer versions of R. INsPeCT supports up to 2 GB of data upload in any module. INsPeCT is available free of cost from http://inspect.braembl.org.au. User manual and test datasets can be accessed from the INsPeCT homepage. For the sample datasets provided, approximate run times for complete modular workflows are: microarray and WGCNA framework for less than two hours, ChIP-seq and RNAseq datasets for six hours, Gene-lists framework for less than one hour, and RMaNI for four hours, depending on the machine load.
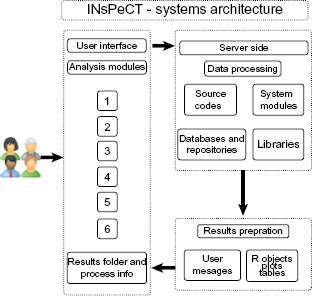
Systems architecture diagram of INsPeCT.
INsPeCT: Structure and Functionalities
INsPeCT is organized into five main modules for analysis of microarray (Fig. 2B), ChIP-seq (Fig. 2C), RNA-seq raw (Fig. 2C), and processed data (Fig. 2D), and secondary analysis of gene lists and automated workflows (Fig. 2E). The main functionalities in each section are described in detail below.

Schematic representation of INsPeCT. (
The microarray analysis framework of INsPeCT (Fig. 2B) provides a complete analysis workflow, from raw data import and differential analysis to gene network inference and pathway analysis. Below we describe the critical steps and functions. For the different options selected, INsPeCT automatically prepares the input data for downstream analyses.
Data Upload/Import and Processing.
INsPeCT allows the uploading of raw or processed data arising from different types of Affymetrix chips and automated online data import from the GEO or ArrayExpress databases. The user enters the dataset accession ID to import it using the online data importer function. Uploaded or imported raw data will be processed for background correction and normalization using the R package limma. We provide five widely used normalization methods: RMA, GCRMA, MAS5, PLIER, and dChip. Multiple probes can be summarized to one gene using either the coefficient of variation or the maximum average expression methods. 25
Differential Expression Analysis.
In INsPeCT, differentially expressed genes can be detected using two widely used methods, LIMMA
26
and SAM.
27
We declare a differential gene expression significant if the Benjamini—Hochberg (BH) adjusted
Trend Analysis.
Users can identify genes with a consistent increase or decrease in median expression (monotonic trend) across multiple conditions. This analysis is performed using a trend analysis function based on the Jonckheere—Terpstra (JT) test, and using the SAGx package. 28 If this option selected, INsPeCT will automatically prepare the input data for trend analysis.
Regulatory Impact Factor Analysis.
To identify the transcription factors potentially regulating differentially expressed genes across two conditions, regulatory impact factor analysis (RIF) 29 can be used. We developed an R function to implement the RIF FORTRAN code. This analysis can be useful to priorities transcription factors or microRNAs based on their regulatory potential with respect to a given set of genes, or to infer a regulatory network. If this option selected, INsPeCT will automatically prepare the input data for RIF.
GRN Inference.
INsPeCT supports several tools for the inference GRNs including mutual information-based methods (relevance networks, 30 ARACNE, 31 CLR, 32 and MRNET), 33 gene correlation (Pearson, Spearman, and Kendall-tau), partial correlation and information theory (PCIT), 34 and regression trees (GENIE3). 35 These tools originate from the MINET, PCIT, and GENIE3 R packages.35–37 The Transfac2009.4 38 and Tcof-DB 39 databases are used for transcription factor information. For a comprehensive comparative evaluation of these GRN inference methods, please see Ref. 40.
Clustering.
Microarray samples can be clustered according to their expression similarity using the CLUES, KMEANS, PAM, AGNES, FANNY, SOTA, and MCLUST methods, available from the CLUES, MCLUST, and cluster R packages.41–43 The user can compare the performance of these tools on their data to select the most-appropriate method.
Signaling Pathway Impact Analysis.
A signaling pathway impact analysis algorithm is available in the SPIA package. 44 It uses differential gene expression and log fold changes together with signaling pathway topology from the KEGG database release 64.0 45 to identify the pathways that are perturbed in an experiment.
Differential Gene Set Analysis.
Differential gene set analysis can be performed using one of the broad gene-set collections from MsigDB. 46 INsPeCT currently supports all six gene set types (positional, curated, motifs, computational, GO, and onogenic signature gene sets). INsPeCT uses the sigpathway R package 47 for differential gene set analysis.
Modified Cancer Outlier Profile Analysis (mCOPA).
mCOPA 48 is a new tool for the exploration of cancer datasets and discovery of new cancer subtypes, and can be combined with pathway and functional analysis approaches to discover mechanisms underpinning heterogeneity in cancers. The biology explored by outlier analysis can differ from that uncovered in differential expression or variance analysis. 48
Redirecting Analysis to Genelist Analysis Framework.
Lists of interesting genes identified in microarray analysis (eg, as differentially expressed) can be redirected to the genelist analysis framework (Fig. 2D) for additional functional analysis. Genelist analysis framework is described in more detail below (section E).
ChIP-seq Data.
The ChIP-seq analysis framework of INsPeCT (Fig. 2C) provides a complete analysis pipeline from raw data import to motif discovery and analysis. Below we describe the critical steps and functions. For the different options selected, INsPeCT automatically prepares the input data for downstream analyses.
File-Format Conversions, Mapping Reads to a Reference Genome, and Quality Control.
Mapping reads to a reference genome is the first step in analysis of ChIP-seq data; we implement Bowtie for this purpose. The standard file-format for raw ChIP-seq reads used for input to Bowtie is FASTQ, which we then convert to SAM, BAM, and sorted BAM formats for further analyses. For data that are available in SRA format, we provide functionality to convert from SRA to FASTQ We also provide functionality to upload mapped reads in any of the SAM, BAM, or sorted BAM file-formats. We implement sratoolkit 49 and samtools 15 for these file-format conversions. After mapping reads, we process the data for quality control using the FastQC tool. 50 INsPeCT provides an interactive HTML-based report to review the results of comprehensive quality control checks.
Peak Calling.
Peak calling identifies regions in a genome that are enriched with aligned reads. INsPeCT uses the R package BayesPeak and peak-calling by coverage value for this purpose. 51 We input sorted BAM files to these methods, which return transcription factor-bounded regions in CSV format to the user.
Peak Annotation, Filtering, and Extracting Peak Sequence Regions.
The R package ChiPpeakAnno
8
is employed to retrieve the gene location, distance relative to the corresponding transcription start site (TSS), and further annotations. We currently use the latest human genome assembly, GRCh37, for this purpose. At the end of this step we provide peaks annotated with chromosomal peak location, strand, feature and TSS information, gene symbol, and Ensembl and Entrez gene IDs in a CSV file. We also provide plots with distance to TSS for visualization. Using the annotated peak data we perform GO enrichment analysis using the hypergeometric test with a BH-adjusted
Normalization and Differential Binding Analysis.
Researchers can perform differential binding analysis of the peaks identified in two different conditions, eg in a case/control experimental design. We perform reads per kilobase of sequence range per million mapped reads (RPKM) normalization and quality control plots for samples. Differential binding analysis can be carried out using two approaches: via the DESeq package, or using the edgeR package.52,53 If all these tools are chosen, we compute overlaps of differential peaks across methods and provide consensus peaks for user-specified fold-change, number of peaks, and a Venn plot for visual inspection of the result.
Motif Analyses.
Motif discovery is of obvious relevance in ChIP-seq analysis. INsPeCT integrates the widely used MEME Suite of tools 18 for motif discovery, comparison, and analysis. We use MEME-ChIP, 54 which was specifically designed for analysis of ChIP-seq data. MEME-ChIP performs different motif analyses on the input data and includes the MEME, 55 TOMTOM, 56 SPAMO, 57 DREME, 58 CENTRIMO, 59 and AME 60 tools. An interactive HTML file is provided that summarizes the results and provides links to the results for each program. It also displays interactive plots for visual inspection.
Redirecting Interesting Genes to Genelist Analysis Framework.
An interesting gene list identified in ChIP-seq analysis, for instance differential peaks, can be redirected to the genelist analysis framework (Fig. 2D) for additional functional analysis.
RNA-seq Data.
The RNA-seq analysis framework of INsPeCT (Fig. 2C and D) provides a complete analysis workflow for raw or processed data analysis. Below we describe the critical steps and functions. For the different options selected, INsPeCT automatically prepares the input data for downstream analyses.
File-Format Conversions and Data Processing.
INsPeCT provides a data-upload functionality for the raw sequence read formats FASTQ and SRA, and for mapped and aligned reads in the SAM or BAM formats. We also provide functionality for automated online data import from the ArrayExpress database using the ArrayExpressHTS package. 61
Alignment, Annotation, Normalization, and Dispersion Estimation.
We provide three aligner options, Tophat, 62 Bowtie, 13 and Bwa, 12 for aligning reads against a reference genome or transcriptome. A read count table in CSV format is provided as output. For annotating read count data we use Bioconductor's human annotation database, 63 and apply the Trimmed Mean of M component technique 64 for normalization of read counts. We provide multi-dimensional scaling plot for visual inspection. We use edgeR 53 to estimate the overall dataset dispersion to detect the overall biological variability, followed by gene-wise dispersion estimation for detecting possible trend in average count size.
Differential Gene Expression Analysis.
To detect differentially expressed genes we implement the edgeR package.
53
The BH-adjusted
Gene-List Analysis Framework.
The gene-list analysis framework (Fig. 2E) has been developed to provide functional analysis for researchers who may not have raw data for analysis but have previously identified interesting genes using another package or approach. Below we summarize some of the analysis options. For the different options selected, INsPeCT automatically prepares the input data for further analyses.
Promoter Analysis.
Automated retrieval of genomic sequences, annotation of promoter sequences, detection of CpG islands, and sequence analysis can be performed using Biomart resources 65 and the MEME Suite of tools. 18
Motif Discovery and Analysis.
With MEME Suite, 18 a researcher can discover motifs using MEME and DREME, search sequence databases with motifs using MAST, 66 compare a motif to all motifs in a database using TOMTOM, associate motifs with GO terms via their putative target genes using GOMO, or analyze motif enrichment using CentriMo.
Druggability Analysis.
Proteins that are the targets of current Food and Drug Administration (FDA)-approved anticancer drugs can be identified using a druggability analysis function developed using the Cancer Resource 67 database.
Enrichment Analysis.
Gene set enrichment analysis (GSEA) and GO enrichment analysis are performed using the GSEA and DAVID tools through the GSEA API 46 and DAVID-WS, 68 respectively. Gene enrichment disequilibrium analysis are performed using the R package EDanalysis. 69
Transcription Factor Binding Site (TFBS) Over-Representation Analysis.
The identification of over-represented single or combinations of TFBSs in sets of co-expressed genes can be performed using oPOSSUM. 70
Automated workflows.
Network inference can be a powerful tool in understanding how interactions are disrupted and rewired and identifying novel regulatory interactions and broader systemic disruptions in key oncogenic processes. We provide users with two automated workflows for module-based GRN inference and analysis to understand genetic architecture and underlying biology in a given system: WGCNA and a novel method that we call RMaNI. We briefly summarize these workflows below.
WGCNA.
This workflow is based on a general framework for WGCNA available as an R package.71,72 It finds modules of highly correlated genes across microarray samples, associated with the external sample traits. We provide functions for automated network construction, module detection, gene selection, calculations of topological properties, and data visualization, and export the network in Cytoscape- and VisAntcompatible formats.73,74 This workflow takes processed expression data and associated patient information as input, and provides several output files in CSV format and graphics in portable network graphics (PNG) format. This workflow is suitable for users who have access to microarray expression data and clinical metadata such as survival information. Importantly, this approach does not require expression data for normal controls.
RMaNI.
RMaNI is a novel analytical workflow we developed for the inference and analysis of cancer-subtype specific modules. 75 It implements the LeMoNe algorithm 76 for model-based co-clustering of expression data, and RIF 29 to identify relevant regulatory factors. LeMoNe uses a Gibbs sampling procedure to iteratively update the cluster assignment of both genes and conditions. It takes processed expression data as input, and provides several output files in CSV format and graphics in PNG format. This workflow is suitable for users who have access to microarray expression data for normal and multiple cancer subtypes. One significant advantage of LeMoNe over WGCNA is that it uses a model-based approach for clustering genes, and while selecting thresholds does not assume that networks necessarily have a scale-free topology.
Conclusion
INsPeCT is an innovative framework that provides an easy-to-use interface to a comprehensive, integrated suite of tools for rapid in-silico analysis of microarray, ChIP-seq and RNA-seq data, and/or lists of genes. It also provides access to the novel analytical framework RMaNI, and to the widely used WGCNA tool for inference and analysis of transcriptional regulatory networks using microarray data. Our web server makes available a set of tools and analytical workflows that would otherwise be challenging for non-expert users to install and apply. In future, we will integrate more tools and workflows to meet the distinct needs of researchers confronting the complexity of cancer transcriptomics.
Author Contributions
PBM developed and wrote the code for INsPeCT, and composed the manuscript. SRM, MJD, AR, and MAR advised on the design and features of INsPeCT, provided overall scientific and technical guidance, and assisted with the creation of the manuscript. All authors reviewed and approved of the final manuscript.
Disclosures and Ethics
As a requirement of publication the authors have provided signed confirmation of their compliance with ethical and legal obligations including but not limited to compliance with ICMJE authorship and competing interests guidelines, that the article is neither under consideration for publication nor published elsewhere, of their compliance with legal and ethical guidelines concerning human and animal research participants (if applicable), and that permission has been obtained for reproduction of any copyrighted material. This article was subject to blind, independent, expert peer review. The reviewers reported no competing interests.
Footnotes
List of Abbreviations Used
Acknowledgements
We thank Dr Timothy Bailey for valuable advice on implementation of the MEME Suite of tools and CpG detection program; Mr Gavin Graham, Dr Gerald Hartig, and Mr Alex Varlokov from Bioinformatics Resource Australia-EMBL for high-performance computing and web-development support; Dr Sriganesh Srihari and Dr Daniel Hurley for helpful discussions; Dr Richard Newton for help with Rwui; and the R/Bioconductor research community, who have made their programs and source codes publicly available. Computational resources were provided by National Computational Infrastructure Specialised Facility in Bioinformatics.