
Abstract
MYC is a transcription factor crucial for maintaining cellular homeostasis, and its dysregulation is associated with highly aggressive cancers. Despite being considered “undruggable” due to its unstable protein structure, MYC gains stability through its interaction with its partner protein, MAX. The MYC-MAX heterodimer orchestrates the expression of numerous genes that contribute to an oncogenic phenotype. Previous efforts to develop small molecules, disrupting the MYC-MAX interaction, have shown promise in vitro but none have gained clinical approval. Our current computer-aided study utilizes an approach to explore drug repurposing as a strategy for inhibiting the c-MYC-MAX interaction. We have focused on compounds from DrugBank library, including Food and Drug Administration-approved drugs or those under investigation for other medical conditions. First, we identified a potential druggable site on flat interface of the c-MYC protein, which served as the target for virtual screening. Using both activity-based and structure-based screening, we comprehensively assessed the entire DrugBank library. Structure-based virtual screening was performed on AutoDock Vina and Glide docking tools, while activity-based screening was performed on two independent quantitative structure-activity relationship models. We focused on the top 2% of hit molecules from all screening methods. Ultimately, we selected consensus molecules from these screenings—those that exhibited both a stable interaction with c-MYC and superior inhibitory activity against c-MYC-MAX interaction. Among the evaluated molecules, we identified a protein kinase inhibitor (tyrosine kinase inhibitor [TKI]) known as nilotinib as a promising candidate targeting c-MYC-MAX dimer. Molecular dynamic simulations demonstrated a stable interaction between MYC and nilotinib. The interaction with nilotinib led to the stabilization of a region of the MYC protein that is distorted in apo-MYC and is important for MAX binding. Further analysis of differentially expressed gene revealed that nilotinib, uniquely among the tested TKIs, induced a gene expression program in which half of the genes were known to be responsive to c-MYC. Our findings provide the foundation for subsequent in vitro and in vivo investigations aimed at evaluating the efficacy of nilotinib in managing MYC oncogenic activity.
Keywords
Introduction
Family of MYC genes is proto-oncogenes that control the expression of a functionally diverse repertoire of genes with different physiological roles. 1 Malfunctioning of MYC leads to B-cell lymphoma, Burkitt lymphoma, neuroblastoma, and epithelial tumors. 1 MYC family of proteins (from here referred as MYC) consists of three members, c-MYC, L-MYC, and N-MYC. The presence of multiple MYC family members with distinct expression patterns undoubtedly reflects different spatial and temporal requirements for MYC activity 2 and is most frankly seen in the particular way each gene is overexpressed in specific cancer types. MYC’s key downstream mediators, involved in ribosome biogenesis, mRNA translation, cell-cycle regulation, and stress responses, affect a broad spectrum of cellular processes, such as apoptosis, differentiation, proliferation, survival, and immune regulation.3,4
Among MYC proteins, the deregulated expression of c-MYC has been reported in a majority of cancers. The c-MYC protein controls the transcription of nearly 15% of expressed genes. 3 MYCN expression is predominantly found in neural and neuroendocrine tissues. MYCL expression is mainly observed in the gastrointestinal tract and dendritic cells and acts as a driver of certain small-cell lung carcinomas.Germline knockout of either MYC or MYCN led to embryonic lethality,5-8 whereas mice deficient of MYCL appeared normal and were fertile. 9
The MYC proteins function as transcription factors. 1 MYC proteins belong to the basic helix-loop-helix (bHLH) leucine zipper family of transcription regulators and possess multiple structural domains. MYC dimerizes with MAX through its C-terminal region, which is an obligatory partner for MYCs binding to DNA and regulation of transcriptional activity. The N-terminus of MYC proteins consists of a transactivation domain, while the central region carries nuclear localization signal.10-12
MYC is considered one of the primary targets in cancer drug discovery. However, there are major challenges in designing drugs against MYC, including its intrinsically disordered nature, localization in the nucleus, and lack of enzymatic activity. Due to these inherent obstacles, MYC has long been considered “undruggable.” Several strategies have been employed to directly target MYC, ranging from gene expression regulation to protein-protein interactions (PPIs). Some of these strategies have resulted in prototype inhibitors that have entered early phases of clinical trials. Over the past 20 years, significant progress has been made in developing and approving drugs comprising small molecules, particularly those that can inhibit MYC-MAX interactions and the binding of this heterodimer to DNA. 13 Several small molecule inhibitors, such as 10058-F4, mycomycin-1, mycomycin-2, IIA6B17, 10074-A4, and 10074-G5, have been reported to inhibit the activity of c-MYC.14-17 However, despite the identification of numerous prototype compounds these molecules have failed to demonstrate efficacy into in vivo studies. The limitations are primarily attributed to lack of rational drug design and the intrinsically disordered nature of MYC in its monomeric form, which lacks a clear binding site for drug development.
Another general issue in cancer drug discovery is the off-target effect of anti-cancer drugs, which can exhibit cytotoxicity against non-cancerous cells. This makes it challenging to achieve high selectivity for a small molecule against its target. The process from identifying hit molecules to obtaining clinical approval and bringing it to the market typically takes a decade. Given these factors, drug repositioning offers a promising approach to expedite the development of cancer drugs while reducing risks and time involved in discovering new drugs.
The objective of the current project is to identify and study Food and Drug Administration (FDA)-approved drugs that can disrupt the interaction between MYC and MAX proteins. Our approach involves screening for potential candidates through drug repositioning, specifically targeting the c-MYC-MAX interaction. For this purpose, we use the DrugBank database, which is a comprehensive resource that integrates bioinformatics and cheminformatics data. In terms of drug entries, the database contains over 7800 records. This includes approximately 2200 FDA-approved small molecule drugs, 340 FDA-approved biotech drugs (such as protein/peptide-based drugs), 93 nutraceuticals, and over 5000 experimental drugs. 18
To achieve this objective, we utilized all the molecules from the DrugBank database and employed two different virtual screening approaches: (1) screening through structure-based molecular docking and (2) activity-based quantitative structure-activity relationship (QSAR) screening. For molecular docking, AutoDock Vina and Glide software were used. Quantitative structure-activity relationship models were constructed using known activity data of molecules against c-MYC-MAX interaction. Subsequently, the two independent QSAR models were used to screen the entire DrugBank database, prioritizing molecules with predicted high activity against c-MYC-MAX interaction. Following both screenings, we selected the top 2% of molecules from each approach ensuring a more robust selection of potential drug candidates. Finally, we identified consensus molecules that appeared in the top 2% of both screening lists. These selected molecules represent the most promising candidates based on their predicted binding affinity or activity against c-MYC-MAX interaction. The interactions of consensus molecules with MYC protein were further assessed using molecular dynamic (MD) simulation approach.
By combining the results of different in silico analyses and focusing on the consensus molecules, nilotinib (DrugBank ID: DB04868) was identified with the potential to interact MYC protein and comparable better predicted activity to inhibit MYC-MAX heterocomplex, thus providing new avenues for therapeutic intervention.
Material and Methods
Molecular docking-based virtual screening
In the current project, structure-based virtual screening of the complete DrugBank database was performed using AutoDock Vina19,20 and Glide software.21-23
Ligand retrieval and preparation
All 9468 molecules from the entire DrugBank database were downloaded in .sdf format. After extraction, all the molecules (ligands) were preprocessed for use in structure-based virtual screening. The OPENBabel software 24 was utilized to add hydrogen atoms (both polar and non-polar) and generate the 3D structure of each molecule. Ligprep 25 tool embedded in Schrödinger platform was used for energy minimization applying OPLS2005 force field. The Ligprep produced 15 920 molecules with some drugs more than one tautomer. Ligprep-generated library was used for both docking methods. Using the PYRX platform, a total of 15 904 molecules were successfully converted to the AutoDock Vina-supported .pdbqt format.
Target protein retrieval and preparation
Crystal structure of the apo form of human c-MYC-MAX complex Protein Data Bank (PDB) ID: 6G6J 26 in the absence of DNA was used for screening. To identify a potential druggable site on the extensive and flat interface, only the crystal structure of MYC (designated as chain A, without MAX and DNA) underwent analysis through the Sitemap tool 25 within the Schrödinger software suite.
For AutoDock Vina, the protein preparation was conducted using AutoDock 4 software. 27 Water molecules co-crystallized with 6G6J were excluded. In addition, hydrogen atoms, both polar and non-polar, along with Kollman charges, were incorporated. For Glide, the protein structure was readied using the Protein Preparation Wizard utility of Schrödinger: Maestro. The preparation involved adding missing hydrogen atoms, determining the appropriate protonation and ionization states, and optimizing the hydrogen bond network of the MYC structure. Following this, a restrained minimization was executed to mitigate hydrogen atom distortions, alleviate steric clashes, and address strained bonds. This optimization employed the OPLS2005 force field.
Following the identification of a druggable site on the prepared MYC protein structure, a receptor grid was created to conduct the mining for the best hit compounds. The coordinates of the grid center were 10.08, 13.76, and 184.44 for x, y, and z, respectively. For Glide, XP option was used for docking.
To reduce processing time and expedite the process, AutoDock Vina was run on a graphic processing unit (GPU) platform, as described in the study by Tang et al. 20 This execution incorporates large-scale parallelism for Monte Carlo-based iteration for docking (reducing the number of iterations per docking thread) and includes an efficient heterogeneous OpenCL implementation. To perform the virtual screening, a Perl script was written to handle the molecules one by one on the GPU. All the information regarding the protein, grid box, and ligand library was provided in a configuration text file. Finally, a Python script was used to extract the binding energies for each molecule, which were then stored in a .csv file.
Quantitative structure-activity relationship
We conducted another round of screening of the entire DrugBank library based on predicted biological activity, specifically predicted IC50 values against MYC-MAX inhibition. To accomplish this, we generated two 3D QSAR models using the Maestro platform (Maestro suite, Schrödinger LLC). For model generation, 33 reference molecules were retrieved from the literature, as reported in Supplemental Table S1. These reference molecules are described in literature as inhibitors of MYC-MAX heterocomplex, and their IC50 values were considered as the biological activity for QSAR model generation. To perform energy minimization and alignment to the common pharmacophore, the macro model and ligand preparation tools, respectively, were utilized in Maestro. Later, two independent models, namely field-based QSAR and atom-based QSAR, were generated. Regression was performed by constructing a model using partial least squares factors.
The molecules from the DrugBank library were then applied to each generated model separately, and their IC50 values were predicted. The molecules were ranked based on their predicted IC50 values (-log).
MD simulation
The MD simulation was conducted on Desmond (version 6.6) and NAMD (version 2.14) package. The AutoDock Vina-docked complex of the MYC-nilotinib complex was used as the starting point for MD simulations. For NAMD, simulation was performed as described in the study by Ravi et al. 28 The CHARMM36 force field and NAMD package version 2.13 were utilized. The force field parameters were generated for the ligands in CHARMM-GUI server. The simulation system was set up in a water box, which included 0.15 M NaCl. Water molecules were added to extend 20 Å in the x, y, and z coordinates, resulting in a rectangular box surrounding the protein. Electrostatic interactions were treated using the Particle Mesh Ewald method. Prior to the production run, the systems underwent equilibration for 2 nanoseconds, employing a conjugate gradient algorithm. The simulations were conducted in an NPT (isothermal-isobaric) ensemble with a temperature maintained at 300 K. The production simulations were carried out for a duration of 100 nanoseconds.
For Desmond, System Builder was utilized to set up the simulation system, which placed the protein-ligand complex into an orthorhombic box with a distance of 10 Å from each edge. To neutralize the system, counterions were added, and a salt concentration of 0.15 M NaCl was introduced to ensure proper electrostatic distribution. In addition, the simulation system underwent minimization using both the steepest descent and LBFGS (Limited-memory Broyden–Fletcher–Goldfarb–Shanno algorithm) methods for 2000 iterations. Subsequently, equilibration was conducted using the NPT ensemble for 1 nanosecond. Finally, the production run spanned 100 nanoseconds, maintaining an average temperature of 310 K and a pressure of 1 bar.
The post-simulation data of NAMD were analyzed using the visual molecular dynamics (VMD 1.9.3) software. 29 The RMSD tool was used for secondary structure timeline analysis. Plots were generated based on the production steps of the MD-screened molecules (protein, ligand, and complex) and analyzed using the following VMD parameters: Backbone alignment on top and average, and finally, an RMSD plot was generated. The Desmond simulation results were visualized in Maestro and subsequently analyzed using the Simulation Interaction Diagram and Simulation Event Analysis programs provided by Desmond.
Differential expression gene analysis
The high-throughput gene expression microarray dataset (GSE19567), a genome-wide expression dataset, was obtained from the publicly available Gene Expression Omnibus database (https://www.ncbi.nlm.nih.gov/geo/). This microarray dataset was utilized to assess the expression levels of genes in the chronic myelogenous leukemia (CML) cell line (K562 cells) after treatment with nilotinib (0.05 µM) or imatinib (0.5 µM) for 24 hours.
To identify differentially expressed genes (DEGs), we compared the gene expression data from the treated cells to that of vehicle-treated control cells. The DEGs were screened using the GEO2R online analysis tool (https://www.ncbi.nlm.nih.gov/geo/geo2r). We calculated the adjusted P-value and|log2FC| (fold change) for each gene. Genes meeting the cutoff criteria of adjusted P < .05 and |fold change| > 2.0 were considered as DEGs.
Subsequently, we performed an intersection analysis of genes with high and low expression levels from the two datasets. Specifically, we identified genes in the nilotinib-treated group that were not present in other treatment combinations. A Venn diagram was employed to visualize this comparison.
Furthermore, the complete database of MYC-responsive genes was downloaded, following the described procedure in the study by Zeller et al 30 and genes responsive to nilotinib treatment were searched in this database.
Results
Molecular docking-based screening through AutoDock Vina
The interface of the MYC-MAX heterodimer is characterized as relatively large, flat, and devoid of suitable grooves that would typically facilitate the binding of small molecules. Due to these structural features, the crystal structure of the apo form of MYC-MAX heterodimer, unbound to DNA (PDB ID: 6G6J), 26 was chosen. This is the MYC-MAX crystal structure in the apo form, providing a better understanding and detailed view of the MYC-MAX complex, making it suitable for the identification of small inhibitors. Within the MYC, c-MYC is involved in the tumorigenesis of several different types of cancer. In addition, such detailed structures of other family members are not available; therefore, we targeted c-MYC in our study. Leveraging the robust algorithm of the Sitemap module, only one potential binding site was identified, featuring more site points and greater exposure to the solvent as shown in Figure 1A.

High-throughput virtual screening identified nilotinib as an FDA-approved top hit compound against oncogenic MYC. (A) Depiction of the active site predicted through the Sitemap tool. The red surface represents hydrogen acceptor, blue hydrogen donor while yellow shows hydrophobic atoms in cavity. The MYC residues within 4 Å of binding site are labeled. This active site was selected to screen drugs from the DrugBank database. (B) Docking of nilotinib with AutoDock Vina and (C) 2D structure of binding site with residues in contact with nilotinib in AutoDock Vina-docked complex (D) docking of c-MYC-nilotinib using Glide software. (E) Contact details of c-MYC residues with nilotinib in Glide-docked complex. FDA indicates Food and Drug Administration.
From the entire DrugBank library, 15 872 and 15 405 docked poses were generated with AutoDock Vina and Glide, respectively; following the docking process, the AutoDock Vina results were extracted using a Python script, while the Glide results were visualized in Maestro. Molecules were ranked, and the top 2% (approximately 180) molecules were considered. The binding energy range of the top 2% molecules was between −8.5 and −7.1 Kcal/mol for AutoDock Vina and docking energy was between −71 and −46 Kcal/mol for Glide, provided in Supplemental File 1. Noteworthy, nilotinib was on the top of list in both docking methods when compared with known interactors of c-MYC as shown in Table 1.
Overview of molecular docking.

Comparison of binding ability of nilotinib and the reported MYC inhibitors to c-MYC protein. For Glide, docking energy was considered, while for AutoDock Vina binding affinity was considered.
Activity-based QSAR screening
The QSAR approach was employed to rank the best molecules in the DrugBank library based on their predicted biological activity, specifically their ability to inhibit MYC-MAX interaction. Initially, we selected 35 active drugs/inhibitors against the MYC-MAX heterodimer, which were identified through a literature review and the online ChEMBL database (https://www.ebi.ac.uk/chembl). The statistical parameters for both models can be found in Supplemental Table S2. To assess the predictive capability of our models, we applied them to predict the activity of known MYC-MAX inhibitors. As demonstrated in Table 2, the trends in predicted (from both models) and experimental IC50 values (except for MYCi361 and sAJM589) closely align with each other, indicating the effectiveness of our models in making accurate predictions. The predicted IC50 values (-log of µM) of nilotinib and other known MYC-MAX inhibitors are presented in Table 2. For screening, top 2% ranked molecules from each QSAR model were considered, and their predicted IC50 (µM) values (-log) are given in Supplemental File 2.
Micro molar IC50 values (-log) of nilotinib and known MYC-MAX inhibitors.

Analyses were performed using atom- and field-based 3D QSAR models. Experimental IC50 values (column 3) are also included to demonstrate the predictive accuracy of the QSAR models. Abbreviation: QSAR, quantitative structure-activity relationship.
Selection of consensus molecules
The consensus molecules, which were present in the top 2% of drugs identified by both the field-based QSAR and atom-based QSAR models, were selected. These molecules were then compared with the top 2% molecules from AutoDock Vina and Glide docking-based screening. The common molecule/s that emerged from this comparison were selected as a result. Ultimately, only one molecule, ie, DB04868 (nilotinib), was chosen, as it exhibited both superior binding with c-MYC (Figure 1B to E) and stronger predicted inhibitory activity against the c-MYC-MAX complex. Both the screenings are summarized in Venn diagram demonstrated in Figure 2.

Virtual screening of the complete DrugBank database against c-MYC protein. The Venn diagram shows that virtual screening was performed at two levels: activity-based QSAR (hexagons) and structure-based molecular docking (triangles). Lead molecules were selected in the top 2% (180 molecules) of each method. In QSAR screening, consensus molecules of atom-based (green hexagon) and field-based (yellow hexagon) are depicted as the gray pyramid. Structure-based molecular docking screening was performed using AutoDock Vina (sea blue triangle) and Glide (sky blue triangle). The consensus molecules of docking-based screening are depicted in the magenta triangle. The common drug among all virtual screening methods is represented as a red pyramid in the middle, which is nilotinib (DB04868). QSAR indicates quantitative structure-activity relationship.
Analysis of receptor-ligand interaction through MD simulation
To further validate the stability of the c-MYC-nilotinib complex, we conducted MD simulations using the NAMD and Desmond simulation packages. These simulations extended over 100 nanoseconds, and they revealed that the binding of nilotinib with c-MYC remained stable throughout this duration, with robust and intact interactions (refer to Movie S1 and S2 for a visual representation of these interactions).
The RMSD plot of NAMD shows that there was initial fluctuation in the apo-c-MYC for the first 25 nanoseconds. Notably, the nilotinib-c-MYC complex was stable throughout the 100 nanoseconds of simulation (Figure 3A). During the Desmond simulation, we observed initial fluctuations in the C-α atoms of the protein, particularly in the first 35 nanoseconds. However, these fluctuations stabilized afterward (see Figure 3B). The initial fluctuations led to an increase in RMSD values, which went from 4 to 9 Å for the c-MYC-nilotinib complex (red line in Figure 3B) and from 4 to 13 Å for c-MYC’s apo conformation (blue line in Figure 3B). Importantly, these deviations in c-MYC were substantially reduced upon binding with the inhibitor nilotinib. This reduction in fluctuations suggests that nilotinib contributes to stabilizing the c-MYC protein during the simulation.
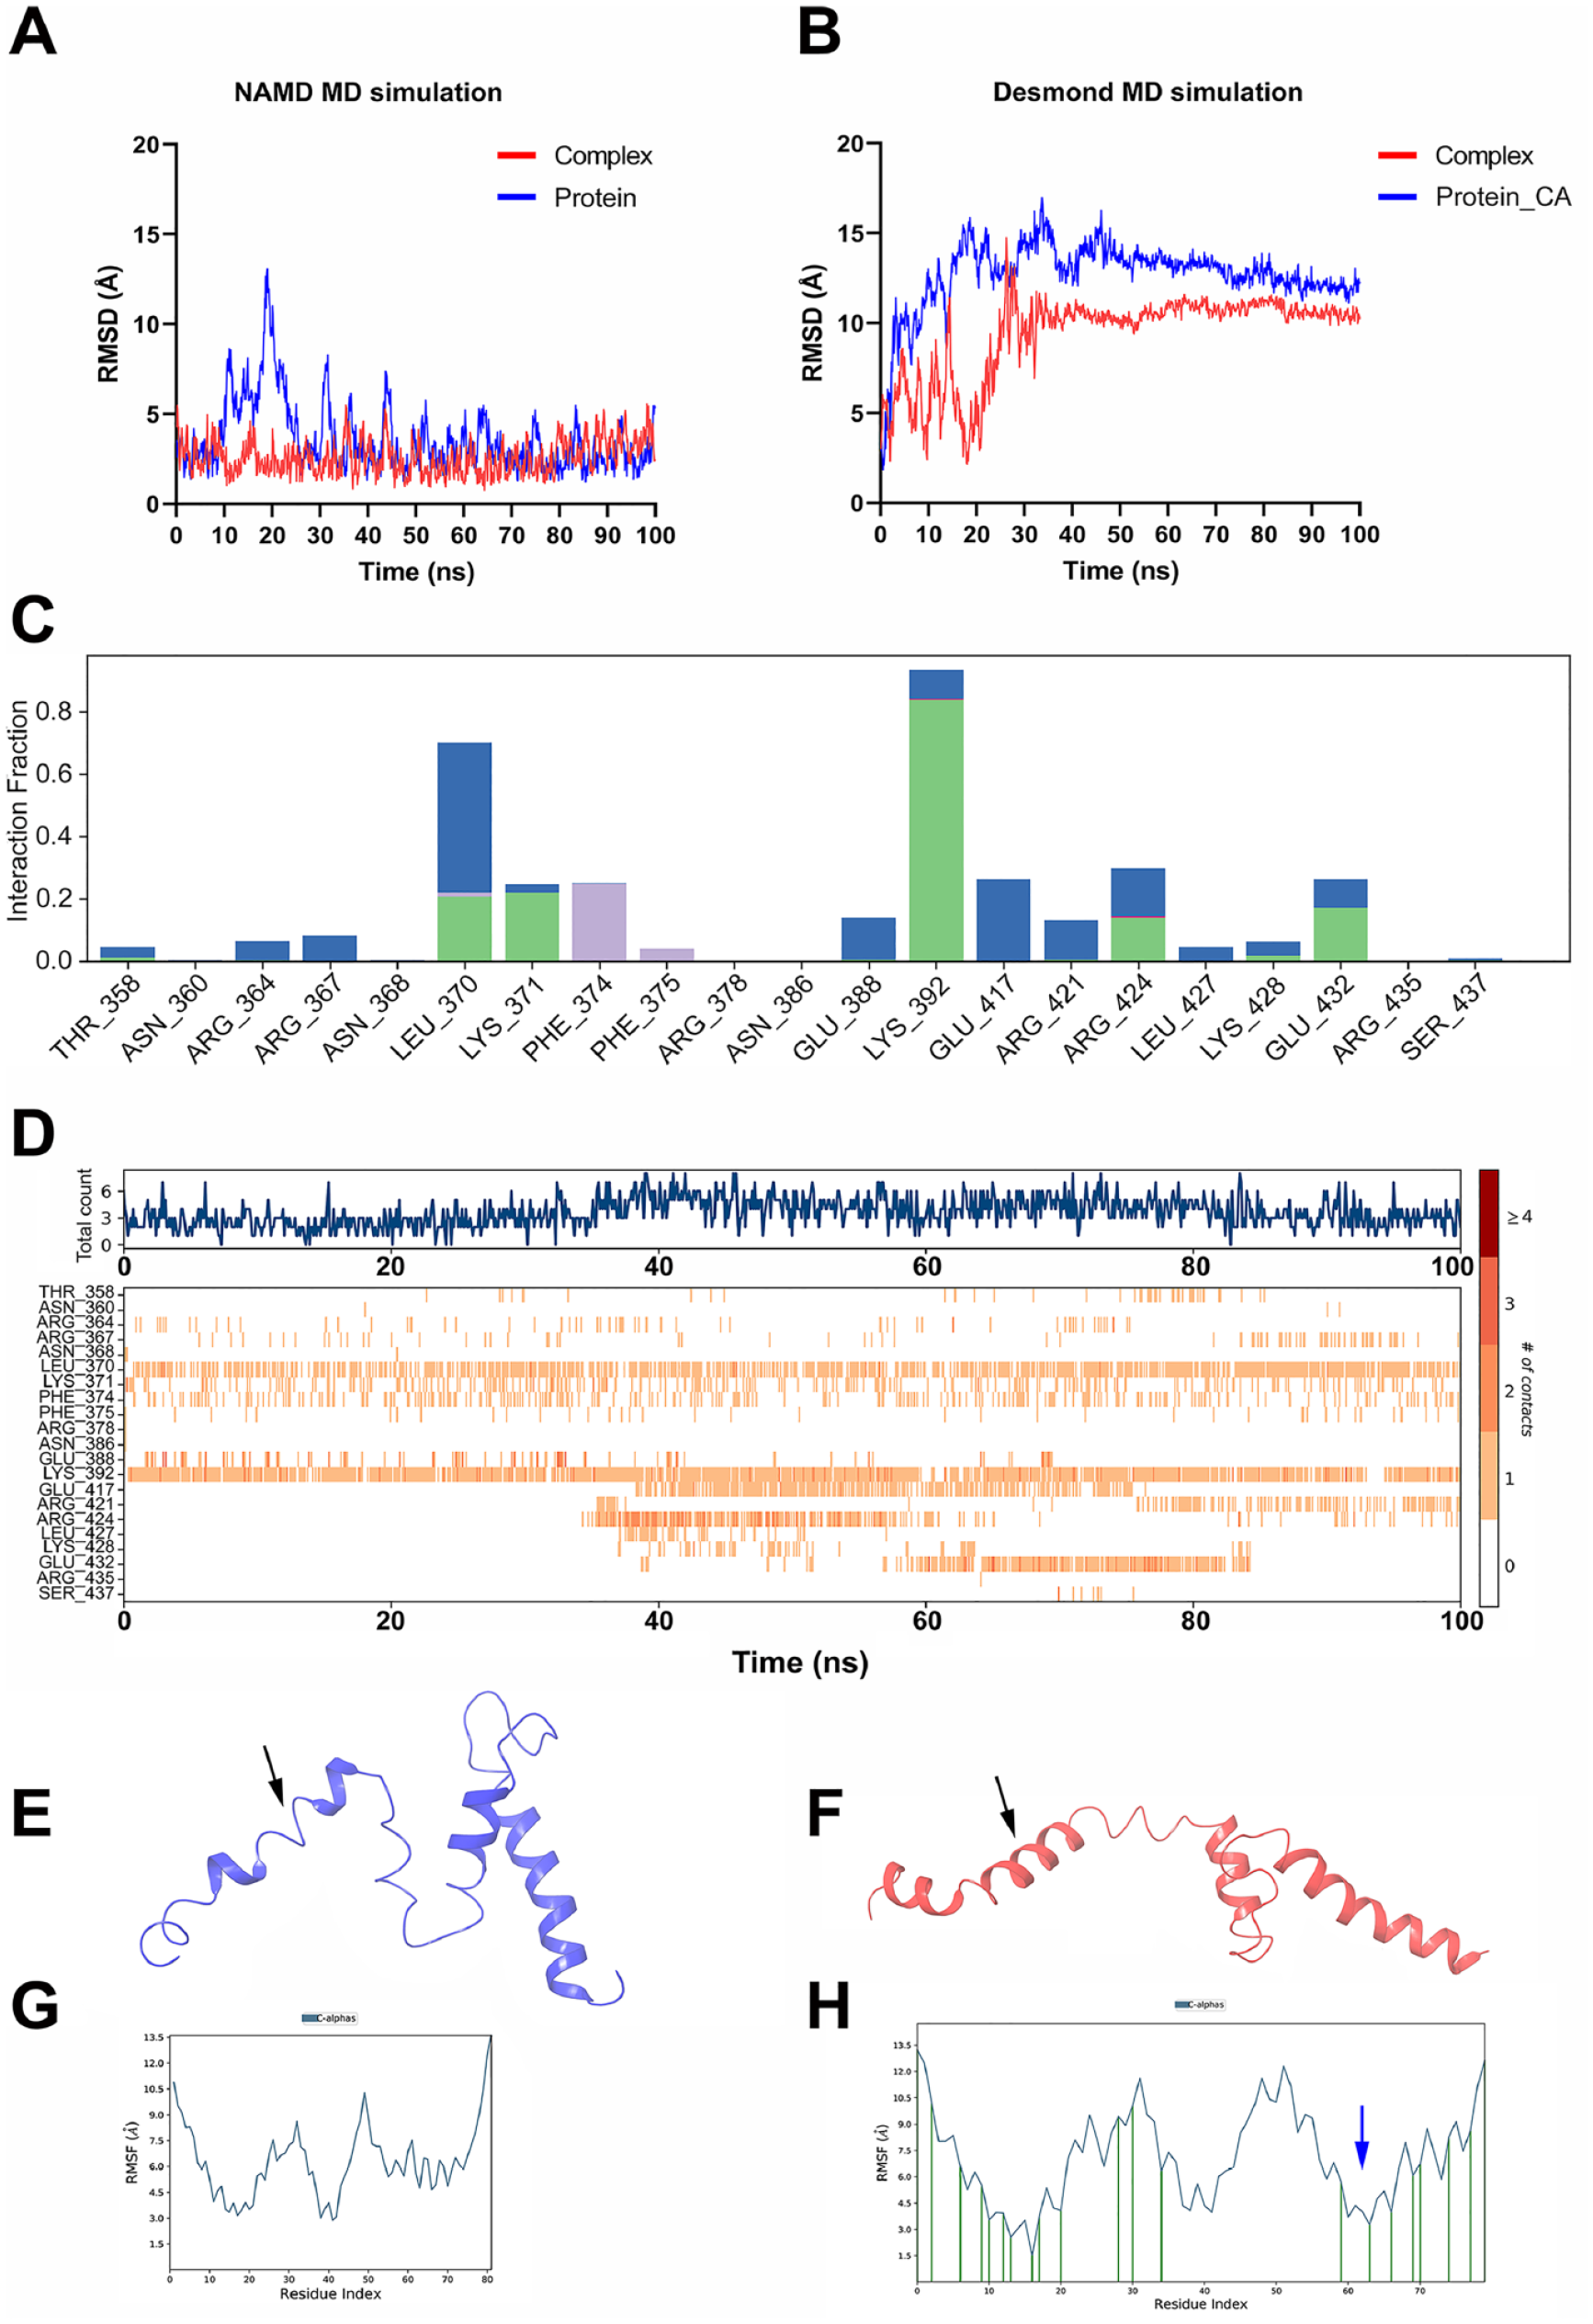
Ligand-protein complex analysis. The AutoDock Vina complex of nilotinib and c-MYC was subjected to MD simulation using the (A) NAMD package and (B) Desmond package. The simulations were performed, and the RMSD trajectories are shown, where the red lines represent the RMSD trajectory of the complex and the blue lines represent the protein alone. (C) Histogram representation of various interactions formed by residues of c-MYC with nilotinib. The colors in the bars, that is red, purple, green, and blue, represent ionic, hydrophobic, hydrogen bonds, and water bridge interactions, respectively. (D) Timeline contacts of c-MYC amino acids with nilotinib during 100 nanoseconds. (E) The extracted last frame (100th nanosecond) of the simulation trajectory of the c-MYC-apo and (F) c-MYC-nilotinib complex. (G) The RMSF values of apo-c-MYC amino acids and (H) c-MYC residues in complex with nilotinib. The arrow shows decrease in RMSF compared to (F). MD indicates molecular dynamic; RMSF, root mean square fluctuation.
In addition, the MD simulation revealed that nilotinib established multiple stable noncovalent interactions with specific c-MYC residues. Notably, interactions with residues such as Lys392 and Leu370 (as depicted in Figure 3C) remained consistently intact throughout the simulation, as shown in Figure 3D. Furthermore, in the case of apo-c-MYC, at 100 nanoseconds simulation loss of helicity was observed in the helix-2 region. In contrast, this helical structure was found to be preserved in the nilotinib-bound c-MYC structure, as illustrated with black arrows in Figure 3E and F. The regions between Asp420-Lys426 may substantially contribute to the stabilization of MYC protein by gaining helical structure. As the root mean square fluctuation values of these residues were low in complex compared to apo-c-MYC (Figure 3G and H, blue arrow). The gain of stabilization was remarkable when simulation was performed for Glide-obtained nilotinib-c-MYC complex (Supplemental Figure S1A to D)
In short, our simulation analysis from two different packages suggests that binding of nilotinib to c-MYC led to stabilize the protein structure of the later during both simulations. Nonetheless, there is a variation in the magnitude of read outs from both modules but overall analysis shows that c-MYC structure is stable in complex with nilotinib compared to apo-c-MYC. As shown in Table 3, the RMSD of nilotinib-c-MYC complex was lower than apo-c-MYC protein in both simulation methods.
MD simulation analysis of the nilotinib-c-MYC complex.
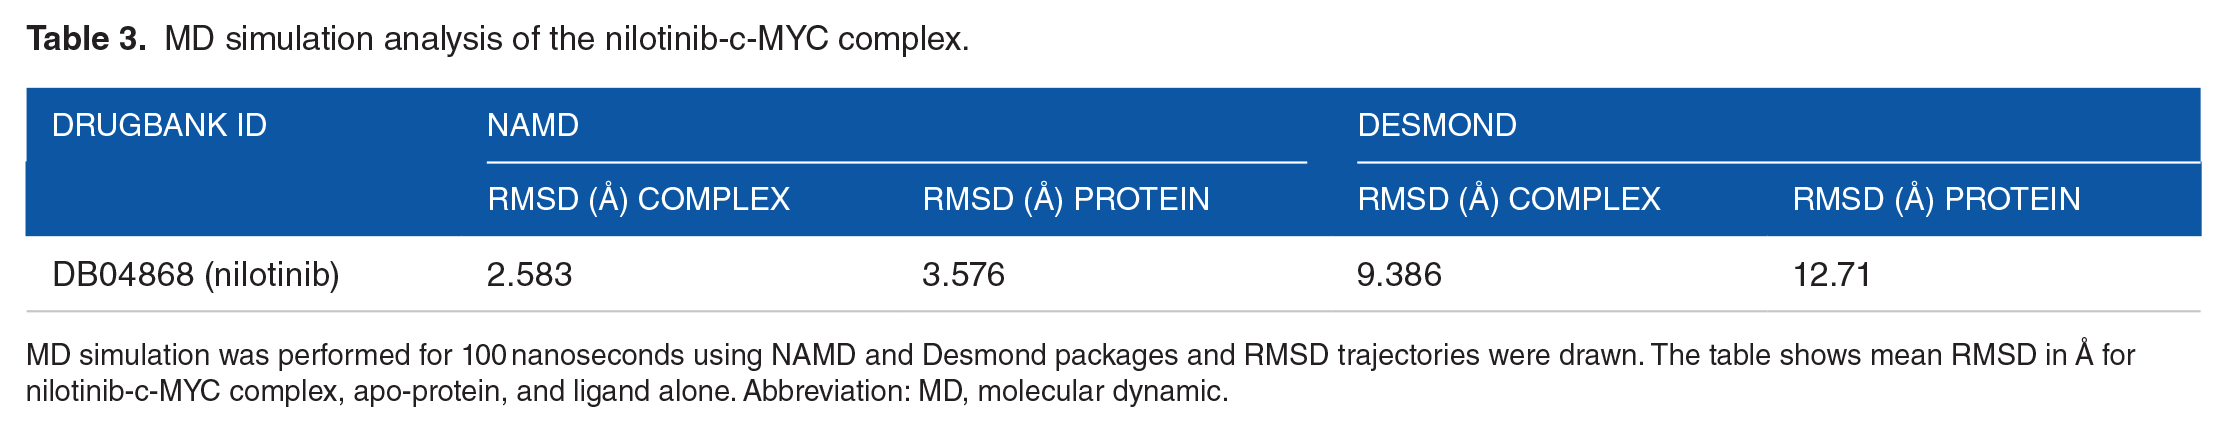
MD simulation was performed for 100 nanoseconds using NAMD and Desmond packages and RMSD trajectories were drawn. The table shows mean RMSD in Å for nilotinib-c-MYC complex, apo-protein, and ligand alone. Abbreviation: MD, molecular dynamic.
Nilotinib-driven gene expression program and MYC responsive gene signature
Differential gene expression analysis showed that 397 and 85 genes were differentially expressed in nilotinib and imatinib treatment group, respectively (Figure 4A and B). We focused on the 391 genes and traced them in database of MYC responsive genes as described by Zeller et al. 30 Remarkably, among the 397 genes exclusive to nilotinib treatment, 201 of them were identified as MYC-responsive genes, as illustrated in Figure 4C, for details refer to Supplemental File 3.
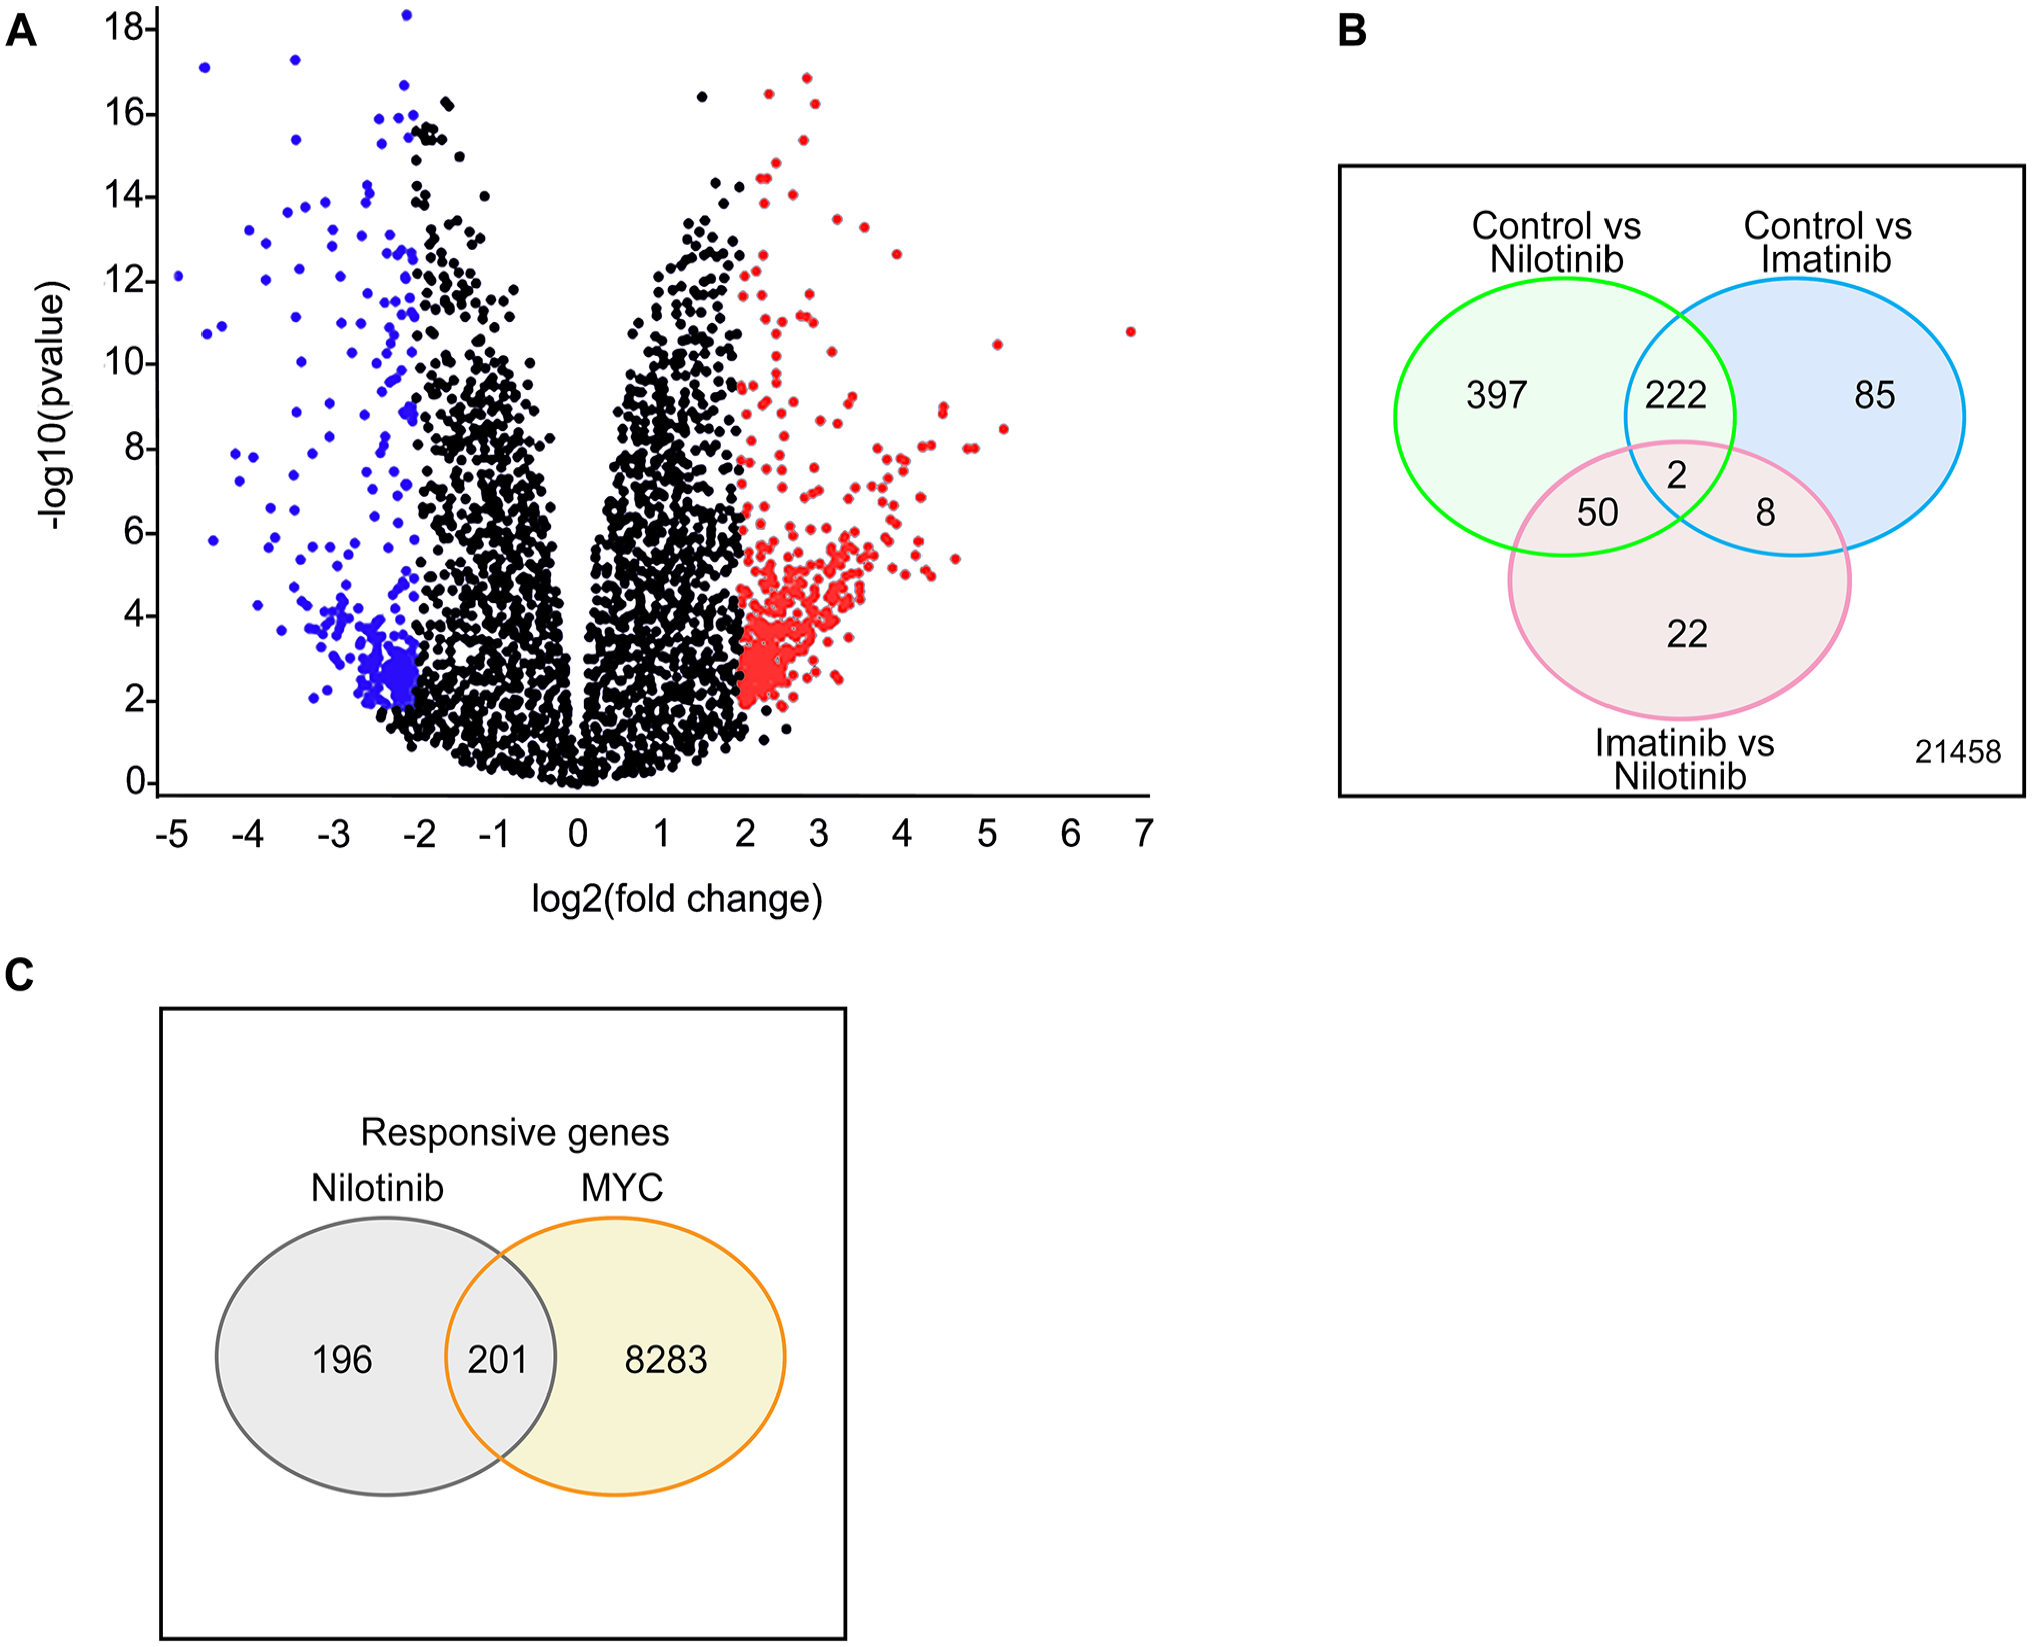
Differential gene expression analysis of nilotinib treatment. High-throughput gene expression microarray dataset GSE19567 was downloaded and analyzed using GEO2R online analysis tool. The cut off criteria for adjusted P < .05 and |fold change (FC)| > 2.0. The selected genes are presented here. (A) Volcano diagram of DEG between vehicle-treated and nilotinib-treated groups with red dots representing highly expressed genes and blue as downregulated genes. (B) Venn diagram of DEG in control vs nilotinib or imatinib and imatinib vs nilotinib. The genes which were exclusively altered in nilotinib group were further analyzed. (C) Venn diagram of nilotinib-affected genes and c-MYC responsive genes. DEG indicates differentially expressed gene.
Discussion
Perturbed PPIs have been identified as significant contributors to various diseases, with cancer being a notable example. Within the realm of these interactions, the MYC-MAX interaction holds particular importance. This interaction involves the binding of the MYC-MAX heterodimer to the E-box sequence located at the promoter of target genes and plays a crucial role in the development of the oncogenic phenotype.31,32 Protein-protein interactions have historically been viewed as challenging targets for drug development due to their intricate and dynamic nature. However, there have been promising instances of success in the development of small molecules that can effectively disrupt specific PPIs,33,34 some of which are candidates for cancer therapeutics.35,36
Challenges in targeting the dimerization between MYC-MAX indeed stem from the highly distorted nature of this interaction and the absence of well-defined binding pockets on flat interface of MYC protein.37,38 The bHLH domain of MYC plays a pivotal role in maintaining MYC-MAX dimer, as well as their binding to the E-box element. 39 Despite the importance of this interaction, numerous efforts over the past few decades to interfere with the dimer formation between MYC and MAX have faced limited success. The translation of discovered molecules into clinical applications has proven to be impractical.37,40,41 Several key compounds have been identified exhibiting the MYC-MAX inhibitory activity. Those molecules have failed to demonstrate efficacy into in vivo studies. The limitations are primarily attributed to lack of rational drug design and the intrinsically disordered nature of MYC in its monomeric form, which lacks a clear binding site for drugs development.
In our current study, we addressed these obstacles by identifying a potent druggable binding site within the bHLH domain of c-MYC. We utilized this site to identify a drug through the process of drug repurposing, which involves identifying new therapeutic applications for existing drugs. The strategy of drug repurposing/repositioning enables researchers to leverage the extensive knowledge and safety profiles of established drugs, potentially resulting in reduced time and costs compared to developing new drugs from scratch. Several notable successes have been achieved through drug repurposing, eg, repositioning of thalidomide and sildenafil. 42
A druggable site is characterized by its reasonable size, high solvent exposure, and a greater hydrophobic and lesser hydrophilic nature within the protein structure. 43 Utilizing a robust algorithm of the Sitemap module, we identified a site suitable for screening a large number of molecules, as this site exhibits all the properties of a druggable site in contrast to previous study, 44 which identified five targetable sites in low-resolution MYC protein structure.
Through virtual screening based on the ligand-protein structure and activity-based QSAR, we pinpointed the FDA-approved anti-cancer drug nilotinib as a potent interactor with MYC and an inhibitor of the MYC-MAX complex. Our MD simulation studies reveal that upon binding with nilotinib, the Asp420-Lys426 region of the MYC protein becomes stabilized by forming a helical structure. In the apo-MYC state, these helices are absent. Interestingly, previous studies have shown that this particular region of MYC is typically distorted, which facilitates its interaction with MAX to achieve stabilization. 45 Our analysis suggests that the binding of nilotinib likely inhibits the MYC-MAX interaction by stabilizing the helical structure of MYC in the region encompassing Asp420-Lys426. Nilotinib is a tyrosine kinase inhibitor (TKI) employed in the treatment of patients with CML patients who are positive for the Philadelphia chromosome (BCR::ABL1). The BCR::ABL1BCR::ABL1 fusion oncogene encodes the fusion protein kinase BCR::ABL1, which remains constitutively activated in individuals with CML. Nilotinib is chemically described as N-[3-[3-(1H-imidazolyl)propoxy]phenyl]-4-methyl-3-[[4-(3-pyridinyl)-2-pyrimidinyl]amino] benzamide. It has demonstrated both efficacy and safety in CML patients who are either resistant to or intolerant of imatinib, another potent TKI. Although nilotinib is a proven TKI, emerging evidence show that nilotinib exerts anti-tumor activity in cancers which do not harbor Philadelphia chromosome, for instance, adrenocortical carcinoma, 46 hepatocellular carcinoma, 47 and prostate carcinoma. 48 All the aforementioned cancers are negative for BCR::ABL1 ablation, strongly supporting the idea that nilotinib is not only a TKI but also exhibits its activity through other molecular mechanisms. In addition, the aforementioned cancer types express MYC at higher levels, supporting further investigation into the relationship between MYC and nilotinib.
Notably, hyperglycemia with impaired glucose metabolism is one of the most commonly observed events during nilotinib therapy. This effect is unique to nilotinib and not associated with other TKI, 49 suggesting that nilotinib might be involved in metabolic reprogramming through pathways that are independent of the tyrosine kinase pathway.
The literature provides ample evidence of MYC’s role in influencing metabolic adaptation. 50 Through its transcriptional activity, MYC controls the expression of numerous genes associated with glycolysis, oxidative phosphorylation, and the Warburg effect. 51 When MYC activity is inhibited, it can induce metabolic alterations in cancer cells. 52 In our study, we observed that approximately half of the genes that responded to nilotinib treatment are the targets of MYC too. This suggests the possibility that nilotinib may disrupt the MYC-MAX heterocomplex and consequently influence the metabolic reprogramming of cancer cells. All the previous studies mentioned above indicate a strong relationship between nilotinib and MYC. In summary, this study establishes a conceptual foundation for understanding how nilotinib binds to and forms a stable complex with MYC. Our findings indicate that nilotinib possesses remarkable inhibitory properties toward the MYC-MAX dimer. Further investigation in a preclinical setting to assess its efficacy and pharmacokinetic behavior holds promise for nilotinib as a potential therapeutic agent targeting MYC in conjunction with its role as a TKI.
Supplemental Material
sj-csv-2-bbi-10.1177_11779322241267056 – Supplemental material for Nilotinib: Disrupting the MYC-MAX Heterocomplex
Supplemental material, sj-csv-2-bbi-10.1177_11779322241267056 for Nilotinib: Disrupting the MYC-MAX Heterocomplex by Kamilla Shah, Maham Ansari, Samina Saeed, Abdul Wali and Muhammad Mushtaq Yasinzai in Bioinformatics and Biology Insights
Supplemental Material
sj-csv-3-bbi-10.1177_11779322241267056 – Supplemental material for Nilotinib: Disrupting the MYC-MAX Heterocomplex
Supplemental material, sj-csv-3-bbi-10.1177_11779322241267056 for Nilotinib: Disrupting the MYC-MAX Heterocomplex by Kamilla Shah, Maham Ansari, Samina Saeed, Abdul Wali and Muhammad Mushtaq Yasinzai in Bioinformatics and Biology Insights
Supplemental Material
sj-docx-1-bbi-10.1177_11779322241267056 – Supplemental material for Nilotinib: Disrupting the MYC-MAX Heterocomplex
Supplemental material, sj-docx-1-bbi-10.1177_11779322241267056 for Nilotinib: Disrupting the MYC-MAX Heterocomplex by Kamilla Shah, Maham Ansari, Samina Saeed, Abdul Wali and Muhammad Mushtaq Yasinzai in Bioinformatics and Biology Insights
Supplemental Material
sj-xlsx-4-bbi-10.1177_11779322241267056 – Supplemental material for Nilotinib: Disrupting the MYC-MAX Heterocomplex
Supplemental material, sj-xlsx-4-bbi-10.1177_11779322241267056 for Nilotinib: Disrupting the MYC-MAX Heterocomplex by Kamilla Shah, Maham Ansari, Samina Saeed, Abdul Wali and Muhammad Mushtaq Yasinzai in Bioinformatics and Biology Insights
Footnotes
Acknowledgements
The authors express their sincere gratitude to DrugBank for generously providing academic access to their library. They also acknowledge with appreciation the access granted to BIOVIA (San Diego, CA, USA) and Dassault Systèmes (Velizy-Villacoublay, France) for the Discovery Studio Visualizer software. In addition, they would like to thank Schrödinger, Inc (USA) for their kind provision of academic access to the Maestro platform for Glide and QSAR and MD simulation analysis.
Funding:
The author(s) received no financial support for the research, authorship, and/or publication of this article.
Declaration of conflicting interests:
The author(s) declared no potential conflicts of interest with respect to the research, authorship, and/or publication of this article.
Author Contributions
MM designed the project. KS and MA prepared the libraries for screening. KS and MA performed the screening and anlyzed the data. SS and KS perfromed the MD simulations. AW and MM and interpret the results. KS, MA, MM, AW contributed in manuscript writing.
Ethics approval and consent to participate
Not applicable
Consent for publication
All authors have read the final version of the manuscript and agreed to publish the data in accordance with Springer publishing policy.
Availability of data and materials
References
Supplementary Material
Please find the following supplemental material available below.
For Open Access articles published under a Creative Commons License, all supplemental material carries the same license as the article it is associated with.
For non-Open Access articles published, all supplemental material carries a non-exclusive license, and permission requests for re-use of supplemental material or any part of supplemental material shall be sent directly to the copyright owner as specified in the copyright notice associated with the article.