
Abstract
Intellectual disability (ID) is an early childhood neurodevelopmental disorder that is characterized by impaired intellectual functioning and adaptive behavior. It is one of the major concerns in the field of neurodevelopmental disorders across the globe. Diversified approaches have been put forward to overcome this problem. Among all these approaches, high throughput transcriptomic analysis has taken an important dimension. The identification of genes causing ID rapidly increased over the past 3 to 5 years owing to the use of sophisticated high throughput sequencing platforms. Early monitoring and preventions are much important for such disorder as their progression occurs during fetal development. This study is an attempt to identify differentially expressed genes (DEGs) and upregulated biological processes involved in development of ID patients through comparative analysis of available transcriptomics data. A total of 7 transcriptomic studies were retrieved from National Center for Biotechnology Information (NCBI) and were subjected to quality check and trimming prior to alignment. The normalization and differential expression analysis were carried out using DESeq2 and EdgeR packages of Rstudio to identify DEGs in ID. In progression of the study, functional enrichment analysis of the results obtained from both DESeq2 and EdgeR was done using gene set enrichment analysis (GSEA) tool to identify major upregulated biological processes involved in ID. Our findings concluded that monitoring the level of E2F targets, estrogen, and genes related to oxidative phosphorylation, DNA repair, and glycolysis during the developmental stage of an individual can help in the early detection of ID disorder.
Keywords
Introduction
Intellectual disability (ID) is an early childhood neurodevelopmental disorder that is characterized by impaired intellectual functioning and adaptive behavior. 1 Its prevalence is estimated to be around 1% in the general population and is gradually increasing in its frequency.2,3 Basic symptoms of ID include greater difficulty in learning new things, understanding concepts, solving problems, concentrating, and remembering. Intellectual functioning in general refers to intelligence that includes mental activities such as problem-solving, logical reasoning, learning, and verbal skills. Intellectual functioning is measured in intelligence quotient (IQ). An individual with IQ <70 is known to suffer from ID. Based on IQ, ID can be divided into mild (IQ: 55-70), moderate (IQ: 40-55), severe (IQ: 25-40), and profound (IQ <25). 4 Adaptive behavior refers to social, conceptual, and practical skills. Social skills include self-esteem, social responsibility, and interpersonal skills. Conceptual skills include an understanding of time, finance, and language. Practical skills include the ability to perform daily activities and interact with other people. 5
Intellectual disability is grouped into 3 categories based on their inheritance pattern, namely autosomal recessive intellectual disability (ARID), autosomal dominant intellectual disability (ADID), and X-linked intellectual disability (XID). 6 Autosomal recessive intellectual disability is a heterogeneous disorder that can be either syndromic or nonsyndromic. The syndromic form of ID is characterized by intellectual problems occurring with a group of other phenotypic features whereas nonsyndromic ID is characterized by a lack of associated pathology.7,8 Autosomal dominant intellectual disability generally occurs when an individual carries 1 copy of a mutant allele and 1 normal allele on a gene. It is generally caused due to heterozygous mutations in reported genes and copy number variations (CNVs). X-linked intellectual disability is caused due to genes present on the X chromosome. About 10% to 12% of X chromosome genes are known to be linked with ID. 6
Diagnosis of ID is usually possible through phenotypic symptoms such as delayed speech, hypotonia, and seizures. Intellectual disability can be caused due to various reasons including genetic, nongenetic, and environmental. 9 The heterogeneity of ID makes genetic and clinical diagnosis more challenging.3,10-12 Although different studies are defining the causes and symptoms of this social trauma, there is a great need to decode the etiopathogenesis of ID as a disease. With the advent of next-generation sequencing (NGS) and transcriptome profiling and analysis, it is possible to investigate such complex human diseases at the molecular level. The use of RNA sequencing (RNA-Seq) analysis can help us identify essential outputs about ID. RNA-Seq is an advanced sequencing technology that has completely revolutionized transcriptome analysis. This technology allows the quantification of gene expression levels and allele-specific expressions in a single experiment. RNA-Seq analysis can help us identify novel genes, splice isoforms, and noncoding RNA at an unprecedented level. 13 Therefore, in this study, we aim to identify differentially expressed genes (DEGs) for ID using available RNA-Seq data and further perform functional enrichment of such genes.
Materials and Methods
An intense literature survey was done to organize a well-defined pipeline for the study. The complete pipeline is illustrated in Figure 1.

Flowchart illustrating the complete pipeline of DEG analysis.
Raw data retrieval and preprocessing
The RNA-Seq data from blood and skin cells of ID patients were downloaded from Gene Expression Omnibus (GEO), 14 Sequence Read Archive (SRA), 15 and BioProject 16 (GSE77742, GSE74263, GSE90682, GSE98476, GSE108887, GSE145710, and PRJEB21964) of National Center for Biotechnology Information (NCBI) and were subsequently used for analysis in this study. The obtained data were generated on HiSeq using standard Illumina sequencing workflow. The low-quality bases and adaptor sequences were removed from the raw sequence through FastQC. 17 The human reference genome hg38 (2013 release) was used to align the trimmed sequences of each sample.
Normalization and statistical analysis
The aligned sequences of each sample were normalized using the Trimmed Mean of M values (TMM) method of EdgeR, 18 and the relative log2 expression of the DESeq2 package 19 in R. 20 Factoextra package of R was used to construct Principal Component Analysis (PCA) Biplots of each data set to ensure minimum batch effect in this study. Both the normalized gene count files were subjected to the Benjamini-Hochberg algorithm for the DEG analysis at the threshold of 5% false-discovery rate (FDR). The recognized DEGs from DESeq2 and EdgeR were compared for the identification of common DEGs.
Statistical analysis using gene set enrichment analysis
The normalized count file of each study was further used for the identification of upregulated biological processes in the patient sample as compared with the normal sample using gene set enrichment analysis (GSEA). 21 Gene set enrichment analysis is a computational methodology that tests the statistical significance of a priori-defined set of genes between 2 biological states. The normalized counts of each data were analyzed using the hallmark data set 22 of the molecular signature database (MSigDB) 23 of GSEA. The GSEA method calculates an enrichment score (ES) based on weighted Kolmogorov-Smirnov statistics. The statistical significance of the calculated ES (nominal P value) is estimated based on an empirical phenotype-based permutation test. In this study, default statistical parameters were used, that is, the number of permutations was set to 1000, the signal-to-noise metric was used for ranking genes, and the minimum and maximum size of gene sets was 15 and 500.
Results
Data retrieved and preprocessing
The NCBI GEO and BioProject were the main sources of NGS data, from where the transcriptomic sequencing data of ID patients and control (GSE77742, 24 GSE74263, GSE90682, 25 GSE98476, 26 GSE108887, GSE145710, 27 and PRJEB21964) were downloaded and subsequently used in this study. These included 26 control and 25 diseased samples. The low-quality sequences and adapter sequences were removed using trimmomatic and aligned with reference genome (hg38) for further analysis. Each sample of all the studies was independently run through FastQC to check the quality of the reads. The poor-quality reads and duplicated sequences were deleted. The alignment of all the sequences was done through the human genome (hg38, 2013 release). The aligned sequences were further used to count the expression of genes in each sample.
Normalization and statistical analysis
The results obtained from DESeq2 and EdgeR were compared for each study, and genes that were regarded as significantly expressed by both packages were further taken into consideration. Table 1 summarizes the results of DEG obtained from DESeq2 and EdgeR. The studies with multiple conditions were further divided into groups to avoid the normalization of data that could alter the results. Supplementary Figure 1 shows the results obtained from DESeq2 in the form of a heatmap, volcano plot, and MA (log ratio vs mean average) plot. Supplementary Figure 2 depicts the results obtained from EdgeR in the form of a heatmap, smear plot, and BCV (Biological coefficient of variant) plot. Supplementary Figure 5 shows the independence of patient and control samples in the form of PCA-Biplots. Supplemental materials 8 and 9 depict the results including P value, log2FoldChange, and FDR obtained through DESeq2 and EdgeR analysis.
Upregulated differentially expressed genes in patients of ID obtained from DESeq2 and EdgeR when compared with control healthy samples.

Abbreviation: ID, intellectual disability.
Statistical analysis using gene set enrichment analysis
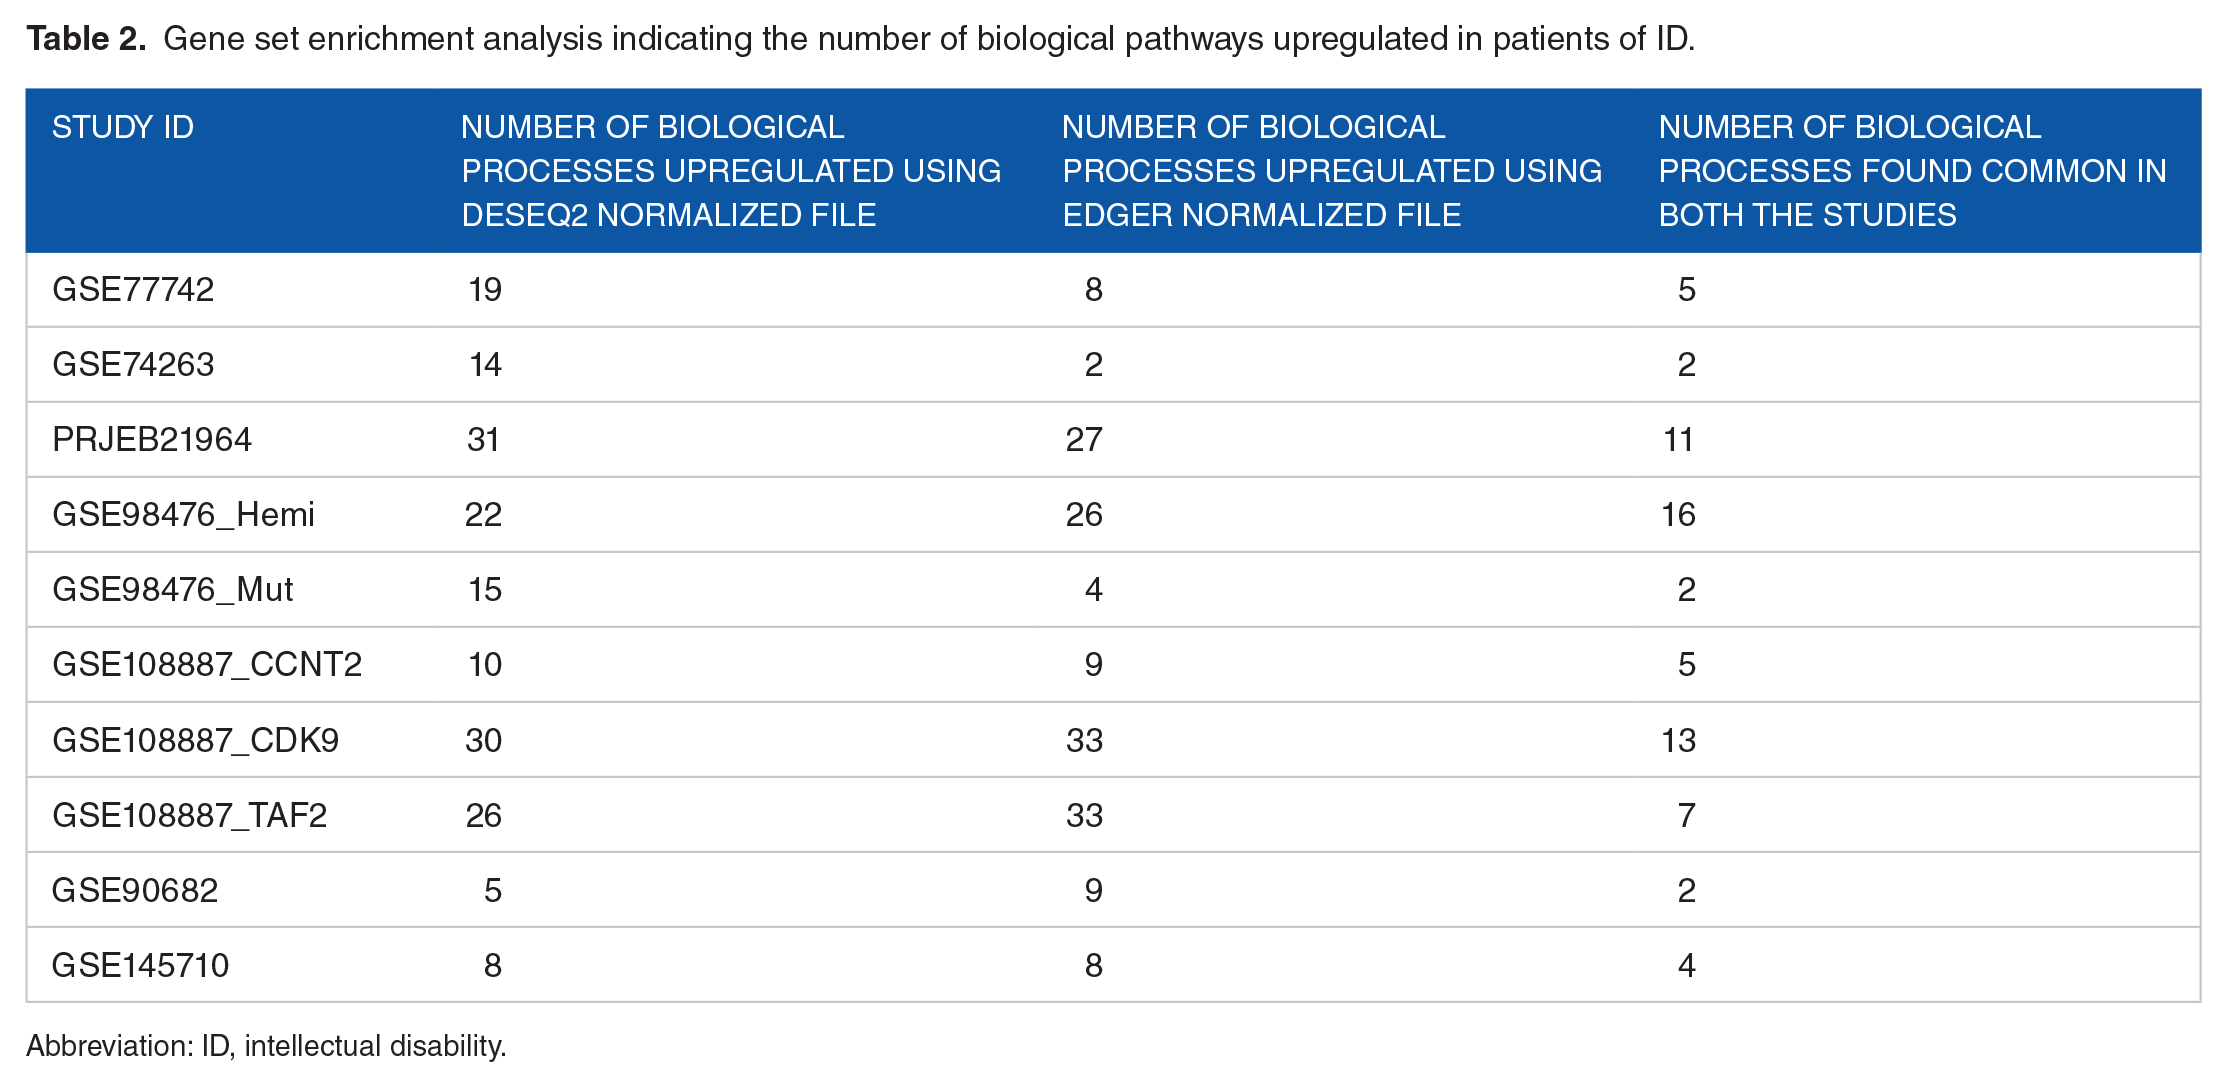
The normalized gene counts from both DESeq2 and edgeR were further used for GSEA. Each study into consideration was analyzed independently of the other. The role of biological processes which were found to be upregulated in the patient sample under both DESeq2 and EdgeR analysis was further analyzed. The number of permutations for the analysis was set to 1000. Weighted enrichment static and signal-to-noise metric were used for ranking genes. Table 2 summarizes the results of the GSEA. Figure 2 illustrates the major biological processes and the number of studies in which they are found to be upregulated in the patient sample. Biological processes that were found to be upregulated in the patient sample in maximum studies, that is, E2F targets and late estrogen response are depicted through graphs in Supplementary Figures 3 and 4. The dot plots of each data set representing the biological processes, the gene ratio, and FDR are given in Supplementary Figures 6 and 7.
Gene set enrichment analysis indicating the number of biological pathways upregulated in patients of ID.
Abbreviation: ID, intellectual disability.

The major biological processes found to be upregulated in the patient sample.(AKT: Ak strain transforming; DNA: Deoxyribonucleic acid; G2M: Growth phase II and M phase checkpoint; IL6: Inflammatory cytokine interleukin-6; JAK: Janus kinase; mTOR: Mammalian target of rapamycin; MYC: Myelocytomatosis oncogene; PI3K: Phosphatidylinositol-3-kinase; ROS: Reactive oxygen species; STAT5: Signal transducer and activator of transcription 5; TGF: Transforming growth factor; UV: Ultraviolet).
Comparison of the results with other disorders
The similar studies were carried out on different disorders to identify whether the identified gene is specific for ID or not. Different disorders such as epilepsy, bipolar disorder, dementia, and fragile X syndrome (FXS) were taken into consideration for the comparison. The DEGs in autism spectrum disorder (ASD) were also analyzed following similar methodology because of its close link with ID disorder. The data used for different studies and the number of DEGs obtained using DESeq2 and EdgeR have been listed in Table 3 below. On comparing the results of all the diseases, there were no genes identified as commonly expressed in all 5 diseases. Only 5 genes, that is, BTBD1, DNAJA1, HSPA8, PLEKHB2, and G3BP2 were identified as the upregulated genes between bipolar disorder and epilepsy. The 2 genes, that is, NNAT and ZNF208 found to be upregulated in FXS were explicitly enriched in patients with FXS only. Figure 3 depicts the commonly expressed genes in different disorders in the form of a Venn diagram.
Details of data used for the analysis of differentially expressed genes in epilepsy, bipolar disorder, dementia, and fragile X syndrome.

Abbreviations: ASD: autism spectrum disorder; FXS: fragile X syndrome; ID, intellectual disability.

The upregulated genes expressed commonly in different disorders depicted in the form of a Venn diagram.
Discussion
Intellectual disability is one of the major issues of concern in the field of neurodevelopmental disorders across the globe. Since such disorders are caused during the developmental stages of a child, it is very important to monitor them at an early stage itself. High throughput sequencing put reveals various facts of genomic science underlying the disease. This gives enormous scope to the researcher to decode the mystery of the genome. Previous studies were based on gene findings and expression analysis at a limited level but the transcriptome data have given a new vision in the form of DEG analysis coupled with functional enrichment. This study signifies the identification of DEGs through comparative studies in the results of DESeq2 and EdgeR analysis. The GSEA was also carried out on both results to identify upregulated biological processes in the case of patients with ID.
Our findings revealed a very significant output about the identification of related biological processes and pathways found to be involved in the progression of ID. It is well evident that E2F targets are strongly related to neurodevelopmental delay and other pathways such as glycolysis, oxidative phosphorylation, late estrogen response, DNA repair, and MYC (Myelocytomatosis oncogene) targets V1 and V2 also contribute to the onset of ID. E2F target genes are important genes that regulate the cell cycle. 32 The cell cycle machinery is a pivotal regulator of brain development and function by influencing key cell fate decisions, typically via E2F transcription factor activity.33-36 pRb/E2f pathway is a cell cycle regulatory pathway that acts as an important effector of fate decisions in various cell types, including the brain. 37 Cell cycle proteins play an essential part in various cell fate decisions and, therefore, have pivotal roles in neurogenesis and brain development. Cell cycle dynamics strongly influence neural precursor cell (NPC) maintenance and neurogenesis, and gain- or loss-of-function studies have demonstrated key roles for cell cycle proteins, including the E2f family, in NPC fate decisions.38-40 Therefore, upregulation of E2F target genes can disrupt cell cycle machinery and lead to impaired development of the brain which causes ID. Similarly, MYC targets V1 and V2 also play an important role in the regulation of the cell cycle. The upregulation of MYC targets in patient samples further ensures the role of cell cycle progression in neurodevelopmental delay and ID. Estrogen has the capability to impose neuroprotective actions.41,42 Estrogen signaling plays an important role in normal nervous system development. Estrogen signaling has also been seen to be associated with neurodegenerative disorders in females and neurodevelopmental disorders in males. Estrogen signaling ensures healthy brain development. Therefore, a late estrogen response in children can make them susceptible to neurodevelopmental delay that leads to ID in such individuals. Mutations in the genes involved in glycolysis can further upregulate glycolysis. Glycerol kinase is an important enzyme that links glycolysis, glycogenesis, and gluconeogenesis together. 43 In the case of glycerol kinase deficiency (GKD), glycerol accumulates in the bloodstream and can lead to an infantile or juvenile form of GKD. The infantile form is associated with severe developmental delay and juvenile patients are often symptomatic. Glycerol kinase deficiency in infants often leads to ID in such patients because of the close association between genes of GKD and ID. 44 Oxidative phosphorylation or mitochondrial biogenesis plays a key role in neurogenesis and neuroplasticity. 45 Dysfunctioning of respiratory chain complexes and ATP (Adenosine triphosphate) synthase in mitochondria leads to reduced ATP production and increased ROS (Reactive oxygen species) production leading to oxidative stress. This defect in mitochondrial energy production machinery plays an important role in the pathogenesis of numerous neurological disorders.46,47 This results in phenotypes such as developmental delay, muscle weakness, hypotonia, 48 and more that affects highly oxidative tissues such as the brain, heart, muscle, and kidney.49,50 Therefore, oxidative phosphorylation alters brain tissues leading to neurodevelopmental delay and ID.
Furthermore, the study identified IFI44L (interferon-induced protein 44 like) and IFIT3 (interferon-induced protein with tetratricopeptide repeats 3) as the significantly upregulated gene in most of the patients of ID. Interferon-induced proteins have been majorly studied for their role in immune response. However, the recent researches done in neuroscience indicate an active role of interferon in brain functions. 51 The normal development of cerebral cortex depends on the migration of neural crest cell (NCC). The prolonged exposure or accumulation of interferon-induced proteins in brain leads to abnormal migration of NCC to brain leading to developmental delay and ID. 52
Therefore, our findings conclude that monitoring the level of E2F targets, estrogen, and genes related to oxidative phosphorylation, DNA repair, and glycolysis during the developmental stage of an individual can help in the early detection of ID as disease and other related neurodevelopmental disorders as well. Prevention is always better than cure so these early detections at the genetic or genomic level can further aid in proper and early diagnosis so that the right decision can be taken at the right time.
A similar approach was used by Trivedi et al, 53 in her recent study done on patients with ASD. Autism spectrum disorder is a neurodevelopmental disorder that is very closely linked to ID. Therefore, it is crucial to compare the results with ASD to analyze the explicit expression of the pathways in ID patients. The study identified CYC1 gene (cycle gene) as the common DEG in patients with ASD. CYC1 gene is an important regulatory gene in pathways such as ATP synthesis pathway, FAS signaling pathway, and Huntington’s disease pathway. The gene is also known to play an important role in mitochondrial dysfunction and generation of allergic or inflammatory responses in ASD patients. The same methodology was run on different disorders as well to determine that the gene sets are enriched explicitly in patients with ID. It was a clear revelation that the gene sets obtained in different disorders were different and rarely matched with each other. Only 5 genes were seen to be expressed in both epilepsy and bipolar disorder patients, that is, BTBD1, DNAJA1, HSPA8, PLEKHB2, and G3BP2. These genes are known to be involved in exercise-induced circadian regulation, 54 methylation, and C3HC4-type RING finger domain binding. NNAT and ZNF208 were found to be upregulated in patients with FXS only. NNAT gene is known to be involved in brain development, protein lipoylation, 55 and positive regulation of insulin secretion. 56 ZNF208 is more actively involved in facilitating DNA binding, 56 zinc ion binding, 57 and metal ion binding. The gene set explicitly expressed in bipolar disorder is known to be involved in biological processes such as synaptic signaling, trans-synaptic signaling, chemical synaptic transmission, cell-cell signaling, and nervous system development. The gene set explicitly expressed in epilepsy patients is known to be involved in biological processes such as synapse pruning, integrin activation, cellular response to testosterone stimulus, regulation of L-glutamate import across plasma membrane, positive regulation of protein localization to early endosome, fatty acid degradation, and metabolism.
Thus, the transcriptomic data analysis reveals the overexpression of different biological pathways in different disorders.
Although the results are very much convincing and give much impact on findings of ID, yet the only limitation of the study lies that the available experimental data of ID from GEO are critically analyzed and well interpreted rather than own sequenced data. It is well established that in silico interpretations majorly give significant findings as this is the importance and cost effectiveness of computational experiments; hence, this limitation may also be overruled when results are in linearity with the study hypothesis.
Supplemental Material
sj-pdf-1-bbi-10.1177_11779322231224665 – Supplemental material for Comparative Transcriptomics Data Profiling Reveals E2F Targets as an Important Biological Pathway Overexpressed in Intellectual Disability Disorder
Supplemental material, sj-pdf-1-bbi-10.1177_11779322231224665 for Comparative Transcriptomics Data Profiling Reveals E2F Targets as an Important Biological Pathway Overexpressed in Intellectual Disability Disorder by Prekshi Garg, Farrukh Jamal and Prachi Srivastava in Bioinformatics and Biology Insights
Supplemental Material
sj-pdf-2-bbi-10.1177_11779322231224665 – Supplemental material for Comparative Transcriptomics Data Profiling Reveals E2F Targets as an Important Biological Pathway Overexpressed in Intellectual Disability Disorder
Supplemental material, sj-pdf-2-bbi-10.1177_11779322231224665 for Comparative Transcriptomics Data Profiling Reveals E2F Targets as an Important Biological Pathway Overexpressed in Intellectual Disability Disorder by Prekshi Garg, Farrukh Jamal and Prachi Srivastava in Bioinformatics and Biology Insights
Supplemental Material
sj-pdf-3-bbi-10.1177_11779322231224665 – Supplemental material for Comparative Transcriptomics Data Profiling Reveals E2F Targets as an Important Biological Pathway Overexpressed in Intellectual Disability Disorder
Supplemental material, sj-pdf-3-bbi-10.1177_11779322231224665 for Comparative Transcriptomics Data Profiling Reveals E2F Targets as an Important Biological Pathway Overexpressed in Intellectual Disability Disorder by Prekshi Garg, Farrukh Jamal and Prachi Srivastava in Bioinformatics and Biology Insights
Supplemental Material
sj-pdf-4-bbi-10.1177_11779322231224665 – Supplemental material for Comparative Transcriptomics Data Profiling Reveals E2F Targets as an Important Biological Pathway Overexpressed in Intellectual Disability Disorder
Supplemental material, sj-pdf-4-bbi-10.1177_11779322231224665 for Comparative Transcriptomics Data Profiling Reveals E2F Targets as an Important Biological Pathway Overexpressed in Intellectual Disability Disorder by Prekshi Garg, Farrukh Jamal and Prachi Srivastava in Bioinformatics and Biology Insights
Supplemental Material
sj-pdf-5-bbi-10.1177_11779322231224665 – Supplemental material for Comparative Transcriptomics Data Profiling Reveals E2F Targets as an Important Biological Pathway Overexpressed in Intellectual Disability Disorder
Supplemental material, sj-pdf-5-bbi-10.1177_11779322231224665 for Comparative Transcriptomics Data Profiling Reveals E2F Targets as an Important Biological Pathway Overexpressed in Intellectual Disability Disorder by Prekshi Garg, Farrukh Jamal and Prachi Srivastava in Bioinformatics and Biology Insights
Supplemental Material
sj-pdf-6-bbi-10.1177_11779322231224665 – Supplemental material for Comparative Transcriptomics Data Profiling Reveals E2F Targets as an Important Biological Pathway Overexpressed in Intellectual Disability Disorder
Supplemental material, sj-pdf-6-bbi-10.1177_11779322231224665 for Comparative Transcriptomics Data Profiling Reveals E2F Targets as an Important Biological Pathway Overexpressed in Intellectual Disability Disorder by Prekshi Garg, Farrukh Jamal and Prachi Srivastava in Bioinformatics and Biology Insights
Supplemental Material
sj-pdf-7-bbi-10.1177_11779322231224665 – Supplemental material for Comparative Transcriptomics Data Profiling Reveals E2F Targets as an Important Biological Pathway Overexpressed in Intellectual Disability Disorder
Supplemental material, sj-pdf-7-bbi-10.1177_11779322231224665 for Comparative Transcriptomics Data Profiling Reveals E2F Targets as an Important Biological Pathway Overexpressed in Intellectual Disability Disorder by Prekshi Garg, Farrukh Jamal and Prachi Srivastava in Bioinformatics and Biology Insights
Supplemental Material
sj-xlsx-10-bbi-10.1177_11779322231224665 – Supplemental material for Comparative Transcriptomics Data Profiling Reveals E2F Targets as an Important Biological Pathway Overexpressed in Intellectual Disability Disorder
Supplemental material, sj-xlsx-10-bbi-10.1177_11779322231224665 for Comparative Transcriptomics Data Profiling Reveals E2F Targets as an Important Biological Pathway Overexpressed in Intellectual Disability Disorder by Prekshi Garg, Farrukh Jamal and Prachi Srivastava in Bioinformatics and Biology Insights
Supplemental Material
sj-xlsx-11-bbi-10.1177_11779322231224665 – Supplemental material for Comparative Transcriptomics Data Profiling Reveals E2F Targets as an Important Biological Pathway Overexpressed in Intellectual Disability Disorder
Supplemental material, sj-xlsx-11-bbi-10.1177_11779322231224665 for Comparative Transcriptomics Data Profiling Reveals E2F Targets as an Important Biological Pathway Overexpressed in Intellectual Disability Disorder by Prekshi Garg, Farrukh Jamal and Prachi Srivastava in Bioinformatics and Biology Insights
Supplemental Material
sj-xlsx-8-bbi-10.1177_11779322231224665 – Supplemental material for Comparative Transcriptomics Data Profiling Reveals E2F Targets as an Important Biological Pathway Overexpressed in Intellectual Disability Disorder
Supplemental material, sj-xlsx-8-bbi-10.1177_11779322231224665 for Comparative Transcriptomics Data Profiling Reveals E2F Targets as an Important Biological Pathway Overexpressed in Intellectual Disability Disorder by Prekshi Garg, Farrukh Jamal and Prachi Srivastava in Bioinformatics and Biology Insights
Supplemental Material
sj-xlsx-9-bbi-10.1177_11779322231224665 – Supplemental material for Comparative Transcriptomics Data Profiling Reveals E2F Targets as an Important Biological Pathway Overexpressed in Intellectual Disability Disorder
Supplemental material, sj-xlsx-9-bbi-10.1177_11779322231224665 for Comparative Transcriptomics Data Profiling Reveals E2F Targets as an Important Biological Pathway Overexpressed in Intellectual Disability Disorder by Prekshi Garg, Farrukh Jamal and Prachi Srivastava in Bioinformatics and Biology Insights
Footnotes
Acknowledgements
The authors would like to acknowledge the support provided by Amity Institute of Biotechnology, Amity University, Uttar Pradesh, Lucknow Campus for the completion of the study. They would also acknowledge all individuals who supported their work directly or indirectly. They gratefully acknowledge the support provided by Bioinformatics tools, software and databases in the work.
Funding:
The author(s) received no financial support for the research, authorship, and/or publication of this article.
Declaration of Conflicting Interests:
The author(s) declared no potential conflicts of interest with respect to the research, authorship, and/or publication of this article.
Author Contributions
Prekshi Garg conceived, designed, and performed the experiments, and prepared figures, tables, and the original draft. Farrukh Jamal reviewed the draft and finalized the manuscript. Prachi Srivastava conceived and designed the experiment, and reviewed and finalized the final draft.
Availability of Data and Materials
Ethics Approval and Consent to Participate
Not applicable.
Patient Consent for Publication
Not applicable.
Supplemental Material
Supplemental material for this article is available online.
References
Supplementary Material
Please find the following supplemental material available below.
For Open Access articles published under a Creative Commons License, all supplemental material carries the same license as the article it is associated with.
For non-Open Access articles published, all supplemental material carries a non-exclusive license, and permission requests for re-use of supplemental material or any part of supplemental material shall be sent directly to the copyright owner as specified in the copyright notice associated with the article.