
Abstract
Background:
Osteoporosis is a bone disease that increases the patient’s risk of fracture. We aimed to identify robust marker genes related to osteoporosis based on different bioinformatic methods and multiple datasets.
Methods:
Three datasets from Gene Expression Omnibus (GEO) were utilized for analysis separately. Significantly differentially expressed genes (DEGs) from comparing high hip and low hip low bone mineral density (BMD) groups in the first dataset were identified for Gene Ontology (GO), Gene set enrichment analysis (GSEA) and Kyoto encyclopedia of genes and genomes (KEGG) to investigate the discrepantly enriched biological processes between high hip and low hip group. Last absolute shrinkage and selection operator (LASSO), SVM model and protein-protein interaction (PPI) regulatory network were performed and generated robust marker genes for downstream TF-target and miRNA-target prediction.
Results:
Several DEGs between high hip BMD group and low hip BMD group were obtained. And the metabolism-related pathways such as metabolic pathways, carbon metabolism, glyoxylate and dicarboxylate metabolism shown enrichment in these DEGs. Integration with LASSO regression analysis, 8 differential expression genes (SH3BP1, NARF, ANKRD34B, RNF40, ZNF473, AKT1, SHMT1, and VASH1) in GSE62402 were identified as the optimal differential genes combination. Moreover, the SVM validation analysis in GSE56814 and GSE56815 datasets showed that the characteristic gene combinations presented high diagnostic effects, and the model AUC areas for GSE56814 was 0.899 and for GSE56815 was 0.921. Furthermore, the subcellular localization analysis of the 8 genes revealed that 4 proteins were located in the cytoplasm, 3 proteins were located in the nucleus, and 1 protein was located in the mitochondria. Additionally, the related TFs and miRNAs by performing TF-target and miRNA-target prediction for 5 genes (AKT1, SHMT1, ZNF473, RNF40 and VASH1) were investigated from PPI network.
Conclusion:
The optimal differential genes combination (SH3BP1, NARF, ANKRD34B, RNF40, ZNF473, AKT1, SHMT1, and VASH1) presented high diagnostic effect for osteoporosis risk.
Introduction
Osteoporosis is a widespread disease of bone metabolism, manifested mainly by low bone mineral density (BMD). As one kind of chronic diseases, osteoporosis requires consistent treatment which indicate consequences such as bone turnover or fracture if certain categories of its drug is delayed (eg, the world wide pandemic, COVID-19). 1 Although bone loss is preventable by early diagnosis and several measures such as providing proper nutrition in childhood and keeping physical activity, 2 osteoporosis is still a problem worldwide.
One of the key pathophysiological mechanisms of osteoporosis is excessive bone resorption (caused by osteoclasts) over bone formation (caused by osteoblasts). 3 Peripheral blood mononuclear (PBMs) cells may act as precursors for osteoclasts (bone resorbing cells) 4 especially for the adult peripheral skeleton (eg, femur as one of the most important skeletal sites) where circulating mononuclear cells provide the only source of osteoclast precursors, making PBMs a suitable cellular model for the study of osteoporosis. 5 There have been a massive number of studies analyzing genes for dysregulation between high and low BMD,6 -9 but there is still a lack of validated markers, while most of the studies were limited to a single dataset without further mechanistic exploration of the screened genes. Therefore, in this analysis, we combined multiple datasets, used LASSO regression for screening of marker features between high and low BMD, and used the validation set data to construct SVM model to evaluate the diagnostic accuracy of the feature genes, and further combined with the upstream miRNAs of the feature genes and transcription factor regulatory mechanisms to explore downstream functions. And the flow chart of this study was shown in Supplemental Figure S1.
Materials and Methods
The collection of transcriptome data
Three datasets (GSE62402, GSE56814, and GSE56815) containing osteoporosis samples’ transcriptome gene expression data were obtained from Gene Expression Omnibus (GEO) 10 (https://www.ncbi.nlm.nih.gov/) database of NCBI.
Usually, women over the age of 50 are the most likely people to develop osteoporosis (with nearly a 4 times higher rate); however, the data of this study were downloaded from GEO public data, which did not included the age information of the sample, so the study did not analyze the age. Briefly, 10 PBM samples (including 5 high hip BMD subjects and 5 low hip BMD subjects) from GSE62402, and 73 PBM samples (including 42 high hip BMD subjects and 31 low hip BMD subjects) from GSE56814 were detected using the GPL5175 [HuEx-1_0-st] Affymetrix Human Exon 1.0 ST Array [transcript (gene) version]. Furthermore, 80 PBM samples (including 40 high hip BMD subjects and 40 low hip BMD subjects) from GSE56815, were detected using the platform GPL96 [HG-U133A] Affymetrix Human Genome U133A. Among them, GSE62402 was used for mining key characteristic genes, while GSE56814 and GSE56815 were validation datasets to verify the efficacy of characteristic genes in diagnosing high and low BMD.
Data preprocessing
For each of the 3 datasets, Array expression matrix file was pre-processed and normalized. Then platform probe annotations were downloaded directly and probes mapped to gene symbols were kept for gene expression. Average expression value was taken as one gene’s expression value if different probes mapped to one same gene.
Identification of significantly differentially expressed mRNA
In GSE62402 cohort, “limma” package (version: 3.34.7) 11 was applied to identify differentially expressed mRNA between high hip BMD group and low hip group. mRNAs which shown P-value <.05 and absolute log (fold change) >.263 (1.2-fold change) were determined to be differentially expressed.
Enrichment analysis
For differential expressed mRNAs, online website the database for annotation, visualization and integrated discovery (DAVID) 12 (Version 6.8, https://david-d.ncifcrf.gov/) was performed to generate enriched Gene Ontology (GO) biology progress (BP) 13 and KEGG pathway. 14 Terms with P-value <.5 and enriched counts >2 were considered enriched.
All mRNA sorted by log (fold change) were loaded into “clusterProfiler” package (Version 3.1.6) 15 for GSEA analysis with MSigDB 16 (c2.cp.kegg.v7.1.symbols.gmt) dataset as background gene set. “Benjamini & Hochberg” (BH) method was applied to generate adjusted P-value and pathways with adjusted P-value <.05 were considered to be significant.
Significant markers screening and validation
Firstly, optimization algorithm was performed to screen significant markers from GSE62402. Expression values of differential genes in each sample combined with the grouping information of the samples were obtained, LASSO algorithm was used for the screening of the feature genes. LASSO algorithm used L1-norm to punish model parameters, which avoided model overfitting. To filter the feature genes, the “glmnet” package (Version 4.0-2 https://cran.r-project.org/web/packages/glmnet/index.html) 17 was used for regression analysis of the target gene set, with parameters: nfold = 20 (20-fold cross-validation).
Then the optimal feature gene combinations were validated in the other 2 datasets GSE56814 and GSE56815. Briefly, the expression levels of the selected feature genes were first extracted from GSE62402 and their expression levels in different groups were demonstrated.
Next, Support Vector Machine (SVM) method 18 in “e1071” (Version 1.6-8, https://cran.r-project.org/web/packages/e1071) was utilized to construct a disease diagnosis classifier (Core: Sigmoid Kernel; Cross: 100-fold cross validation.). The model efficacy was evaluated by plotting ROC curves using the “pROC” package (Version 1.12.1) in GSE56814 and GSE56815, respectively.
Subcellular localization of signature gene proteins
The online tool WoLF PSORT (https://wolfpsort.hgc.jp/) 19 was used to perform subcellular localization of the proteins corresponding to the above key feature genes.
To perform subcellular localization, the species was set to animal, and the amino acid sequence corresponding to the protein was treated as input. In addition, based on the score of each gene protein in each cellular location was obtained by prediction, the cellular location with the highest score was selected as the final cellular location of the corresponding protein.
Construction of PPI network
The gene proteins that interact with the proteins encoded by the signature genes were predicted and analyzed in STRING (Version: 10.0, http://www.string-db.org/) database. 20 The input gene set was the key signature genes obtained above, the species was set to homo and the parameter PPI score was set to 0.9 (highest confidence). After obtaining the PPI relationship pairs, the network graphs were constructed using Cytoscape software (version 3.4.0, http://chianti.ucsd.edu/cytoscape-3.4.0/). 21 The CytoNCA plug-in (Version 2.1.6, http://apps.cytoscape.org/apps/cytonca) 22 was used to perform node connectivity analysis with parameters set to “without weight.”
KEGG pathway enrichment analysis was then performed with the R package “clusterProfiler” for each of the above protein genes that have interactions with key feature genes
Upstream transcription factor and miRNA prediction of signature genes
Upstream transcription factor (TF) prediction analysis of the signature genes in PPI network was performed using the “iRegulon” plug-in (Version 1.3, http://iregulon.aertslab.org/) 23 of Cytoscape software, with default parameter settings as following: Motif collection: 10K (9713 PWMs); Track collection: 1120 ChIP-seq tracks (ENCODE raw signals); Minimum NEScore: 3; Rank threshold for visualization: 5000; ROC threshold for AUC calculation (%): 0.03; Minimum identity between orthologous genes: 0; Maximum false discovery rate (FDR) on motif similarity: 0.001; Motif rankings database: 20 kb centered around TSS (7 species); Track rankings database: 20 kb centered around TSS (ChIP-seq-derived). Then, the transcriptome factors that bind at least 3 target proteins were selected, and TF-target pairs were used to construct transcription factor regulatory networks.
For upstream miRNA, mirwalk2.0 (http://zmf.umm.uni-heidelberg.de/apps/zmf/mirwalk2/) 24 combined with results from 6 commonly used databases (miRWalk, Microt4, miRanda, PITA, RNA22, and Targetscan) was performed for miRNA prediction for the obtained key feature genes. If the predicted miRNA-mRNA relationship pairs appeared in the prediction results of ⩾5 databases mentioned above, this miRNA was considered to regulate the corresponding target gene, and miRNA-mRNA relationship pairs were kept for constructing network using Cytoscape software.
Statistical analysis
All packages used in this study was R (version: 3.6.1) package. For P-value or adjusted P-value, we considered .05 as statistically significant.
Results
Differentially expressed genes were enriched in metabolism related pathways
Using “limma” package with described method, 23 up-regulated and 233 down-regulated differentially expressed mRNAs between high hip BMD group and low hip BMD group was identified in GSE62402 (Figure 1A, Supplemental File 1). Pattern in heatmap of differential mRNAs also shown most of the differential mRNAs were significant down-regulated in high hip BMD group (Figure 1B). Functional annotation of these differentially expressed genes showed that a total of 18 GO BP terms and 13 KEGG pathways were enriched (Figure 1C and D; Supplemental File 2), respectively. More interesting, these genes were enriched in multiple metabolism-related biological processes and pathways, such as metabolic pathways, carbon metabolism, glyoxylate and dicarboxylate metabolism and so on.

Differential expressed genes and their enriched pathways. (A) Volcano plot, blue and red dots indicate significantly down-regulated and up-regulated DEGs, respectively, red horizontal line indicates P-value <.05, 2 vertical lines indicate |log2(FC)|>0.263. (B) Heat map of differentially expressed genes, the red and green horizontal bars at the top indicate high hip BMD and low hip BMD samples, respectively, and the color from blue to red in the plot indicates the expression values change from small to large. Top10 GO BP (C) and KEGG pathway (D) for differential gene enrichment. Different colors in (C) indicate different GO Term, the line indicates that the gene is enriched in a certain GO BP, the size of the bubble in (D) indicates the number of enriched genes, the color from blue to red indicates that the P-value decreases. Top 5 enriched GSEA pathways in high hip BMD group (E) and low hip BMD group (F). NES > 0 indicated that this pathway was up-regulated, and NES < 0 indicated that this pathway was down-regulated.
In addition, GSEA pathway enrichment analysis showed that 7 and 27 KEGG pathways were enriched in high hip BMD group and low hip BMD group ( Figure 1E and F; Supplemental File 3,), of which many terms reflect different kinds of important signature such as hedgehog signaling pathway and protein export pathway.
Screening and validation of marker genes
Based on the expression levels of the differential genes in GSE62402, the LASSO regression algorithm was used for the screening of the optimal differential genes combination, and the parameter plot of the algorithm is shown in Figure 2A. For the accuracy of the model, we chose lambda.min as λ for model construction, and finally detected 8 differential genes: SH3BP1, NARF, ANKRD34B, RNF40, ZNF473, AKT1, SHMT1, and VASH1. Furthermore, the expression of the 8 genes in the high bone density group were all down-regulated in comparison to that in the low bone density group (Figure 2B).

Marker genes’ identification and validation. (A) Plot of λ selection in the LASSO model (The 2 dashed lines indicate 2 particular λ values, lambda.min on the left and lambda.1se on the right, any value of lambda between them is considered appropriate. lambda.1se builds the simplest model with the smallest number of genes, while lambda.min increases accuracy and uses more genes). (B) Box plots of the distribution of the 8 characteristic genes under different bone density groups in GSE62402 (** indicates .01 < P-value < .05). (C) ROC plots of the diagnostic model for dataset GSE56814 (left) and GSE56815 (right) samples based on the 8 selected DEGs. (D) Protein subcellular localization.
Based on the 8 optimized feature differential genes, a sample risk diagnosis model to identify samples with high and low bone density was firstly constructed in GSE56814 and GSE56815 datasets, respectively. And the ROC curves were then used to evaluate the sample identification diagnosis effect. As shown in Figure 2C, in both datasets, the characteristic gene combinations presented high diagnostic effects, and the model AUC areas both reached above 0.8 (AUC = 0.899 for GSE56814 and AUC = 0.921 for GSE56815).
Subcellular localization of marker genes
The proteins corresponding to the above 8 key signature genes were subcellularly localized using the online tool WoLF PSORT as described in methods.
As shown is Figure 2D, 4 proteins (ANKRD34B, AKT1, SHMT1, and NARF) were located in the cytoplasm, 3 proteins (SH3BP1, RNF40, and ZNF473) were located in the nucleus, and 1 protein VASH1 was located in the mitochondria.
PPI network construction
The STRING database was used to search for the proteins associated with the above 8 signature genes’ proteins, and only 5 proteins, including AKT1, SHMT1, ZNF473, RNF40, and VASH1, were finally identified as the key genes’ proteins which correspond to 188, 21, 8, 17, and 1 interaction proteins, respectively (Supplemental File 4). For the 5 key genes’ proteins, we constructed the PPI network (Figure 3A). According to the PPI network, 2 differential expressed genes’ proteins, including INPPL1 (down-regulated) and PDGFB (up-regulated) were found to have close interaction relationship with AKT1.

PPI network and regulatory network of upstream TFs and miRNAs. (A) Protein interaction network: squares indicate the 5 signature genes, diamonds indicate the predicted interacting protein genes from the database, green indicates down-regulated genes, red indicates up-regulated genes, and connecting lines indicate protein interaction relationships; (B) Transcription factor regulatory network: yellow circles indicate predicted transcription factors, green squares indicate 5 signature genes, the darker the color, the larger the absolute value of the difference multiplicity, and gray arrows indicate transcription factor regulatory target genes; (C) miRNA-target regulatory network: blue circles indicate predicted miRNAs, green hexagons indicate 7 signature genes. The darker the color, the larger the absolute value of the difference ploidy, and yellow arrows connect the miRNA regulatory target genes.
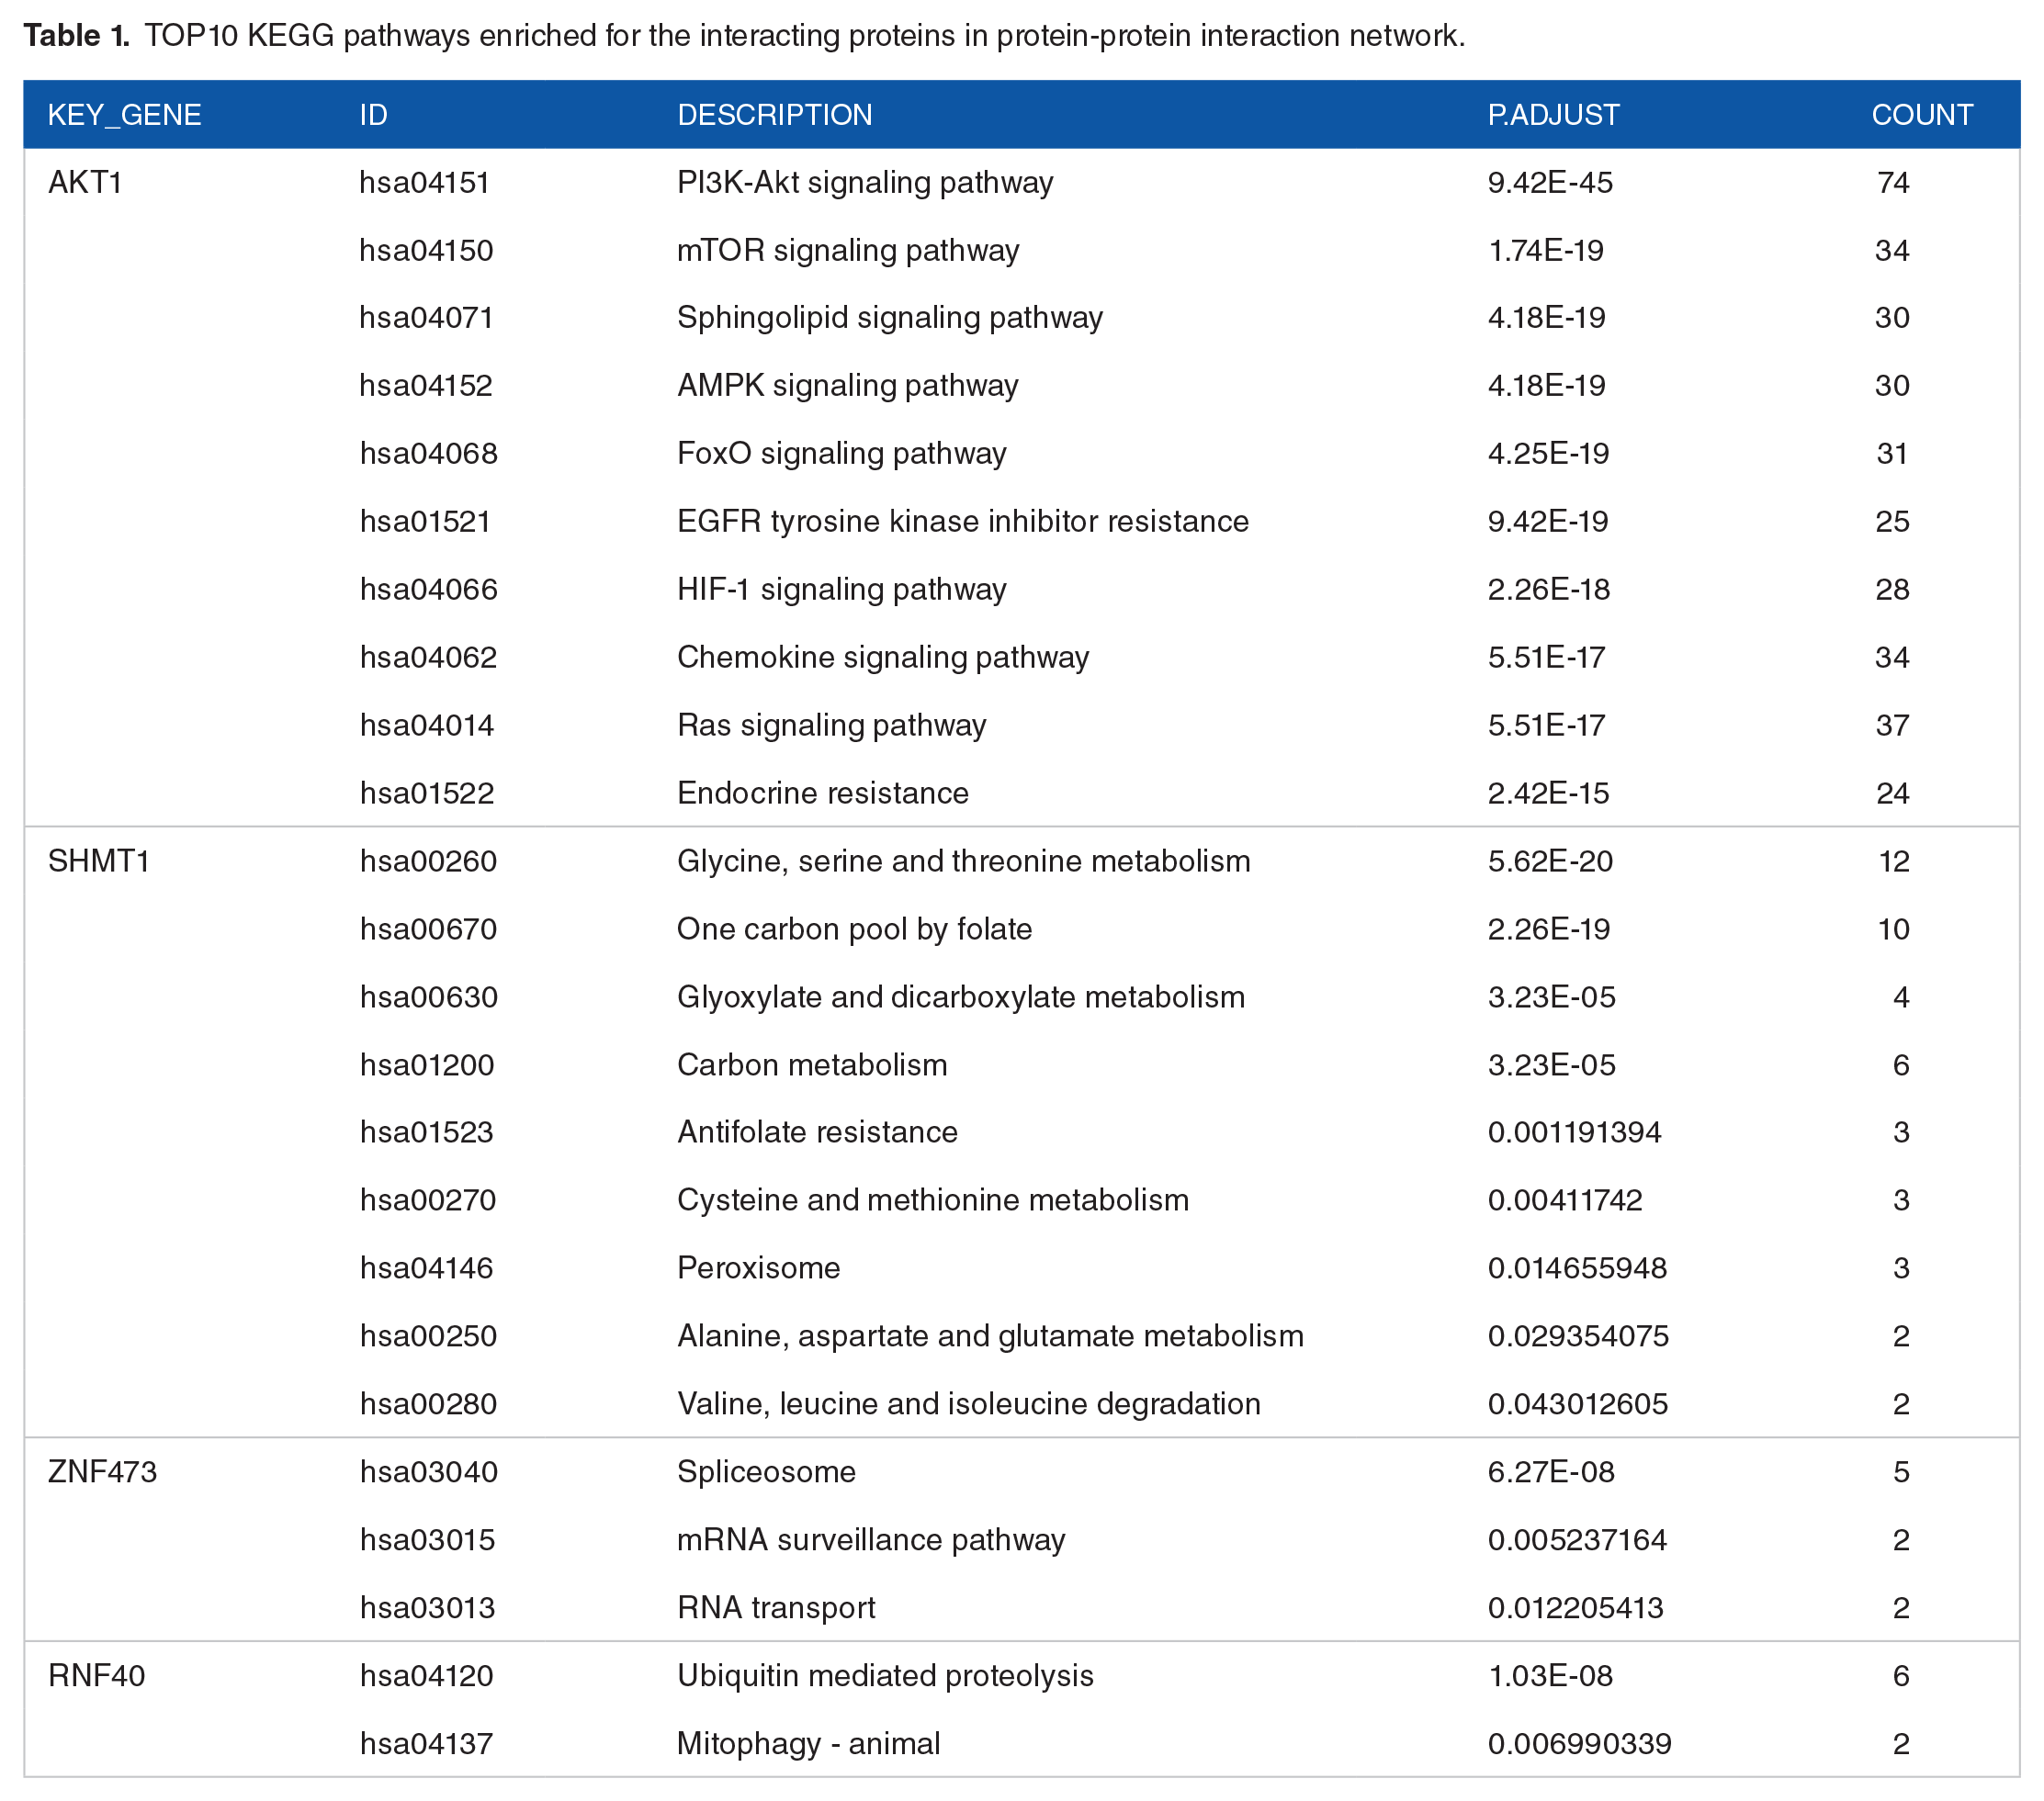
Further, the KEGG pathway enrichment analysis was performed for proteins interacting with the each of key genes in PPI network (Supplemental File 5). As illustrated in Table 1, the genes interacted with AKT1 were mainly enriched in PI3K-Akt signaling pathway, SHMT1 related genes were mainly enriched in metabolism related pathway, genes interacted with ZNF473 were mainly enriched in RNA shearing and transport pathway, genes interacted with RNF40 were mainly enriched in protein hydrolysis pathway and VASH1 related genes were not enriched to any pathway significantly.
TOP10 KEGG pathways enriched for the interacting proteins in protein-protein interaction network.
Prediction of upstream TFs and miRNAs
The upstream transcription factor prediction analysis on the 5 signature genes in PPI network were conducted. The upstreamTF which binds at least 3 signature genes were selected, and finally a total of 75 TFs met the requirements; moreover, 239 TF-target relationship pairs with the 5 signature genes were identified (Supplemental File 6). Finally, the transcription factor regulatory network was constructed (Figure 3B). According to the network, CEBPG, PRKAA1, STAT1, PRKAA2, and BRF1 were found to regulate 5 signature genes at the same time, which may be the key TFs.
Additionally, the upstream binding miRNAs for 7 signature genes (AKT1, ANKRD34B, RNF40, SH3BP1, SHMT1, VASH1, and ZNF473) were predicted as described in the method, and 386 miRNA-target relationship pairs were obtained (Supplemental File 7). According to the miRNA-target network (Figure 3C), hsa-miR-1200, hsa-miR-1915-3p, hsa-miR-15a-3p, hsa-miR-615-5p, hsa-miR-942-5p, hsa-miR-513a-5p, hsa-miR-149-3p, and hsa-miR-512-3p had targeting relationships with all 3 signature genes at the same time, which may be important miRNAs.
Discussion
In the past few decades, a massive number of researches have been made in exploring key genes in osteoporosis, especially for genes which involved in bone metabolism.6 -9 Many potentially important genes were identified by comparing high hip and low hip BMD samples in different cohorts but there still lack comprehensive analysis and detailed exploration about marker genes for this disease.
Here, we used LASSO regression algorithm analysis to detect 8 candidate key genes (SH3BP1, NARF, ANKRD34B, RNF40, ZNF473, AKT1, SHMT1, and VASH1) from DEGs in GSE62404. Based on these 8 feature genes, high AUC scores (0.899 and 0.921) were observed from sample risk diagnosis models in the other 2 datasets GSE56814 and GSE56815. These consistent results in independent studies proved the robustness of our identification method.
After searching interacted proteins using described method, we determined AKT1, SHMT1, ZNF473, RNF40, and VASH1 as the most robust marker genes from these 8 candidates. Some of these 5 candidate marker genes were well known as involved in bone mineral density, tumor related genes, metabolism and proliferation. For example, expression level and methylation status of ZNF473 was reported to be correlated with bone mineral density 25 and 8 ZNF473-related proteins were found to be enriched in spliceosome, mRNA surveillance pathway and RNA transport. AKT1 is 1 of 3 members of AKT kinase which regulates many processes including metabolism, cell survival, proliferation, angiogenesis and growth,26 -29 while 188 interacting proteins of AKT1 were also involved in many important signaling pathways such as PI3K-Akt signaling pathway, mTOR signaling pathway and Sphingolipid signaling. RNF40 which interact with the tumor suppressor protein RB1 30 is involved in protein-protein and protein-DNA interaction and its interacting proteins were related with Ubiquitin mediated proteolysis and Mitophagy-animal. Besides them, 12 of 21 proteins interacted with SHMT1 were related with Glycine, serine, and threonine metabolism. Considering that most of the selected 5 genes have been discovered to play important roles, we can hypothesis that these 5 genes might be important candidate markers for osteoporosis.
Following TF-target prediction combined with miRNA-target prediction detected several TFs and miRNAs in regulatory networks as potential regulatory candidates. Some of the predicted key TFs which regulate 5 key genes simultaneously have well known functions. Such as PRKAA1, a catalytic subunit of AMP-activated protein kinase (AMPK) which plays a key role in regulating cellular energy metabolism. 31 STAT1 is an important signal transducer and transcription activator which could mediates cellular responses to growth factors such as interferons (IFNs). 32 Besides TFs, several miRNAs were also predicted to target at least 3 of 5 key genes which might have important regulatory functions in our study.
Additionally, this study revealed the protein subcellular localization of all 8 candidate genes shown that most genes were located in cytoplasm or nucleus and only VASH1 was located in mitochondria. Although our study has shown encouraging results, more external verification and deeper exploration of mechanism are required due to our research was mainly based on bioinformatics methods.
Conclusion
In summary, our study had identified the optimal differential genes combination to predict female osteoporosis risk based on the LASSO regression algorithm and SVM method. These findings will provide a theoretical basis for the clinical diagnosis of osteoporosis.
Supplemental Material
sj-tif-1-evb-10.1177_11769343221075014 – Supplemental material for Screening of Important Markers in Peripheral Blood Mononuclear Cells to Predict Female Osteoporosis Risk Using LASSO Regression Algorithm and SVM Method
Supplemental material, sj-tif-1-evb-10.1177_11769343221075014 for Screening of Important Markers in Peripheral Blood Mononuclear Cells to Predict Female Osteoporosis Risk Using LASSO Regression Algorithm and SVM Method by Hongwei Tang, Qingtian Han and Yong Yin in Evolutionary Bioinformatics
Supplemental Material
sj-txt-4-evb-10.1177_11769343221075014 – Supplemental material for Screening of Important Markers in Peripheral Blood Mononuclear Cells to Predict Female Osteoporosis Risk Using LASSO Regression Algorithm and SVM Method
Supplemental material, sj-txt-4-evb-10.1177_11769343221075014 for Screening of Important Markers in Peripheral Blood Mononuclear Cells to Predict Female Osteoporosis Risk Using LASSO Regression Algorithm and SVM Method by Hongwei Tang, Qingtian Han and Yong Yin in Evolutionary Bioinformatics
Supplemental Material
sj-txt-5-evb-10.1177_11769343221075014 – Supplemental material for Screening of Important Markers in Peripheral Blood Mononuclear Cells to Predict Female Osteoporosis Risk Using LASSO Regression Algorithm and SVM Method
Supplemental material, sj-txt-5-evb-10.1177_11769343221075014 for Screening of Important Markers in Peripheral Blood Mononuclear Cells to Predict Female Osteoporosis Risk Using LASSO Regression Algorithm and SVM Method by Hongwei Tang, Qingtian Han and Yong Yin in Evolutionary Bioinformatics
Supplemental Material
sj-txt-6-evb-10.1177_11769343221075014 – Supplemental material for Screening of Important Markers in Peripheral Blood Mononuclear Cells to Predict Female Osteoporosis Risk Using LASSO Regression Algorithm and SVM Method
Supplemental material, sj-txt-6-evb-10.1177_11769343221075014 for Screening of Important Markers in Peripheral Blood Mononuclear Cells to Predict Female Osteoporosis Risk Using LASSO Regression Algorithm and SVM Method by Hongwei Tang, Qingtian Han and Yong Yin in Evolutionary Bioinformatics
Supplemental Material
sj-txt-7-evb-10.1177_11769343221075014 – Supplemental material for Screening of Important Markers in Peripheral Blood Mononuclear Cells to Predict Female Osteoporosis Risk Using LASSO Regression Algorithm and SVM Method
Supplemental material, sj-txt-7-evb-10.1177_11769343221075014 for Screening of Important Markers in Peripheral Blood Mononuclear Cells to Predict Female Osteoporosis Risk Using LASSO Regression Algorithm and SVM Method by Hongwei Tang, Qingtian Han and Yong Yin in Evolutionary Bioinformatics
Supplemental Material
sj-xlsx-2-evb-10.1177_11769343221075014 – Supplemental material for Screening of Important Markers in Peripheral Blood Mononuclear Cells to Predict Female Osteoporosis Risk Using LASSO Regression Algorithm and SVM Method
Supplemental material, sj-xlsx-2-evb-10.1177_11769343221075014 for Screening of Important Markers in Peripheral Blood Mononuclear Cells to Predict Female Osteoporosis Risk Using LASSO Regression Algorithm and SVM Method by Hongwei Tang, Qingtian Han and Yong Yin in Evolutionary Bioinformatics
Supplemental Material
sj-xlsx-3-evb-10.1177_11769343221075014 – Supplemental material for Screening of Important Markers in Peripheral Blood Mononuclear Cells to Predict Female Osteoporosis Risk Using LASSO Regression Algorithm and SVM Method
Supplemental material, sj-xlsx-3-evb-10.1177_11769343221075014 for Screening of Important Markers in Peripheral Blood Mononuclear Cells to Predict Female Osteoporosis Risk Using LASSO Regression Algorithm and SVM Method by Hongwei Tang, Qingtian Han and Yong Yin in Evolutionary Bioinformatics
Supplemental Material
sj-xlsx-8-evb-10.1177_11769343221075014 – Supplemental material for Screening of Important Markers in Peripheral Blood Mononuclear Cells to Predict Female Osteoporosis Risk Using LASSO Regression Algorithm and SVM Method
Supplemental material, sj-xlsx-8-evb-10.1177_11769343221075014 for Screening of Important Markers in Peripheral Blood Mononuclear Cells to Predict Female Osteoporosis Risk Using LASSO Regression Algorithm and SVM Method by Hongwei Tang, Qingtian Han and Yong Yin in Evolutionary Bioinformatics
Footnotes
Funding:
The author(s) received no financial support for the research, authorship, and/or publication of this article.
Declaration of Conflicting Interests:
The author(s) declared no potential conflicts of interest with respect to the research, authorship, and/or publication of this article.
Author Contributions
Conception and design of the research: YY; acquisition of data: YY; analysis and interpretation of data: YY; statistical analysis: YY; drafting the manuscript: HT; revision of manuscript for important intellectual content: HT, QH. All authors read and approved the final manuscript.
Supplemental Material
Supplemental material for this article is available online.
References
Supplementary Material
Please find the following supplemental material available below.
For Open Access articles published under a Creative Commons License, all supplemental material carries the same license as the article it is associated with.
For non-Open Access articles published, all supplemental material carries a non-exclusive license, and permission requests for re-use of supplemental material or any part of supplemental material shall be sent directly to the copyright owner as specified in the copyright notice associated with the article.