
Abstract
Huntington disease (HD) is a degenerative brain disease caused by the expansion of CAG (cytosine-adenine-guanine) repeats, which is inherited as a dominant trait and progressively worsens over time possessing threat. Although HD is monogenetic, the specific pathophysiology and biomarkers are yet unknown specifically, also, complex to diagnose at an early stage, and identification is restricted in accuracy and precision. This study combined bioinformatics analysis and network-based system biology approaches to discover the biomarker, pathways, and drug targets related to molecular mechanism of HD etiology. The gene expression profile data sets GSE64810 and GSE95343 were analyzed to predict the molecular markers in HD where 162 mutual differentially expressed genes (DEGs) were detected. Ten hub genes among them (DUSP1, NKX2-5, GLI1, KLF4, SCNN1B, NPHS1, SGK2, PITX2, S100A4, and MSX1) were identified from protein-protein interaction (PPI) network which were mostly expressed as down-regulated. Following that, transcription factors (TFs)-DEGs interactions (FOXC1, GATA2, etc), TF-microRNA (miRNA) interactions (hsa-miR-340, hsa-miR-34a, etc), protein-drug interactions, and disorders associated with DEGs were predicted. Furthermore, we used gene set enrichment analysis (GSEA) to emphasize relevant gene ontology terms (eg, TF activity, sequence-specific DNA binding) linked to DEGs in HD. Disease interactions revealed the diseases that are linked to HD, and the prospective small drug molecules like cytarabine and arsenite was predicted against HD. This study reveals molecular biomarkers at the RNA and protein levels that may be beneficial to improve the understanding of molecular mechanisms, early diagnosis, as well as prospective pharmacologic targets for designing beneficial HD treatment.
Introduction
Huntington disease (HD) can be defined as a completely penetrant degenerative brain disease resulting from CAG (cytosine-adenine-guanine) repeat expansion that is inherited as a dominant trait in IT15 (“interesting transcript 15”) gene also defined as huntingtin (HTT) gene.1,2 Huntingtin is translated into such an excessively massive polyglutamine domain around the N-terminus of the Huntington protein. 3 Mutant huntingtin (mHTT) becomes particularly unstable due to the enlargement of the CAG region and allows to a combination of proteins of the same type and/or other types resulting in clumps that may lead to discontinued neurotransmission.4,5
Huntington disease is caused by a complicated interaction of environmental and genetic factors, resulting in succeeding generations to live in increasingly deplorable social conditions. Autosomal recessive inheritance is often seen in mid-life diagnosis and continuous progressive motor including intellectual and mental symptoms across 15 to 20 years.6,7 It commonly starts in middle age, between the 21 and 50 years, including an average starting age of 41 years.6,8 Fine motor function deterioration, cerebellar abnormalities, gait abnormalities, dysarthria, cognitive difficulties, and stiffness are all prevalent symptoms and indicators. 9 It produces substantial physical and cognitive deficiencies such as memory loss, depression, mood fluctuations clumsiness as well as some other psychological problems and disorders.4,10 Clinical diagnosis to identify HD is conducted when there are strong sets of evidence of a motor disorder, particularly chorea involving iatrogenic conditions and general internal disorders. 9 Degenerative mutations and cellular damage can be found throughout the cortex and external areas of the central nervous system, specifically across the striatum; there are various symptomatic therapies and medication available, but there is no permanent remedy for this devastating brain disorder presently.10,11 There are currently no medications available to delay symptoms and disease development; however, there are numerous effective post management (ie, medication and nonpharmacologic approaches available). 12
As the disease was first diagnosed, especially after Davenport and Munceyat 1916 pointed out a large collection of information on households in the New England area of America, individual family surveys on HD have been conducted. 13 Most European nations, including Northern and Southern, have a quite high prevalence, ie, 4 to 8 in every 100 000 individuals, and the disease may also be common in India side by side in some areas of Central Asia, according to the findings. 14 The prevalence of HD worldwide appears to vary by region. 15 In South Africa and Zimbabwe, prevalence rates were determined to be extremely low. 16 Since 1995, the prevalence rate (average) in Asian countries (South Korea, Hong Kong, Taiwan, and Japan) has been low (0.42 per 100 000 individuals) compared with the rate among white populations (North America, Australia, the United Kingdom and Western Europe) where the rate was 9.71 per 100 000 individuals. 15 Following the emergence of genetic testing, the frequency of HD has increased in several populations. 17
Although several studies have already identified histone modifications, protein hubs identification, transcription factor (TF) impairments, and abnormal microRNA (miRNA) expression, HD is difficult to diagnose at an early stage and identification is restricted in accuracy and precision, as well as expensive.18,19 Also, contradictions between researchers were found about the conclusion of differential expressed genes. As a result, using brain cell analysis to predict HD could enhance disease’s early detection and treatment. In 1993, the faulty gene that triggers HD was first discovered and a genetic test for diagnosis is available now. 20 The test can identify the malfunctioning gene for HTT protein as well as discover the genetic defect in individuals who already haven’t shown any symptoms but has the possibility to obtain the disease but this is a slow process and can only be diagnosed after mid-age.20,21 This condition is caused by a CAG triplet repeat amplification in the HTT gene.20,22 Due to prolonged CAG repeat, HTT protein with an enlarged polyglutamine tract is produced, resulting in pathogenic HTT protein residues that are immune to the protein cycle, leading to cellular toxicity.23,24 Most HD patients have motor-involved problems, a small percentage (15%) establish clinically relevant psychological disease first and hence have a mental diagnosis before the start of movement disorder.20,25 Huntington disease is associated with extremely selective deterioration of the corpus striatum which is a brain region with no noticeable abnormalities in peripheral tissues. Huntington and mHTT are prevalently distributed across the brain also including peripheral tissues. 10
Histone modifications, protein hubs identification, TF impairments, and abnormal miRNA expression are among the processes linked to this imbalance and identification of disease specification biomarkers is crucial for HD drug testing. 26 Several studies have been conducted from different perspectives to identify molecular biomarkers with various brain and blood data. As HD is a completely penetrant degenerative brain disease, in this study brain-based data sets were obtained to progress further analyses. Generally, genetic factors in HD have primarily been examined in diseased brains comparing controlled individuals, as well as in cell and animal models.23,27 Hundreds of research teams have spent the past 3 decades trying to figure out what causes HD based on cellular and molecular compounds.18,19,27 The goal of this research is to find molecular biomarkers that represent the brain expression alignments of associative factors connected to HD development. The main objective of this study is to identify the differentially expressed genes (DEGs) and common genes using genomic information for HD. Second, we aimed to identify molecular biomarkers to diagnose early detection of HD and progression by identifying transcriptional and post-transcriptional level; side by side another objective was to identify potential interacting components that are prominent in the gene list which can be used to find valuable medicines or drug targets. The rest of this article is organized as materials and methodology, results, discussion, and conclusions section. The materials and methodology section contains data acquisition, determination of DEGs and common genes, gene set enrichment analysis (GSEA), construction of protein-protein interaction (PPI) network for hub protein identification, transcriptomic marker identification, prediction of small drug molecules, and finally, validation of the predicted molecular markers.
Materials and Methodology
Data acquisition
In this study, data sets were obtained from National Center for Biotechnology Information (NCBI) Gene Expression Omnibus (GEO). 28 We searched for Homo sapiens data of HD and detected 747 data sets, the majority of which were initially disqualified as they were noncoding data sets, had a very small sample size, were redundant data sets, had an inadequate format, or inappropriate experimental set-up, contained stem-cells, did not contain control subjects, or was from organisms other than humans. Finally, after considering all perspectives, we have selected 2 data sets for the analysis which are GSE64810 and GSE95343, where GSE64810 contained mRNA sequence expression of brain tissue and GSE95343 contained mRNA sequence of neural cells.
Determination of differentially expressed genes and common genes
Gene set enrichment analysis identifies DEGs from a large set of genes linked to disease symptoms using a number of statistical approaches.29,30 Figure 1 visualizes the steps involved in data acquisition and identifying DEGs also shows the analytical approaches in a nutshell. GSE64810 and GSE95343 shared a total of 162 common genes, whereas 106 genes were up-regulated and 56 genes were down-regulated. Gene expressions of the data sets were analyzed in accordance with

The random variable indicates the fraction of errors made by the null hypotheses that are falsely rejected and


where
Finally, it can be seen that

Common genes were obtained from the DEGs using the Venn diagram comparing the common DEGs.

Systematical implementation approach in the study: significant differentially expressed genes were identified as well as associated gene ontology terminologies and pathways were enriched using mRNA expression data sets of Huntington disease from neural cells and brain tissue. Multiple network approaches were also implemented to identify PPI, regulatory signature molecules, and potential therapeutic drug targets. DEGs indicate differentially expressed genes; KEGG, Kyoto Encyclopedia of Genes and Genomes; PPI, protein-protein interaction; TF, transcription factor.
Gene set enrichment analysis
Gene set enrichment analysis was conducted to depart analytical obstructions and examine data if individuals from a set of genes tend to appear near the highest points (or bottom) of the list and also checks where the gene set is linked to behavioral class distinction.34,35 To obtain GSEA, gene ontologies (molecular function, biological process as well as cellular components), molecular pathways (Kyoto Encyclopedia of Genes and Genomes [KEGG] pathway) and was obtained using Enricher, GREIN, David Bioinformatics Resources 6.8 and R programing, respectively.36,37 A considerable analytical effort is required to identify common biological findings using GSEA. An adjusted P
Determination of protein-protein interaction
Protein-protein interaction (PPI) is the protein interactions with other proteins, ions, and nonprotein elements like lipids, carbohydrates, and nucleic acids generate the distinctive features of each protein.
38
Protein-protein interaction plays an important role in several biological functions and includes a variety of applications in biology regarding structure, affinities, and whether or not the interaction is persistent.
39
Interaction of protein hubs through PPI networks was retrieved using Network Analyst
40
from the STRING database depending on the physical connection of common gene proteins selecting confidence score 900 (adjusted
Analysis of transcription factor gene and transcription factor-microRNA coregulatory interconnections
Transcription factors interact directly with DNA to bind the regulatory regions known as regulators and enhancers, which increase (or occasionally prevent) gene transcription and consequently messenger RNA synthesis.42,43 Network Analyst was used to determine regulatory TFs-DEGs interaction network and also to identify TFs and miRNAs that control common genes at the transcriptional and post-transcriptional stages. The TF-genes and TF-miRNA were obtained from the JASPAR TF binding site profile database and TarBase v8.0, respectively. Here, JASPAR is a popular manually organized, nonredundant open-accessed TF binding profiling database recorded as matrices and models of TF. 44 TarBase is a comprehensive database of miRNA-gene interactions that had been confirmed empirically. 45
Gene disease association
Genetic and/or environmental factors are thought to play a role in complex disorders. 46 Recognizing the genes linked to an illness can help with disease treatment, prevention, and health care. 47 It is also crucial for knowing how genes work biologically. It emphasizes the evolution of human genetic illnesses which are used to uncover linkages between hereditary and genetic disease while using Network Analyst to investigate related diseases and common DEGs. The DisGeNET database, which is exclusively suitable for human data sets, was used to gather the gene-disease association information. DisGeNET is a research platform that includes one of the most comprehensive publicly available libraries of genes and variations linked to human disorders. 48
Prediction of candidate drugs or small compounds
Enrichment of drug-target was executed using Enrichr to obtain candidate drugs or small compounds. This method was used to find small chemical that influenced HD function. The gene sets (DSigDB) database from the Enrichr was employed to identify prospective drugs or small molecules. The Drug Signatures Database (DSigDB) is a gene set database that connects drugs/compounds with respective target genes. 49 Chemical structures of the candidate drugs were extracted from PubChem. 50
Validation of relevant biomarkers
To check the validation of relevant biomarkers revealed in this research, we conducted an overall review from literatures with respect to the findings of our study.51,52
Results
Determination of differentially expressed genes and overlapping genes
High-throughput sequencing data (GSE64810, GSE95343) of prefrontal cortex and neural cells of HD were analyzed using GEO2R and GREIN. GSE64810 data were obtained by expression analysis of human post-mortem brain tissue (BA9) for HD patients and neurologically normal people using mRNA-Seq. GSE95343 data set consists of neural cells for HD and control patient using mRNA-Seq. The transcriptomic HD data sets exhibited 162 common DEGs including up-regulated and down-regulated genes from overlapped DEGs (Table 1 and Figure 2). Figure 2A and B depicts interactive heatmaps for control and case samples from the selected data sets.
Statistical overview for gene expression in data sets used in analysis.

Abbreviations: DEGs, differentially expressed genes; GEO, Gene Expression Omnibus.
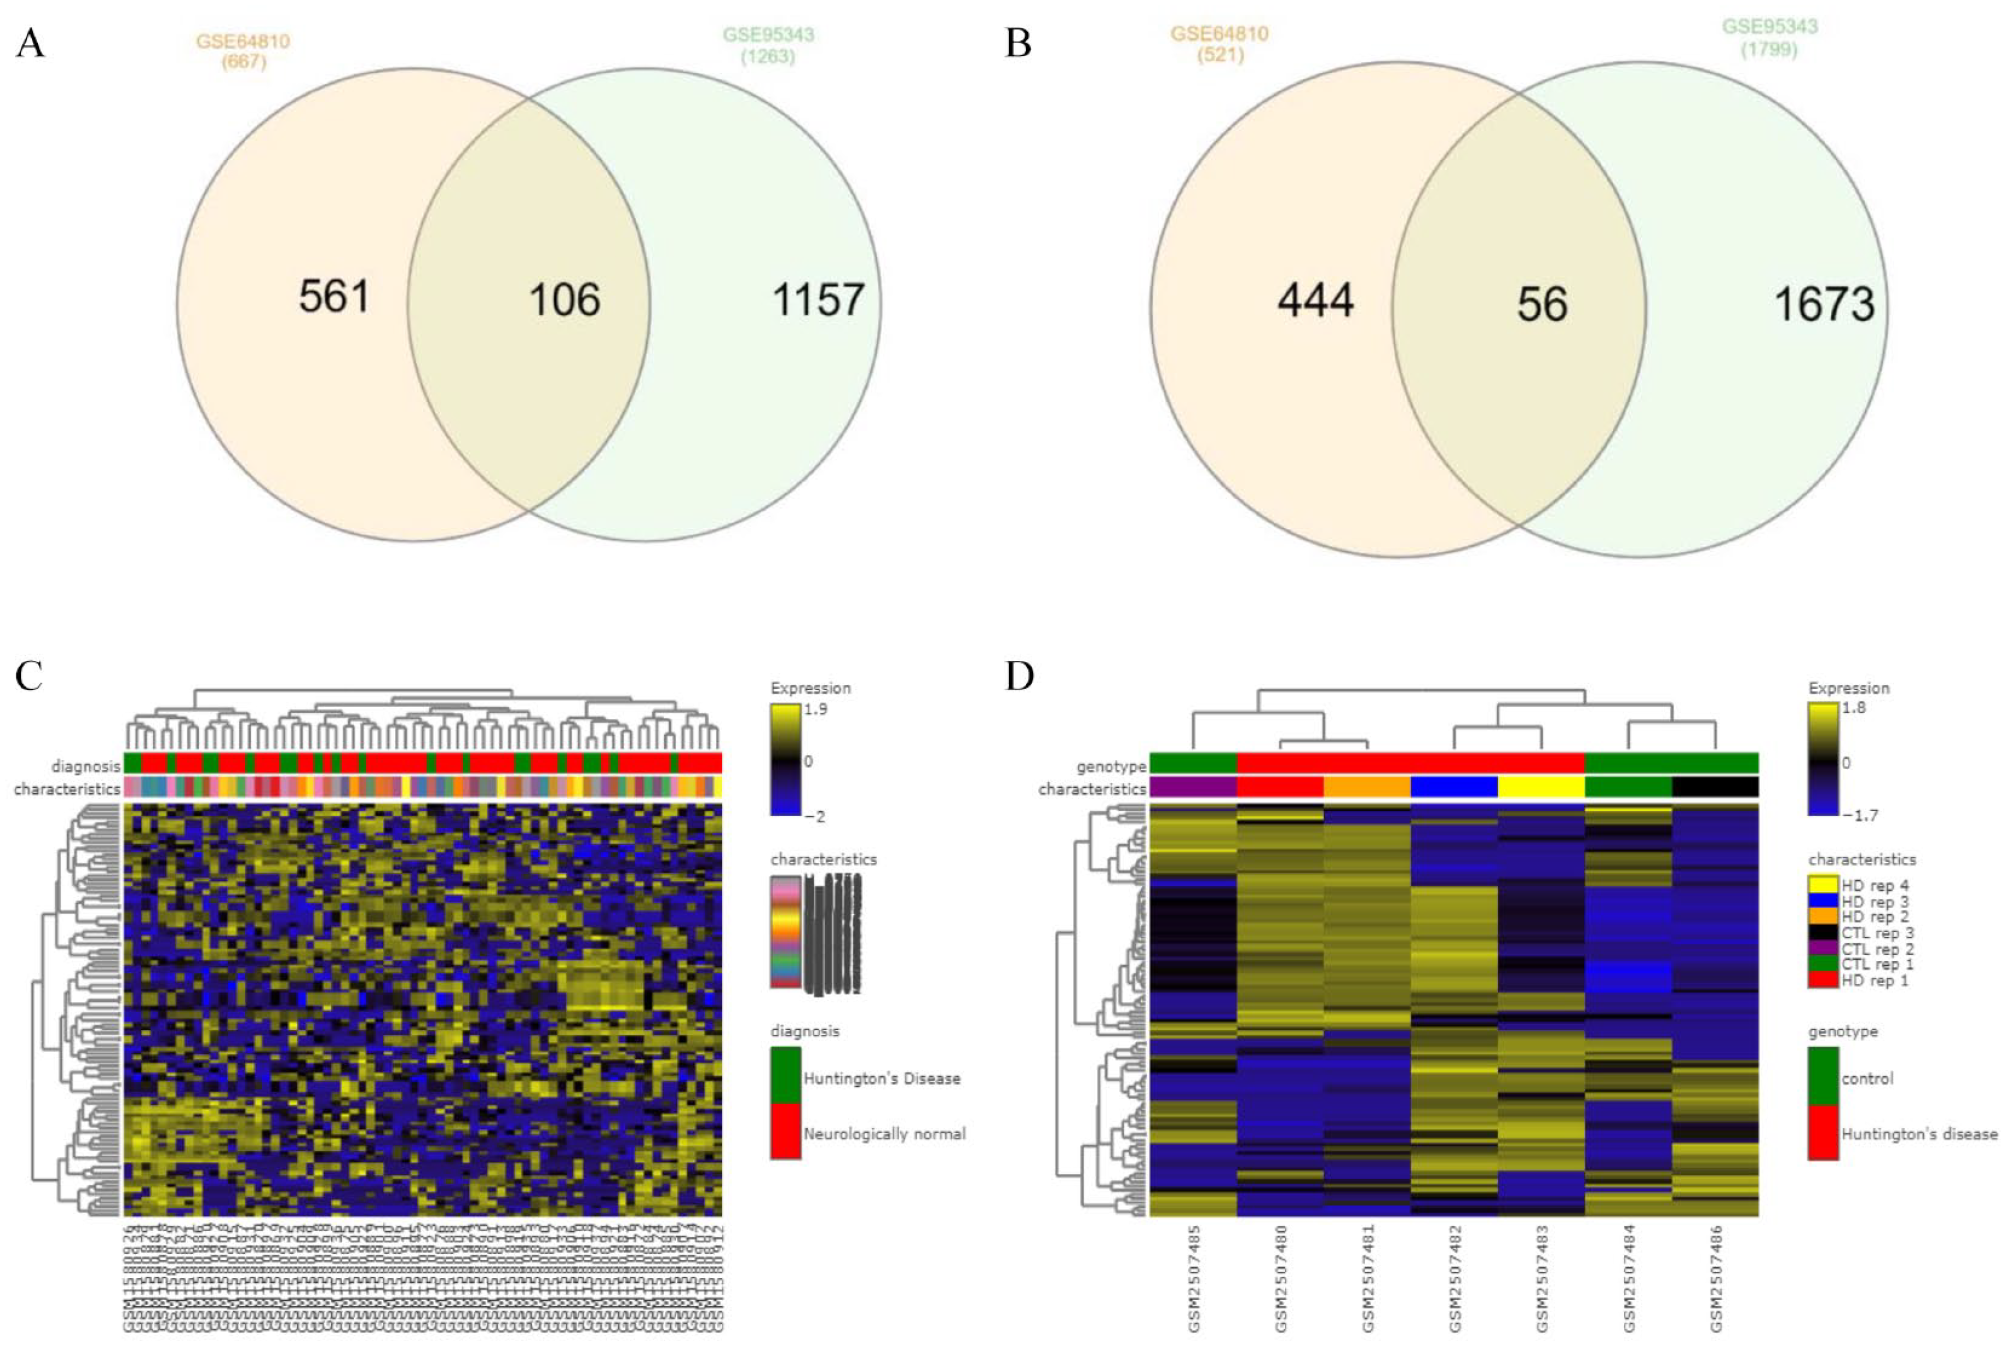
(A) Overlapping 106 up-regulated common genes among data sets GSE64810 and GSE95343; (B) Overlapping 56 down-regulated common genes among data set GSE64810 and GSE95343; (C and D) heatmap of selected data sets, GSE64810 and GSE95343 displaying differential expression level; the color scale reflects the expression value, and each row and column represents a gene. DEGs indicates differentially expressed genes.
Gene set enrichment analysis
Significant Gene Ontology (GO) was enriched through molecular function, biological process as well as cellular components (Table 2). Significant GO terms were displayed in Table 2 and Figure 3C to E, which was obtained using David Bioinformatics Resources 6.8. In Biological process, 13 genes were involved in proteolysis and 8 genes were found to be engaged in transcription from skeletal system development. The cellular component visualized 46 genes that came from extracellular region, whereas extracellular space (40 genes) and extracellular exosome (32 genes) also involved majority numbers of genes. Molecular function of the GO expressed 18 genes (EOMES, OSR2, PRRX2, etc) which were involved in sequence-specific double-stranded DNA binding. Figure 3A illustrates the DEG-enriched molecular pathways that have been found in KEGG Pathway with help of Enrichr and Figure 3B represents the bubble plot following KEGG Pathway produced by R programing. In the KEGG pathway, antigen processing and presentation pathway was seen to be enriched with 6 genes significantly, according to significant P value. Top significantly enriched pathways were represented by bubble plots in this study.
Functional enrichment approach of DEGs to find Gene Ontology entries for the HD based on top significant terms.
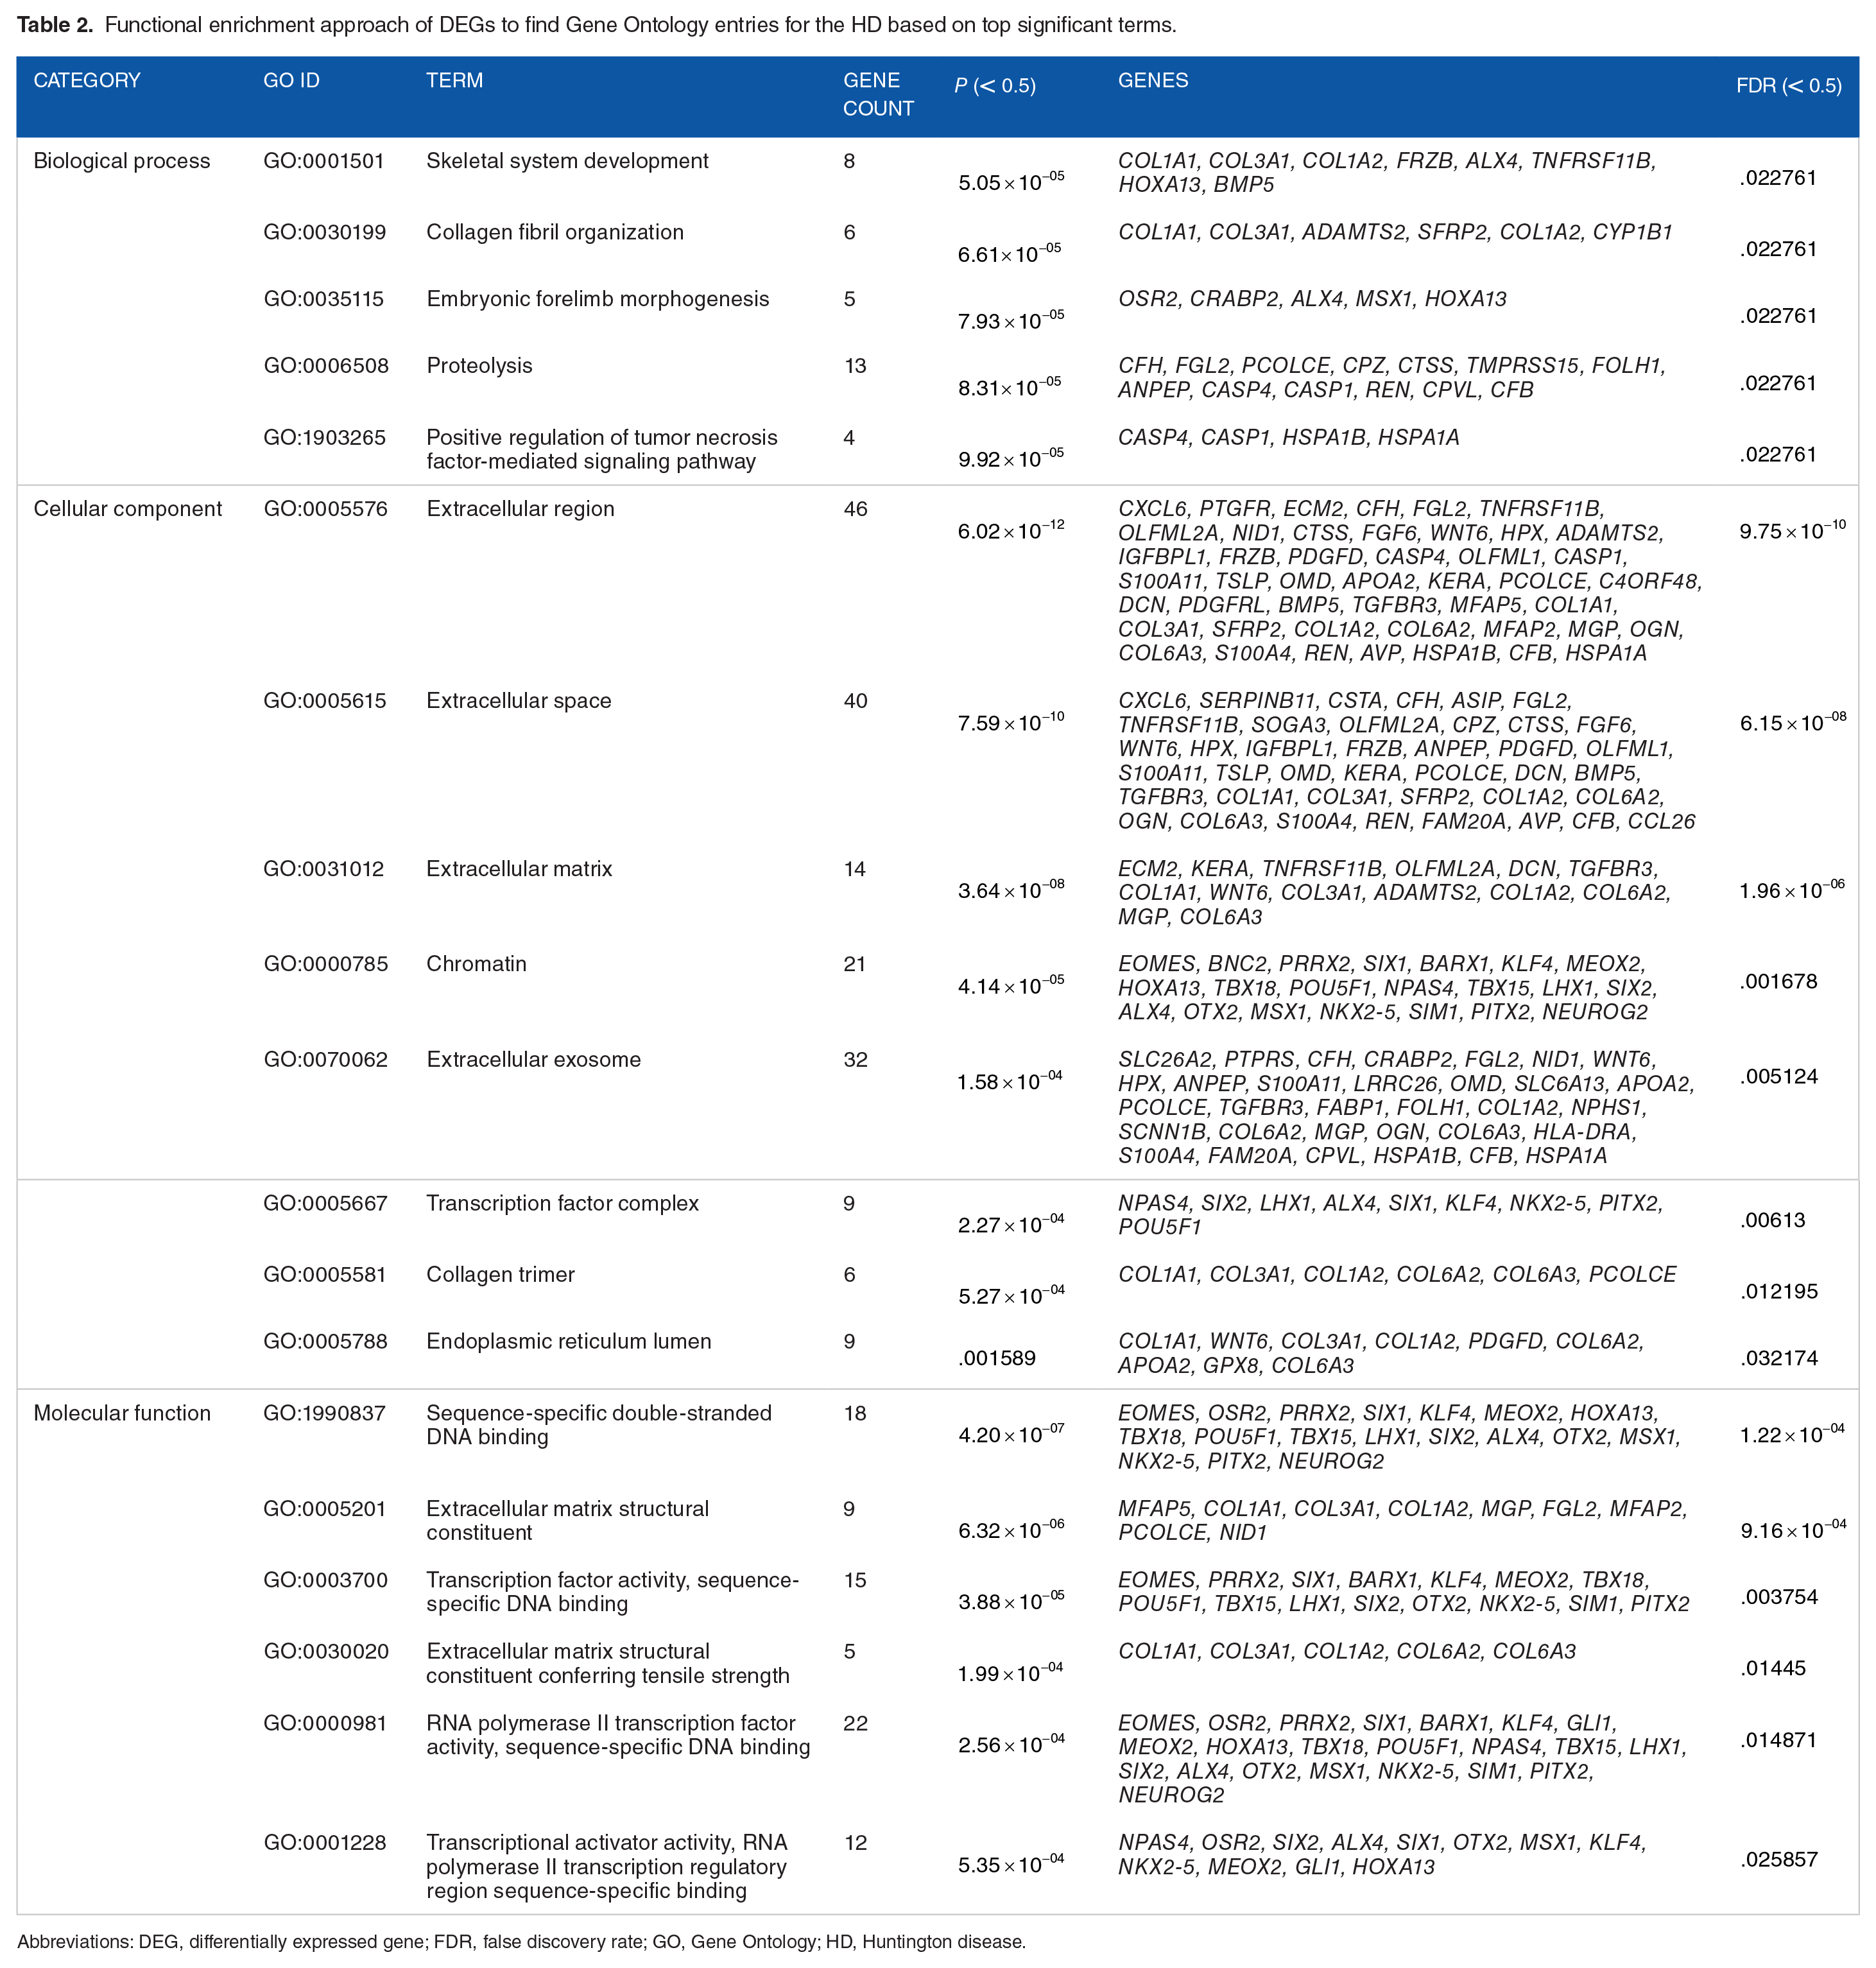
Abbreviations: DEG, differentially expressed gene; FDR, false discovery rate; GO, Gene Ontology; HD, Huntington disease.

(A) KEGG Pathway enriched with the relevant DEGs, P < .05: Network Analyst and the Enrichr web-based server identified KEGG pathways (P < .05) linked with substantial DEGs. (B) DEG-related pathways in KEGG pathway analysis: the color of the bubble figure denotes log10 P values, whereas the size of the bubbles reflects gene counts. Furthermore, the horizontal axis reflects log10 FDR. (C to E) The bar diagrams illustrate significant GO terms (P < .05) related with genes regarding biological process, cellular component, and molecular function categories, correspondingly. The vertical axis displays enhanced GO terms with respect to (P < .05) and horizontal axis displays −log10 (P values). DEGs indicates differentially expressed genes; ECM, extracellular matrix; FDR, false discovery rate; GO, Gene Ontology; IgA, immunoglobulin A; KEGG, Kyoto Encyclopedia of Genes and Genomes.
Protein-protein interaction
Figure 4 visualizes the PPI obtained by network analysis highlighting the protein hubs with the list of top 10 hub genes produced by Cytoscape, and it shows the interactions between the hub genes generated by Network Analyst and Cytoscape. Protein-protein interaction network of the proteins was analyzed to identify the protein hubs of respective DEGs including 162 common genes. Network analysis determined the hub proteins, and they were DUSP1, NKX2-5, GLI1, KLF4, SCNN1B, NPHS1, SGK2, PITX2, S100A4, and MSX1. These hub genes could be the indicators that play a key role in the progression of HD.

Visualization of PPI network of common DEG: (A) PPI network developed by Network Analyst showing the top 10 hub genes that interconnect other DEGs marked by blue nodes and other nodes symbolize DEGs connected by edges which reflect DEG interaction. (B) List of top 10 hub genes produced by Cytoscape through MCC method. Here, color shades represent the rank of hub proteins. The darker shades of color express the higher rank of hub genes and vice versa. (C) According to the selected layout, the top 10 hub proteins in a network are visualized using the MCC technique in Cytoscape v3.8.2 using the cytoHubba plugin. Pink-colored nodes represent the proteins associated via edges with the top 10 hub proteins in blue shade. DEG indicates differentially expressed gene; MCC, maximum clique centrality; PPI, protein-protein interaction.
Transcription factor gene and transcription factor-microRNA coregulatory interconnections
To get insights into substantial changes happening at the transcriptional and post-transcriptional level, the DEGs were screened to pick out the transcriptional (TFs) and post-transcriptional (miRNAs) regulatory biomolecules which were identified based on degree value. We predicted regulatory biomolecules that may influence DEGs at the transcription regulatory and post-transcriptional stages by identifying TFs and miRNAs targeting DEGs. Figure 5A and B exhibits the analysis of TF-gene and TF-miRNA coregulatory interconnections with network. The analysis disclosed top significant transcriptomic factors (TFs), ie, FOXC1, GATA2, YY1, TFAP2A, FOXL1, PPARG, HINFP, STAT3, MEF2A and top significant miRNAs, ie, hsa-miR-340, hsa-miR-34a, hsa-miR-495, hsa-miR-1, hsa-miR-124, hsa-miR-29a, hsa-miR-29b, hsa-miR-30e, hsa-miR-16, hsa-miR-206, hsa-miR-30a, hsa-miR-30c, and hsa-miR-944 as regulatory biomarkers for HD.

TF-gene and TF-miRNA coregulatory interconnections. (A) Identification of transcriptomic regulatory signatures by network analysis of DEGs using the Network Analyst server: the network highlights the top 9 TFs that are linked to DEGs. Blue nodes represent the TFs, other nodes represent the DEGs, and edges represent the interaction levels. (B) Network-based analysis of transcriptomic regulatory signatures by network analysis of DEGs using the Network Analyst server: the network displays the top 12 miRNAs interconnected with DEGs, with blue nodes representing miRNAs and other nodes representing DEGs linked through edges. DEGs indicates differentially expressed genes; TF, transcription factor.
Gene disease association
Figure 6 indicates the main diseases linked to common DEGs are highlighted in the gene-disease association network. Degenerative polyarthritis, schizophrenia, short stature, autosomal recessive predisposition, and liver cirrhosis (Experimental) were identified as the correlated diseases to the DEGs from gene-disease association study using Network Analyst.

The main diseases linked to common differentially expressed genes are highlighted in the gene-disease association network (green: seeds and blue: diseases).
Development of candidate drugs or small compounds
Table 3 lists the top associated small molecules, along with respective molecular formula and structural composition, and Figure 7 shows a bar graph of the small drug molecules produced by Enrichr. Cytarabine exhibited the strongest negative association and the best chance of reversing HD among these compounds. Arsenite has also shown effectiveness against HD.
List of probable Huntington disease medications, along with respective chemical formula and structural composition.


Bar graph including top 10 related small molecules with high significant correlations according to P values.
Validation of relevant biomarkers
The hub genes we identified were DUSP1, NKX2-5, GLI1, KLF4, SCNN1B, NPHS1, SGK2, PITX2, S100A4, and MSX1 reflecting as the potential biomarkers for HD. To determine the validity of these putative biomarkers, we looked through the related studies for prospective HD biomarkers (Figure 8). It was identified that low DUSP1 also known as MKP-1 expression may contribute to hyperactivation of MAPK in HD, whereas increased MKP activity may be neuroprotective.53-55 NKX2-5 was found to be correlated with the protein synthesis in HD 56 and also as one of the significantly up-regulated genes. 57 GLI1 was also found as contributing gene of HD, and we found that it was one of the hub proteins that contribute to HD.58-63 Previous studies suggested KLF4 as a potential biomarker for HD which is consistent with our study.64-68 SCNN1B’s utility as a molecular biomarker in HD was demonstrated in 2 earlier studies.69,70 Increased expression of NPHS1 has consistently been identified to HD, which supports our research results. 71 In our research, it was revealed that SGK2 is a possible protein hub in HD, and it has been seen to be widely expressed in a study published in 2011. 72 Over-expressed PITX2 have effects on the initial formation of striatal neurons composing the pathways directly and indirectly, according to few studies. In our study, PITX2 was recognized as a hub protein.73,74 S100A4 has been shown in 2 previous studies to be a useful biomarker and to be abundantly expressed in HD.75,76 We found MSX1 to be a potential hub protein which is relevant to some studies.77,78

Graphical representation of the validation of relevant biomarkers.
Discussion
Huntington disease is a hereditary neurodegenerative condition which impacts in early forties and fifties.24,79 Dysregulation of possible biomarkers has recently been found to be linked with neurological and neurodegenerative diseases,80,81 and several studies have looked into the implications of biomolecular activities in patients with HD. 27 ,82-85 Omics-based approaches are currently being used more often in biomedicine and systemic biology studies, and they have proven to be a helpful resource for deciphering disease pathogenesis, discovering molecular pathways, and determining biomarkers for various diseases. 31 Gene expression is perhaps modulated at multiple stages of RNA processing, post-translational modification (PTM) of proteins, translation, or other genomic changes, according to previous researches.86,87 Determining the biochemical pathway of an exact disease and identifying the impact of fundamental mechanisms involved in a certain phenotype require defining the activity target proteins in bioactive molecules.31,88 The functional characteristics of hub proteins are of special intrigue, and PPI can be characterized as persistent or transient, depending on how long they last and what they do. 89 The networks based on PPI are considered scale-free where the connectivity between components follows generally a Poisson distribution. 90 Adapting a network-based technique to genomic data aids in the discovery of connections between diverse biological activities and processes, resulting in new pathways, interaction networks, as well as other disease-related signals that result in identifying biomarkers and treatment targets. 91 Although several studies identified miRNA expression of cellular and mouse structure,85,92 common gene expression of HD patient, 82 and DNA methylation in HD, 27 a bioinformatics study regarding the identification of molecular signatures and pathways of healthy controls and HD patients has yet not been conducted comprehensively in a framework comparing all these methods at same time. We used a comprehensive bioinformatics strategy to identify molecular signatures and key pathways for HD in this study and emphasized an overall overview.
The key word ‘Huntington’s Disease’ was used to explore the GEO database, and data sets featuring Homo sapiens mRNA and array expression profiles were sorted containing control and diseased groups after reviewing some literatures. 28 A bioinformatics approach was used to assess DEGs between the control and diseased groups where the HD patients revealed significant variations in gene expression compared with neurologically healthy controls. The selected databases (GSE64810 and GSE95343) showed total 162 common genes among them 106 genes were found up-regulated and 56 genes were found down-regulated by systematic and statistical approaches. The data set GSE95343 has not been studied yet in the view of comprehensive bioinformatics, and it was found that GSE64810 was studied separately in a study where 1612 DEGs had been determined. 83
The GO analysis was used to evaluate the biological relevance of HD regarding 162 common DEGs found. These important genes are identified to generate proteins with various molecular functions linked with important biological processes such as skeletal system development, collagen fibril organization, embryonic forelimb morphogenesis, proteolysis, and positive regulation of tumor necrosis factor–mediated signaling pathway matrix as well. However, GO term signal transduction in Biological Process83,84 and plasma membrane in Cellular Component 93 were found in some other related researches. In our study, TF activity and sequence-specific DNA binding was found in molecular function enriched by gene ontologies, whereas TF activity in molecular function 3 was found to be relevant to HD in a study. Combining earlier study findings, the current analysis may give new treatment targets or probable pathogenesis to be investigated further.
In our study, the hub genes we identified were DUSP1, NKX2-5, GLI1, KLF4, SCNN1B, NPHS1, SGK2, PITX2, S100A4, and MSX1 reflecting as the potential biomarkers for HD. These hub proteins are thought to be important particle in the disease-causing pathways. 94 As a result, we recreated the protein interaction network with a focus on DEGs to find relevant hub proteins. These proteins could play a role in the development and progression of HD. In HD, sodium butyrate has previously been shown to be neuroprotective, and this is correlated with an increased affirmation of mitogen-activated protein kinase phosphatase 1 (DUSP1/MKP1). 53 In some diseases, such as HD, low DUSP1 (also known as MKP-1) expression may contribute to MAPK hyperactivation, whereas increased MKP activity may be neuroprotective.53-55 GLI1 has also been identified as a contributing hub protein gene in HD, which has been linked to a number of other studies.58-63
In a study, NKX2-5 was discovered to be associated with protein synthesis in HD along with AGG and GATA-4.
56
NKX2-5 was also found as one of the significantly
Decreased AKT signaling has been linked to the pathophysiology of HD in a previous study, and the SGK family has gained a lot of interest because of its high similarity to AKT. 72 A study identified that in mammalian genomes, 3 genes encode the SGK family (SGK1, SGK2, and SGK3). 72 In our research, we discovered that SGK2 is a possible protein hub in HD which is relevant to this previous study. Loss of PITX2 in HD does not affect the initial formation of striatal neurons composing the pathways directly and indirectly, according to recent studies although over-expressed PITX2 affects neurons.73,74 In mice models of HD, S100A4 genes were found to be considerably up-regulated within early-symptomatic R6/2 as well as pre-symptomatic HdhQ150 hearts, according to a study, 76 and it was also identified as up-regulated in another research. 75
Directory biomolecules are being explored more and more as potential biomarkers for serious illnesses like neurodegenerative disorders.26,31,95,96 Keeping this in consideration, we investigated the involvement of TFs and miRNAs in DEG regulation via TF-miRNA coregulatory networks. MicroRNAs have a crucial role in the regulation of gene expression, and there is growing evidence that they could be used as biomarkers for HD and other disorders.83,92 Many miRNAs are expected to have a role in the pathogenic problem that introduces HD.2,94 Our study disclosed top significant transcriptomic factors (TFs), ie, FOXC1, GATA2, PRRX2, YY1, TFAP2A, FOXL1, PPARG, HINFP, STAT3, MEF2A, and NFKB1 and top significant miRNAs, ie, hsa-miR-340, hsa-miR-34a, hsa-miR-495, hsa-miR-1, hsa-miR-124, hsa-miR-29a, hsa-miR-29b, hsa-miR-30e, hsa-miR-16, hsa-miR-206, hsa-miR-30a, hsa-miR-30c, and hsa-miR-944 as regulatory biomarkers for HD. FOXC1, GATA2, YY1, FOXL1, and PPARG, which were revealed to be engaged as regulatory TFs in another neurodegenerative disease (Alzheimer disease, Parkinson disease, and some other neurodegenerative diseases also), were among the TFs we detected.81,95,96 In a study, researchers discovered an increase in the concentration of TFAP2A nucleoid signals from various micropattern colonies in HD. 97 Some relevant studies showed similar result as our findings resulting the TFs PPARG, STAT3, MEF2A, and NFKB1 be found in HD side by side other TFs. 22 ,98-100
It has been found that hsa-miR-340, hsa-miR-34a, hsa-miR-495, hsa-miR-30e, hsa-miR-206, and hsa-miR-30a have contribution to as a down-regulated miRNA; 96 ,101-104 on the contrary, hsa-miR-1 was found to have potentiality in Schizophrenia. 105 Huntington disease, Alzheimer disease, Hypoxic Ischemic Encephalopathy, Parkinson disease, and ischemic stroke have all been identified to have aberrant miR-124 expression.106,107 Our findings revealed that decreased expression of miR-29a and hsa-miR-29b is a prevalent occurrence in many neurodegenerative disorders, including HD 85 and Alzheimer disease 108 and hsa-miR-16 is also a potential miRNA for HD. 109 Differentially expressed genes were then investigated further to understand more about the prospective interactions using minor candidate drugs that could cure HD.
Finally, we predicted drugs/compounds to produce drug repositioning hypothesis in HD based on the probability that revealed biomarkers (ie, hub proteins and TFs) could be potential therapeutic targets. 110 - 112 As a result, connections between identified HD biomarkers and medicines have been established, suggesting that they may impact critical pathways in disease development 113 ; nevertheless, more research is needed to assess the ramifications of proposed biomarker blocking.
Conclusions
The successful implementation of disease-modifying therapies in HD progression will require the detection of potential biomarkers and their pathways. This research provided a summary of network-based approaches for identifying biochemical mechanisms underlying HD progression. From 2 transcriptomic data sets of HD, 162 DEGs were identified using a comprehensive bioinformatics analysis to build a PPI network, and the top most significant hub genes from the PPI network were identified as potential novel biomarkers in HD diagnosis. Following that, several TFs, ie, FOXC1, GATA2, PRRX2, etc and miRNAs such as, hsa-miR-340, hsa-miR-34a, hsa-miR-495, hsa-miR-1, etc were identified from the common genes linked to HD. However, more research is needed to confirm the anticipated drugs. We anticipate that all these biomarkers will allow quicker and more affordable detection of brain samples for the identification of HD. This method of identifying biomarkers can be used in obtainable tissue from brain to assess their presence and activity in inaccessible tissue, and it could be used to solve other therapeutic difficulties. We therefore suggest a more thorough validation of this framework and the possible biomarker transcripts we detected through clinical studies.
Footnotes
Funding:
The author(s) received no financial support for the research, authorship, and/or publication of this article.
Declaration of Conflicting Interests :
The author(s) declared no potential conflicts of interest with respect to the research, authorship, and/or publication of this article.
Author contributions
MHR and MAA conceived and designed the study; TMM, UK and MSK performed the computational analyses; TMM and UK wrote the draft manuscript; UK and MBRM helped in the preparation of the tables and figures; MAA, MSK and MHR were involved in preparing the important intellectual content and critical revision; MAA, MHR and MSK supervised the whole study. All authors approved the final version for submission.
Ethics approval and consent to participate
Not applicable.
Consent for publication
All authors gave their consent for publication.
Availability of data and materials
Not applicable.