
Abstract
Prion disorder (PD) is caused by misfolding and the formation of clumps of proteins in the brain, notably Prion proteins resulting in a steady decrease in brain function. Early detection of PD is difficult due to its unpredictable nature, and diagnosis is limited regarding specificity and sensitivity. Considering the uncertainties, the current study used network-based integrative system biology approaches to reveal promising molecular biomarkers and therapeutic targets for PD. In this study, brain transcriptomics gene expression microarray datasets (GSE160208 and GSE124571) of human PD were evaluated and 35 differentially expressed genes (DEGs) were identified. By employing network-based protein–protein interaction (PPI) analysis on these DEGs, 10 central hub proteins, including SPP1, FKBP5, HPRT1, CDKN1A, BAG3, HSPB1, SYK, TNFRSF1A, PTPN6, and CD44, were identified. Employing bioinformatics approaches, a variety of transcription factors (EGR1, SSRP1, POLR2A, TARDP, and NR2F1) and miRNAs (hsa-mir-8485, hsa-mir-148b-3p, hsa-mir-4295, hsa-mir-26b-5p, and hsa-mir-16-5p) were predicted. EGR1 was found as the most imperative transcription factor (TF), and hsa-mir-16-5p and hsa-mir-148b-3p were found as the most crucial miRNAs targeted in PD. Finally, resveratrol and hypochlorous acid were predicted as possible therapeutic drugs for PD. This study could be helpful in better understanding of molecular systems and prospective pharmacological targets for developing effective PD treatments.
Introduction
Prion disorder (PD) is a neurodegenerative disease attributable to structural changes in the cellular Prion protein that results in the generation of a pathogenic isoform.1-3 Extensive and gradual brain deterioration causes this disease condition. PD affects people all over the world annually, along with a prevalence of 1 PD case per million populations.4,5 Roughly 350 cases of PD are reported in the United States every year, 6 and the number of instances of PD is gradually increasing.
The specific molecular mechanisms of the development and advancement of this neurodegenerative disorder are unknown, although they include spongiform degeneration, synaptic changes, brain inflammation, neuronal death, and protein aggregate accumulation, all of which occur simultaneously and synergistically in the brain.7,8 These are the common denominators in more than half of the neurodegenerative disorders induced by growing metal-catalyzed chemical imbalances.9,10 Hence, scientists believe that an imbalance in metal-catalyzed processes causes an adjustment in antioxidant function, which is one of the causes of PD. 11 Simultaneously, there is evidence that the relationship between metal-catalyzed processes and oxidative stress is developing in a variety of neurodegenerative disorders, including PD.12,13 In case of physiological mechanisms, overproduction of various reactive species, particularly reactive oxygen (ROS) and nitrogen (RNS) species, in conjunction with a breakdown of the body’s antioxidant enzyme systems, causes proteins, lipids, other cellular structures, and genetic components, such as DNA and RNA, to be destroyed. Furthermore, reactive species impacts on cellular structures, such as mitochondria and their related metabolic processes, result in an increase in ROS/RNS levels, which leads to the mitochondrial protein oxidation, DNA, and lipids. Many neuronal diseases, including Parkinson’s disease, Alzheimer’s disease, Huntington’s disease, Amyotrophic lateral sclerosis, and multiple sclerosis, have been associated with oxidative stress. Even though these metals are required for most biological activities and serve as cofactors for a variety of enzymes, their absence in the central nervous system (CNS) might cause problems. 14 Excessive metal accumulation in tissues can be cytotoxic and cause a slew of cellular issues and oxidative stress, which can set off the neurodegenerative cascade. 15 Other risk factors include having a family history of prion illness and eating meat infected with “mad cow disease.” 16 All familial PD concurrence is caused by prion protein mutations, which account for 10% to 15% of PD prevalence. 17
Early warning indicators of PD include memory problems, poor coordination, behavioral disorders, and vision difficulties.18,19 Later indicators involve blindness, dementia, coma, erratic movements, and weakness. Physical concerns include speech difficulties, ataxia (such as slurred speech, stumbling, falling, and incoordination), gait alterations (unable to walk in the usual way due to pathologies of the spinal cord, brain, legs, or feet), and rigid posture (decorticate posture is an atypical posturing when people suffered from clenched fists, bent arms, and legs held out straight) in PD patients. 20 These symptoms are commonly accompanied by involuntary movements in people with PD. More than 70% of patients with PD die within a year of diagnosis due to late diagnosis and the inability to detect early symptoms.21,22 Although sporadic (non-inherited) PD, also known as Creutzfeldt–Jakob disease, can kill in weeks or months, the disease course varies. 23
Numerous studies have discovered genetic links between the risk factors and the progression of PD throughout time. 24 However, it’s difficult to predict when these genetic linkages may reveal disease symptoms. Due to the ambiguity of these genetic linkages, the disease mechanism cannot be fully understood at the early stage. For this reason, several researchers have sought to provide potential biomarkers for PD that will aid in the early diagnosis of the disease. 25 In several investigations, biomarkers such as neuron-specific enolase (NSE), t-tau, and S100 have been discovered. 26 The use of NSE, t-tau, and S100 biomarkers for sporadic PD diagnosis is controversial, in part because of discrepancies in accuracy among studies and continents. 27 Therefore, it has been found that these biomarkers are insufficient for understanding the disease’s mechanism.
Researchers may be able to uncover possible candidate medications using gene expression data gathered from microarray analysis and next-generation sequencing (NGS) of mRNA tissue samples, and from potential biomarkers. 28 Hence, differentially expressed genes (DEGs), protein–protein interactions (PPIs), molecular pathway, and gene ontology (GO) analysis could be a significant way to figure out which genes, genetic factors, or pathways are involved in PD.
In this study, PD brain tissue samples were employed for gene expression data. The microarray datasets were analyzed using the GEO2R tool, which provides summary statistics generated by the limma topTable function. Limma is an R package which analyzes gene expression microarray data, especially for analyzing and assessing differential expression. Limma helps to analyze comparisons between many RNA targets simultaneously in arbitrary complicated designed experiments. Limma effectively combines a number of statistical principles. It works with a matrix of expression levels, where each column corresponds to an RNA sample and each row relates to a gene or other genomic feature relevant to the current investigation. After evaluating the datasets, DEGs were predicted from overall PD vs healthy sample. The DEGs were identified within the cutoff range (P < .05) and were considered significant. To adjust the P-values, logFC ⩾ 1 and logFC ⩽ −1 were considered significant. These datasets were analyzed to predict prospective biomarker transcripts in brain tissue to scrutinize their impact on the disease’s expression in humans. This study also predicted a list of potential drugs that could be useful in treating this deadly disease. This research mainly focused on biomarker signatures at transcriptional (mRNAs and miRNAs) and translational (hub proteins) levels and predicted possible biomarkers for the early detection of PD.
Materials and Methods
An overview of the entire analytical bioinformatics and system biology techniques to determine molecular biomarkers of PD is depicted in Figure 1.

Overall workflow scheme of this study. mRNA expression datasets of PD were analyzed to determine DEGs and related GO terms, KEGG pathways, PPI network, transcriptomic signatures, and possible candidate therapeutic drug targets.
Data retrieval
The data for this study were selected from the National Center for Biotechnology Information’s Gene Expression Omnibus (GEO) (https://www.ncbi.nlm.nih.gov/geo/geo2r/), 29 which is a public data resource that has high-throughput and microarray functional genomic data submitted by diverse research organizations. After scanning NCBI-GEO for PD data, 499 datasets were found. Among these, only 15 datasets were for humans. In this study, only human PD datasets from brain tissue sources were selected. The accession numbers for the selected microarray datasets are GSE160208 and GSE124571. There are 47 samples in the GSE160208 microarray dataset, 20 of which are healthy samples and 27 are disease samples. Another microarray dataset, GSE124571, has a total of 21 samples, including 10 healthy samples and 11 disease samples.
Identification of common DEGs between brain tissues
The microarray datasets were analyzed using the GEO2R tool, which provides summary statistics generated by the limma topTable function. The limma is known as a Bioconductor software package for analyzing data using R from gene expression studies and experiments. 30 After evaluating the datasets, DEGs were predicted. The DEGs were identified within the cutoff range (P < .05, and logFC ⩾ 1, logFC ⩽ −1) and were considered significant. The Benjamini–Hochberg (BH) approach was used to alter the P-value in this study. The BH technique can help reduce the number of erroneous findings. BH formula was applied for each P < .05. 31 The common DEGs of datasets including upregulated and downregulated gene sets were expressed by online server Draw Venn diagram (http://bioinformatics.psb.ugent.be/webtools/Venn/). 32
Functional gene set enrichment and pathway analysis
Gene set enrichment analysis (GSEA) is a method for determining whether a set of genes is linked to a particular disease. GSEA can also assist in overcoming analytical challenges. GSEA looks at microarray data to see if individuals from a particular gene set tend to be near the top (or bottom) of the list, and where the gene set is linked to behavioral class distinction. 33 Significant GO terms regarding biological process, molecular function, and cellular component (P < .05) were analyzed by performing a GSEA of DEGs using the Enrichr server (https://maayanlab.cloud/Enrichr/). 34 In addition, pathway analysis is employed to adjust and enhance the putative biomarker with altered experimental genes. In this study, the Kyoto Encyclopedia of Genes and Genomes (KEGG) pathway and Reactome pathway are used to analyze the results of high-throughput experimental experiments, working on novel methods for mining knowledge from genomic studies and system biologists developing new systems. This pathway analysis improves the statistical power of differential expression analysis, which is carried out directly at the route level. These pathway enrichment studies were performed through the Enrichr server where P < .05 has been regarded a standard metric.
PPI network and hub proteins identification
A PPI network is a mathematical representation of protein interactions in cells. PPI network is crucial to express the function of target protein and molecule therapeutic efficacy.35-37 The PPI network in this study was constructed via the NetworkAnalyst server (https://www.networkanalyst.ca/). 38 The genes of interest (seeds) or DEGs are mapped to the corresponding molecular interaction database (STRING). 39 The procedure typically produces 1 big subnetwork (“continent”) with several smaller ones (“islands”). The big subnetwork with highest nodes, edges, and seeds was selected for visualization. As evidentiary, Degree and Betweenness score were considered simultaneously to screen the edge or interaction among particular proteins, and short edge represents co-expression, co-localization. The so-called hubs or hub proteins which are typically described as the most highly linked central proteins are crucial in PPI networks. The protein hub was discovered using the physical interactions of DEG proteins from the NetworkAnalyst server. Those protein hub proteins can be a possible biomarker that could lead to the development of novel therapeutic drugs.
Identification of transcriptomic regulators
We have predicted regulatory biomolecules as transcription factors (TFs) and miRNAs that may influence DEG expression through the NetworkAnalyst Server. 40 miRNAs have a resource in the field of gene control and a prospective new therapeutic target class. miRNAs have a developmental role and several physiological functions that evolved over time.
Prediction of candidate drugs
Finally, the study employed the drug signature database (DsigDB) (http://dsigdb.tanlab.org/) 41 to find suitable drug molecules using the Enrichr server. The DsigDB dataset is used to search gene lists for gene–disease interaction compounds that lead to the use of pharmaceuticals or pharmacological targets. 42 Molecular formula and 3D/2D structure of predicted small molecules were extorted from online server PubChem (https://pubchem.ncbi.nlm.nih.gov/). 43
Potential biomarker validation
Predicted biomarkers: hub proteins, TFs, and miRNAs were cross-validated by comparing with the findings of other independent studies involving multiple analysts regarding PD in various search portals, such as PubMed, Google Scholar, and Google.
Results
Determination of DEGs
The datasets having accession number GSE160208 and GSE124571 were used to identify upregulated genes (adjusted P < .05, logFC > 1) and downregulated genes (adjusted P < .05, logFC < −1). A total of 35 common DEGs were identified as shown in Figure 2 and Table 1. Among those 35 common DEGs, 32 were upregulated genes and 3 were downregulated genes.
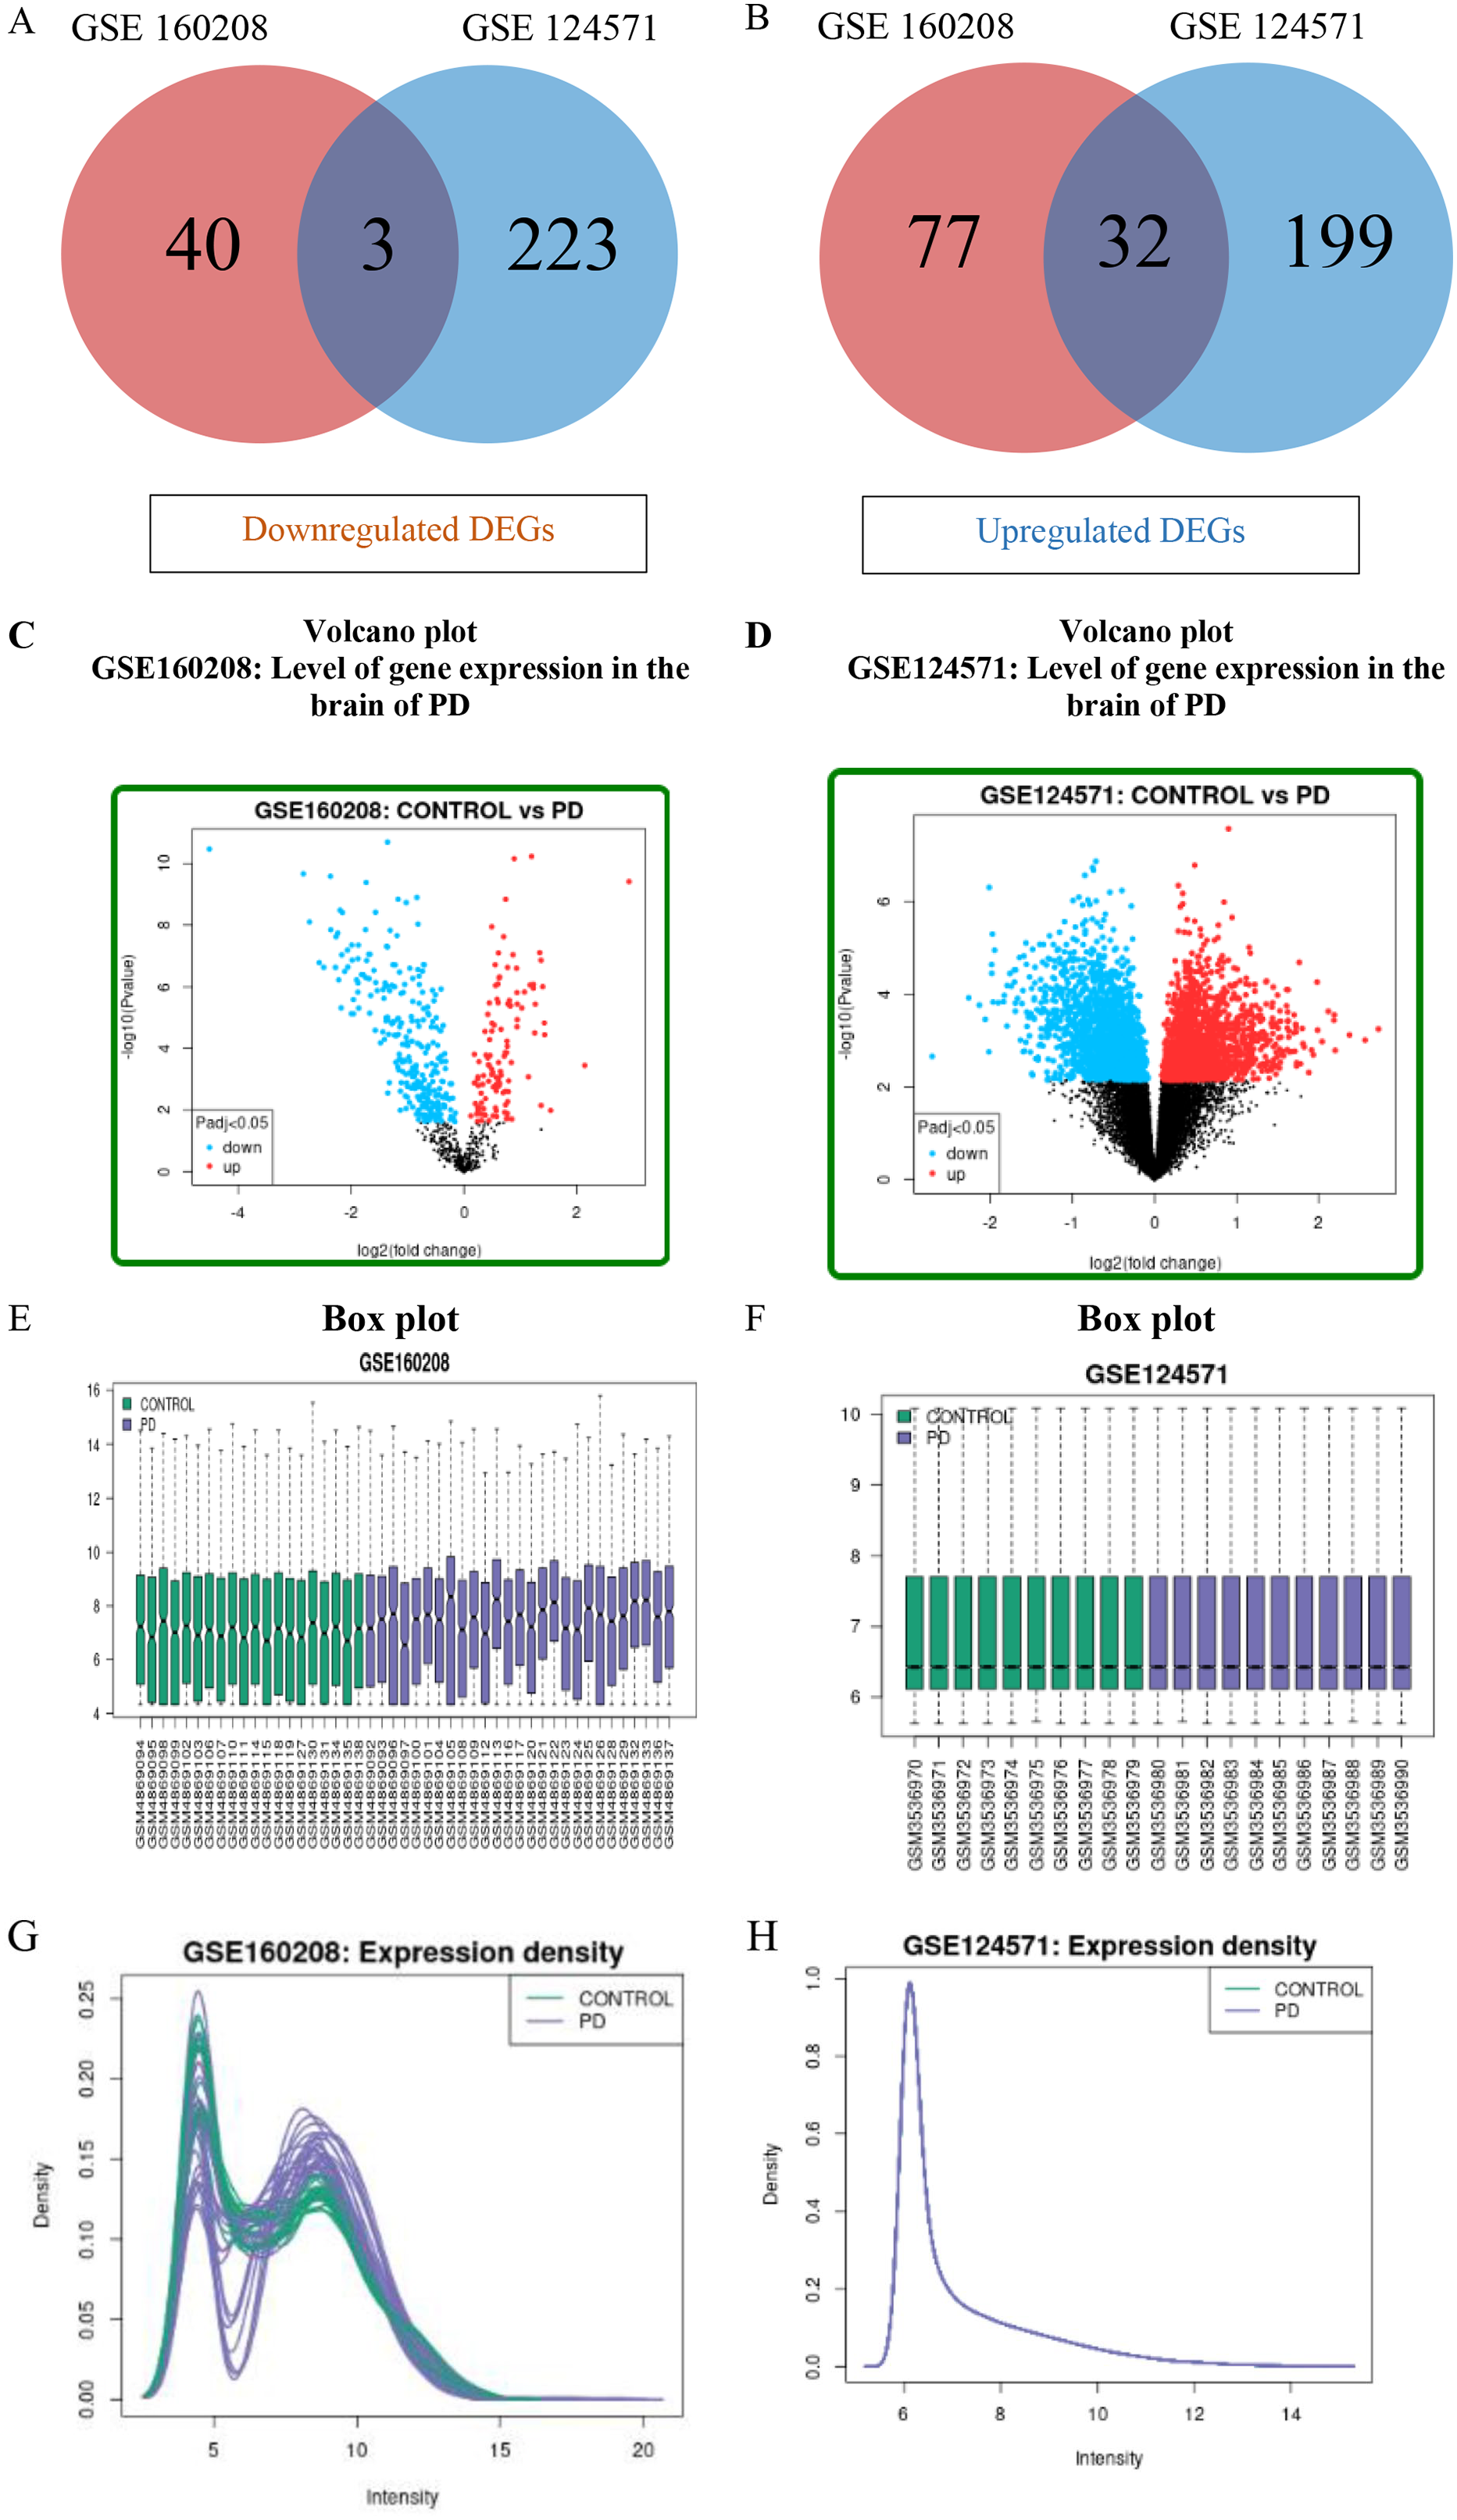
Identification of overlapping DEGs from microarray datasets and diverse distribution level of identified DEGs. (A and B) Mutual 32 upregulated and 3 downregulated DEGs, respectively identified from microarray datasets. (C and D) Volcano plot of significant DEGs (P < .05, logFC > 1, and logFC < −1) in comparison with insignificant genes. Here, green dots are upregulated genes, red dots are downregulated genes, and ash-colored dots are non-significant genes. Box plot (E and F) and expression density plot (G and H) of the GSE160208 and GSE124571 datasets.
Overview of DEGs identified from selected datasets of PD analyzed in this study.
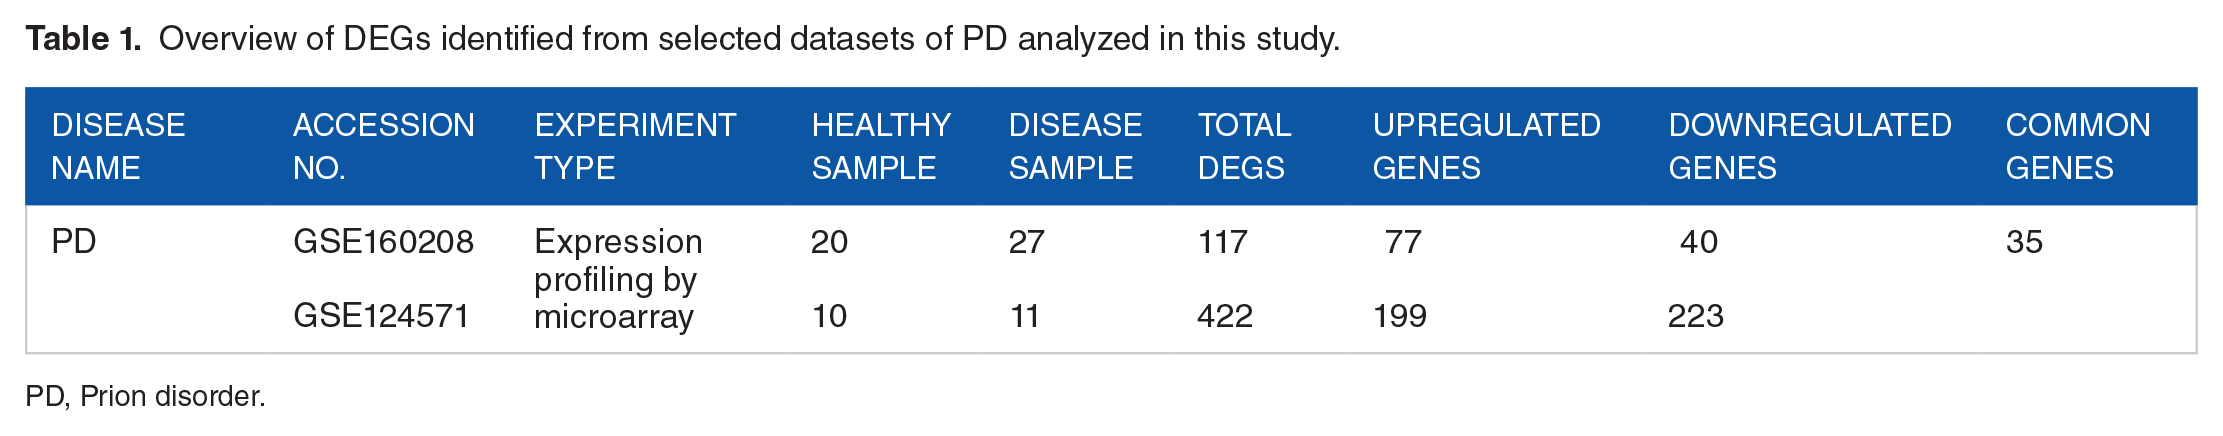
PD, Prion disorder.
GSEA of GO terms
GSEA assesses whether the ranked list of genes shares a common annotation and creates gene sets, decreasing the redundancy that might occur in the analysis due to similar GO. The top 10 significant GOs regarding biological processes, molecular functions, and cellular components based on P < .05 are shown in Table 2 and also these components are presented in the Bar diagram (Figure 3A-C). From the identified terms, DOCK2 downregulated gene was revealed to be most engaged in T cell receptor binding and the CD74 downregulated gene was revealed to be most engaged in CD4 receptor binding in PD. Furthermore, IFITM3, CDKN1A, IFITM2, SYK, EBI3, ITGAX, HMOX1, PTPN6, and TIMP1 upregulated genes were found active in the regulation of the cytokine-mediated signaling pathway, and CDKN1A and HSPB1 upregulated genes were found active in protein serine/threonine kinase inhibitor activity, which plays a role in the guideline of cell proliferation and differentiation, apoptosis, and embryonic development in PD.
Identified top 10 significant GO terms associated with DEGs in PD. Here, green color denotes related DEGs are upregulated and red color denotes related DEGs are downregulated.


GSEA of DEGs regarding 3 categories of GO terms in PD. (A-C) Bar graph expresses significant GO terms (P < .05) with related DEGs of biological process, cellular component, and molecular function, respectively. Where, vertical axis expresses significant GO terms (P < .05) and horizontal axis expresses −log10 P-value.
GSEA of pathways
The KEGG in the Enrichr server was used for analyzing pathways. KEGG is a frequently used database as a knowledge base for integrating and interpreting large-scale results produced by high-throughput genome sequencing and other technologies. The top 10 significant KEGG pathway is listed in Table 3. Furthermore, the Reactome pathway is a new route analysis tool that is used to perform quantitative pathway analysis (so-called gene set analyses). The top 10 significant Reactome pathway is listed in Table 4. KEGG and Reactome pathways involved with DEGs were evaluated for GSEA using Enrichr server (Figure 4).
Significant KEGG pathway (P < .05) enriched in Enrichr server. Here, green color denotes related DEGs are upregulated and red color denotes related DEGs are downregulated.

Significant Reactome pathway (P < .05) enriched in Enrichr server. Here, green color denotes related DEGs are upregulated and red color denotes related DEGs are downregulated.


(A and B) illustrates the Bar graphs of significant KEGG and Reactome pathways (P < .05) of PD enriched in Enrichr web-based server. Enriched top 10 KEGG and Reactome pathways showed significant correlation (P < .05) with DEGs. Each bar length and its brightness express the significance level (P < .05) of the pathways enriched.
PPI network and hub protein prediction
PPI network of significant DEGs was constructed by employing STRING intercom database of NetworkAnalyst server with a confidence score of 500. SPP1, FKBP5, HPRT1, CDKN1A, BAG3, HSPB1, SYK, TNFRSF1A, PTPN6, and CD44 were identified as the top 10 hub proteins from PPI network (Table 5). These identified top 10 hub proteins can work as potential biomarkers in PD. The PPI network of DEGs is demonstrated in Figure 5.
List of top 10 hub genes from PPI network and their expression level in PD.

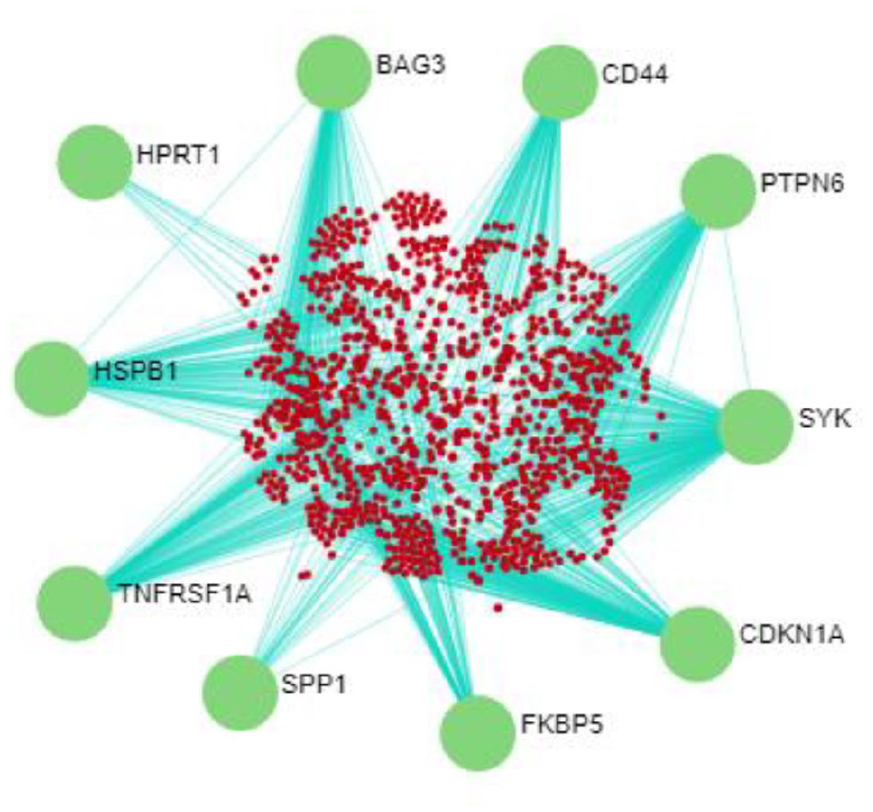
Visualization and prediction of hub proteins in PPI Network. PPI network formulated in NetworkAnalyst server demonstrating top 10 hub genes related to other DEGs. A confidence score (500) was employed in the STRING interactome database to create network. Green nodes express the top 10 hub genes, red nodes express DEGs, and blue edges express interaction level among DEGs. The size of the large node represents that they are hub proteins, whereas small nodes represent, they are DEGs.
Transcriptional regulator prediction
TFs and miRNAs associated with DEGs were predicted revealing regulatory biomolecules that could control DEG expression. The analysis revealed top 10 TFs (EGR1, SSRP1, POLR2A, TARDP, NR2F1, HDGF, CBFB, ELF1, HBP1 and ADNP) as shown in Figure 6A. Also, top 10 miRNAs associated with DEGs were estimated (hsa-mir-8485, hsa-mir-148b-3p, hsa-mir-4295, hsa-mir-26b-5p, hsa-mir-355-5p, hsa-mir-34a-5p, hsa-mir-16-5p, hsa-mir-486-3p, hsa-mi-512-5p and hsa-mir-455-3p) as shown in Figure 6B.

Transcriptomic signature molecules identified from NetworkAnalyst server. (A) Top 10 TFs linked to DEGs are demonstrated in the network where the red nodes are TFs, ash nodes are DEGs, and edges denote interaction among DEGs. (B) Top 10 miRNAs connected with DEGs. Here, brown square nodes are miRNAs, red nodes are DEGs, and edges denote interaction among DEGs.
Candidate drug molecule prediction
The DsigDB was used in this study to look for possible medication interactions with the hub proteins. The most significant drug molecules based on P < .05 were selected which are shown in Table 6. These potential drugs could be attractive pharmaceuticals and therapeutic targets for PD.
Predicted small drug molecules associated with DEGs identified in DSIGDB server.

Potential candidate biomarker
In the case of PD and other diseases, cross-validation research was done to justify anticipated biomarkers. These predicted hub genes and TFs linked to PD etiology have been identified as prospective candidate biomarkers in other research as shown in Figures 7A and B, respectively.
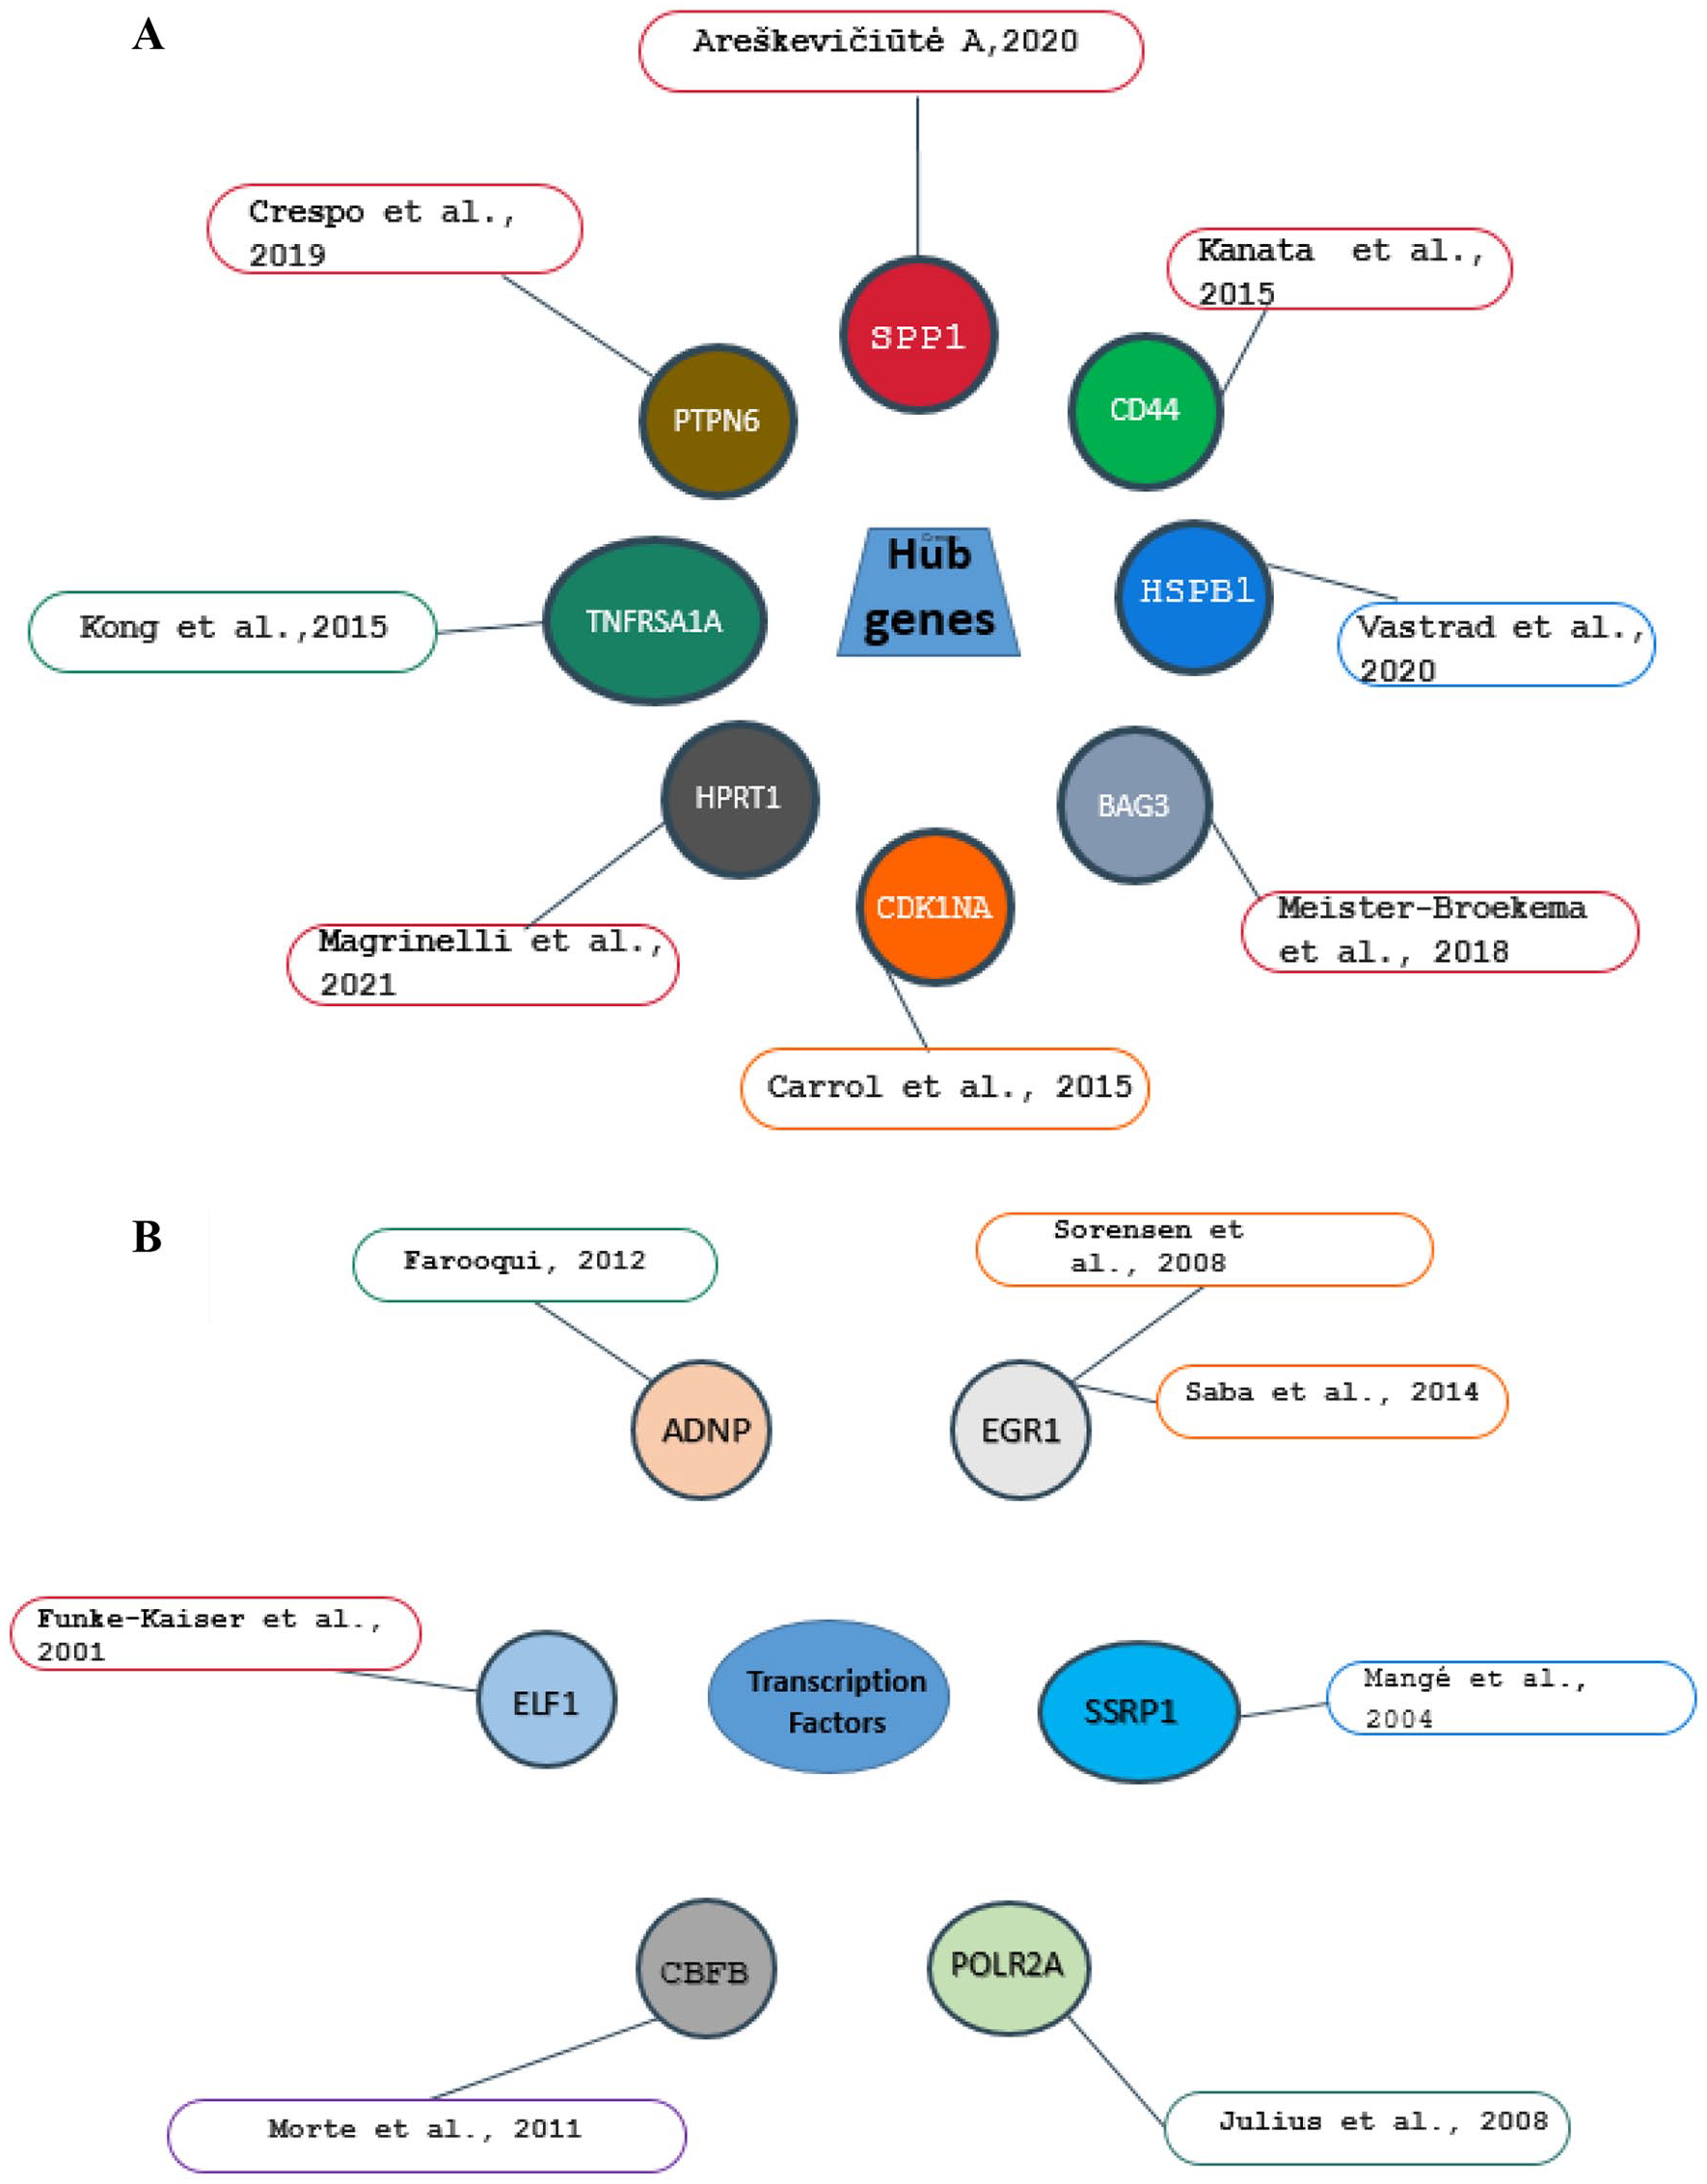
Potential biomarker validation was performed by extensive exploration of previous related literature using related hub genes and TFs of PD as keywords (A and B).
Discussion
In the current study, we have used PPI network, molecular key pathways, and regulatory pattern analyses to identify signatures at the molecular level that may have capacity to use as biomarkers or possible therapeutic targets against PD. We have explored gene expression datasets to determine PD-related transcriptomics, genetics, PPIs, pathways, and GO terms. The purpose of this study was to find molecular signatures, pathways, and lucrative potential therapeutic compounds from public PD data archives through an integrated bioinformatics and system biology workflow. This line of research evaluated an individual’s vulnerability to plasma Prion protein formation using molecular biomarkers of DEGs, PPI level, and metabolic pathways. As a result of this research, important genes and biological processes associated with these genes were uncovered.
In the study, differential gene expression was used to confirm the association between PD and altered expression level of genes. A total of 35 common DEGs were identified from 2 microarray datasets of PD. The disparity of mutual gene signature identification among different meta-analysis studies may be due to the presence of heterogeneous traits for a particular disease,44,45 variation in gene expression level, or limited sample numbers.46,47 According to the PPI network analysis, PD shows a strong link with these 10 hub proteins, which could be used as biomarker candidates or therapeutic targets. One of these 10 hub proteins, the cluster of differentiation (CD44) antigen, is engaged in cell–cell communication, adhesion, and migration. 48 In PD-affected parts of the CNS, CD44 is significantly regulated in a subgroup of reactive astrocytes. CD44 expression further facilitates strain identification by serving as a more reliable selective marker of prion infection with a wider range than deposition of misfolded Prion protein. 49 The CD44 protein could also be employed as a novel biomarker for detecting reactive astrocyte heterogeneity in CNS PD and recognizing various prion agent strains. Another hub protein, FKBP5, is thought to help PD patients live longer by minimizing the disease’s impact. 50 CDKN1A, another hub protein, is believed to be engaged in cell proliferation and the response to DNA damage. 49 It binds to G1 cyclin–CDK complexes and PCNA antigen, preventing G1 cell cycle progression and possibly triggering G2 arrest. 49 Another centrally positioned hub protein, HSPB1, is a protein that has 2 functions: stress resistance and actin organization. Its molecular chaperone function may control a variety of biological processes, including the phosphorylation of neurofilament proteins and axonal transport. 51 SYK, another crucial hub protein, is required for lymphocyte proliferation and immune cell activation. 52 The SPP1 gene codes for a cytokine that increases interferon-gamma and interleukin-12 expression while decreasing interleukin-10 synthesis, resulting in type I immunity with high phagocytic activity. 53 Through the c-Fos, protein kinase-C (PKC), and p-extracellular signal regulated kinase (p-ERK/ERK) pathways, SPP1 regulates the degeneration and regeneration of damaged nerves.53-55 In mice models of PD, SPP1 was reported to be elevated and to operate as an important modifier of macrophage morphologies and their capability to remove pathogenic beta-amyloid forms. 53 ,56-58 Its involvement in PDs, however, has yet to be elucidated. Furthermore, the TNFRSF1A protein regulates inflammation and can activate NF-B (nuclear factor kappa-light-chain-enhancer of activated B cells) and mediate apoptosis as a TNF (tumor necrosis factor-alpha) receptor.59,60 The gene product of PTPN6 (protein tyrosine phosphatase non-receptor type 6), commonly known as SHP-1 (Src homology region 2 domain-containing phosphatase-1), is a protein tyrosine phosphatase involved in cell differentiation, particularly in hematopoietic cells.61,62
Regulatory molecules are increasingly being scrutinized as potential biomarkers for major disorders, such as neurodegenerative diseases. 61 With this in mind, we looked into the role of TFs and miRNAs in the control of DEGs in PD pathogenesis via TF-miRNA coregulatory networks. Early growth response factor 1 (EGR1) is one of the TFs identified in this study, and it controls the transcription of a wide number of target genes to control the response to growth stimuli and DNA damage. This TF is in charge of cell survival, proliferation, and death.63-65 However, another study revealed the TF EGR1 in the inflammatory response genes of patients with PD. 66 According to several studies, activation of the receptor kinase/mitogen-activated protein kinase (RK/MAPK) produces active EGR1, which in turn transcribes cdk5/p35, which can “shut off” the signaling cascade. 67 Structure-specific recognition protein-1 (SSRP1), a FACT (facilitates chromatin transactions) complex component, has been identified as an ATP-dependent helicase (ATRX) complex member. In the late S-phase, this protein also accumulates in heterochromatin. 68 It is believed that SSRP1 accumulates in heterochromatin by the same signaling as death-associated protein 6 (Daxx), but with a distinct ATRX binding domain or a distinct intermediary protein.69,70 SSRP1 could be phosphorylated to interact with the ATRX-containing heterochromatin complex. These associations in vivo suggest the formation of multiprotein complexes in pericentromeric regions during or immediately after DNA replication.71,72 Most recently, the DNA-directed RNA polymerase II (POLR2A) variant has been reported in patients with a neuro-developmental condition marked by significant infantile-onset hypertonia. 71 This variant of biomarker also encodes the retinol binding protein 1 (RBP1) protein, a key component of DNA-dependent RNA polymerase II. 71
miRNAs play an important role in gene regulation, and evidence is mounting that they could be used as biomarkers. miRNAs are thought to be involved in the pathogenic mechanism that causes PD. 73 A study of PD found that has-mir-16-5p is involved in the regulation of dendritic remodeling and synaptic pruning, which is the first pathogenic hallmark of PD neuronal degeneration and Alzheimer’s disease. 74 The has-mir-16-5p miRNA was also useful in the creation of new PD treatments. 75 Another miRNA, hsa-mir-148b-3p, has been linked to PD and could potentially be employed as a biomarker for PD. 76
In addition to transcriptome expression, epigenome controls and mutations can have an impact on PD. From the foregoing explanation, we can deduce that the pathophysiology of this psychiatric condition is influenced by genetic, transcriptomic, post-transcriptomic, and epigenetic patterns at the architectural level. That is one of the reasons scientists were perplexed about the origin, diagnosis, prognosis, and pharmacological target for prion disease. RESVERATROL (CTD 00002483) is one of these pharmaceutical components that activate autophagy, a mechanism that protects organelles, cells, and organisms from diseases caused by misfolded prion proteins. 77 Anti-inflammatory medication aspirin (CTD 00005447) is a well-known ERK inhibitor and protects against neurodegenerative conditions, including prion diseases. 78 HYPOCHLOROUS ACID (CTD 00006135) component has outstanding disinfectant properties against prions and a variety of other diseases, and it does so without causing toxicity. 79 When a prion protein complex is altered or when cells are infected with prion protein, ZINC (CTD 00007011) uptake is impaired, which suggests that zinc deficiency contributes to the neurodegeneration that is typically linked with prion disease. 80 According to studies, Troglitazone (CTD 00002415) could be a useful therapeutic medication for the treatment of prion diseases. According to the study, Troglitazone (CTD 00002415) weakened prion protein. 81 Based on recent research, curcumin (CTD 00000663) have effects on a variety of neurological disorders including anxiety, depression, Alzheimer’s, Parkinson’s, multiple sclerosis, Huntington’s, and Prions disease. Recent improvements in curcumin (CTD 00000663) formulation’s medicinal effectiveness and the unique delivery techniques used to get over its low bioavailability and toxicity. 82 Anti-inflammatory medication aspirin is a well-known ERK inhibitor and protects against neurodegenerative conditions, including prion illnesses. Aspirin (CTD 00005447) have therapeutic impact on controlling cellular prion protein production and prion protein-mediated neurotoxicity. Aspirin (CTD 00005447) therapy prevented prion protein-induced neuronal cell death. 83 It also suppressed the prion protein which mediated the rise of the cellular prion protein. Nevertheless, there is no report on Tamibarotene (CTD 00002527) and N-Acetyl-L-cysteine (CTD 00005305) as therapeutic agents in PD.
Finally, the development of molecular-based bioinformatics approaches is opening up new avenues for medical practitioners to improve clinical decision-making in areas, such as disease diagnosis, drug therapy, and dose selection, and is a step toward fully personalized medicine.84,85 This research may yield vital new insights into disease mechanisms and drug therapy, which could be useful for future research to develop more effective therapeutic targets.
Conclusions and Future Directions
This study gave a rundown of network-based techniques for identifying molecular biomarkers and drug prospects. Using bioinformatics techniques, 35 overlapping DEGs were discovered from 2 human brain PD transcriptomics datasets. Following that, the top 10 hub proteins were unfolded and transcriptional and post-transcriptional regulators associated with DEGs were found in a slew of TFs and miRNAs. Prospective-annotated GO terms and pathways were focused to minimize the ambiguous pathophysiology of PD. The DsigDB also produced several candidate drug compounds, such as Resveratrol, that could be used as therapeutics against PD. These findings imply that bioinformatics techniques can be used to identify and investigate the progression of complicated neurodegenerative brain diseases, such as PD. The finding of these interactions could lead to new insights into disease-causing factors and potential therapeutic targets, which could have clinical ramifications. As a result, this study emphasizes the importance of using an integrated bioinformatics methodology to identify possible drug repositioning opportunities. This study now recommends a further in-depth investigation of this strategy to find more effective medications through clinical trials.
Footnotes
Funding:
The author(s) received no financial support for the research, authorship, and/or publication of this article.
Declaration of conflicting interests:
The author(s) declared no potential conflicts of interest with respect to the research, authorship, and/or publication of this article.
Author Contributions
M.B.R.M., U.K., M.A.A., and M.H.R. contribute to the conception and design. M.B.R.M. performed all the computational analyses. M.B.R.M. and U.K. wrote the draft manuscript; H.K.R., U.K., and T.M.M. helped prepare the tables and figures; U.K., M.A.A., M.H.R. and M.S.K. prepared the important intellectual content and critical revision; M.H.R. and M.S.K. jointly supervised the whole study. All authors approved the final version for submission.