
Abstract
To analyze genome-wide super-enhancers (SEs) methylation signature of breast invasive carcinoma (BRCA) and its clinical value. Differential methylation sites (DMS) between BRCA and adjacent tissues from The Cancer Genome Atlas (TCGA) database were identified by using ChAMP package in R software. Super-enhancers were identified sing ROSE software. Overlap analysis was used to assess the potential DMS in SEs region. Feature selection was performed by Cox regression and least absolute shrinkage and selection operator (LASSO) algorithm based on TCGA training cohort. Prognosis model validation was performed in TCGA training cohort, TCGA validation cohort, and gene expression omnibus (GEO) test cohort. The gene ontology and KEGG analysis revealed that SEs target genes were significantly enriched in cell-migration-associated processes and pathways. A total of 83 654 DMS were identified between BRCA and adjacent tissues. Around 2397 DMS in SEs region were identified by overlap study and used to feature selection. By using Cox regression and LASSO algorithm, 42 features were selected to develop a clinical prediction model (CPM). Both training (TCGA) and validation cohorts (TCGA and GEO) show that the CPM has ideal discrimination and calibration. The CPM based on DMS at SE regions has ideal discrimination and calibration, which combined with tumor node metastasis (TNM) stage could improve prognostication, and thus contribute to individualized medicine.
Introduction
Enhancers are short DNA regulatory elements (100-1000 bp) on the genome, which can cooperate with transcription factors (TFs) to regulate the transcription of related genes in an orientation-independent manner.1,2 All cell types in different tissues of the human body share the same genome, but the morphology and function of cells are totally different, which is largely determined by the cell-type-specific enhancer. 3 Super-enhancers (SEs) are a new class of DNA regulatory regions, which show a higher density of TFs binding than typical enhancers and are often associated with genes specific to key lineages that control cell status and differentiation in somatic cells.4,5 In addition, they have a stronger ability to promote gene expression and is mainly responsible for regulating and determining cell identity through spatiotemporally regulating gene transcription.5,6 In normal conditions, most SEs are in a suppression state, and generally only a small number of SEs that determine the cell identity are turned on. 3 Once the SEs are not properly regulated in specific somatic cells, it will cause the key-lineage-specific genes that control cellular states and differentiation to be abnormally expressed and result in diverse diseases.7-9 In tumor cells, SEs drive the expression of critical oncogenes such as Kruppel-like factor 5 (KLF5), TAL BHLH transcription factor 1 (TAL1), retinoic acid receptor alpha (RARA), LIM domain only 1 (LMO1), and calcium voltage-gated channel subunit alpha1H (CACNA1H), suggesting that tumor cells generate SEs at oncogenes that are involved in cancer pathogenesis.10-14 In addition, preferential disruption of SEs function can efficiently inhibit the expression of oncogenes in cancer cells. 15 On the contrary, epigenetically regulated SEs are drivers of abnormal oncogenes transcription in human cancer cells. A shift in SEs DNA methylation profiles in cancer cells is associated with the transcriptional over-activation or the silencing of the corresponding target genes. 16 Functionally, the DNA methylation obtained suggest that TFs contribute to this local activity of SEs and that trans-acting factors modulate DNA methylation profiles with impact on transforming processes during oncogenic transcription and tumorigenesis. 16 Thus, SEs and its methylation profiles can be used as potential biomarkers for cancer diagnosis, prognosis, and therapeutics.
Breast invasive carcinoma (BRCA) is one of the most commonly diagnosed malignancy in females, and it is also the main reason for cancer-related death worldwide. 17 Genetic mutations such as BRCA1/2 DNA repair-associated (BRCA1/2), tumor protein p53 (TP53), and phosphatase and tensin homolog (PTEN) are the important mechanisms that contribute to breast cancer carcinogenesis.18-22 It is relevant to know that the breast cancer related to these gene mutations is called hereditary breast cancer, accounting for 5% to 10% of all breast cancer patients.23-26 Recent studies indicated that H3K27ac-related SEs is a previously undetected deficiency in the BRCA1 mutation-carrying epithelium cells of human breast. 27 Functionally, BRCA1 mutations weaken SEs function and chromatin-associated looping in haplo-insufficient breast epithelium cells. 27 Breast cancer also shows heterogeneity in the patterns of epigenetic alterations. Previous studies have demonstrated that the DNA methylation patterns of breast cancer vary based on hormone receptor status, molecular subtypes, and with the presence of oncogene mutations.28-30 Aberrant DNA methylation in the promoter sites of oncogene or cancer suppressor gene is a hallmark of malignant tumor, which contributes to the tumorigenesis and metastasis of breast cancer.31-34 On the contrary, typical enhancer DNA methylation can also affect the expression of oncogenes and the prognosis of breast cancer patients. 35 However, genome-wide SEs methylation signature in breast cancer and its clinical value remains poorly understand. In addition, an integrative assessment of combined SEs and methylation signature represents a new perspective on the pathogenesis of breast cancer.
In this study, we systematically analyzed the SEs methylation landscape in The Cancer Genome Atlas (TCGA) BRCA cohort and developed differential methylation sites (DMS) based on SEs DMS with high performance for risk stratification of BRCA patients. Briefly, 2397 DMS were identified in 651 breast-tissue-specific SEs sites, and 42 of them were selected as prognostic-associated SEs methylation signature. In addition, both training (TCGA) and validation cohorts (TCGA and gene expression omnibus [GEO]) show that the clinical prediction model (CPM) based on 42 SEs methylation signature has ideal discrimination and calibration.
Materials and Methods
Data acquisition from the encode and TCGA database
Histone H3K27ac is an efficient and robust marker of SEs in various tissues.4,5,36 We therefore downloaded H3K27ac Chip-seq (Accession ID: ENCFF770ECC) and related input control (Accession ID: ENCFF568XAM) data sets from the encyclopedia of DNA elements (ENCODE) database (https://www.encodeproject.org). The quantification expression profile of 1231 BRCA and 123 para-cancer tissues based on Illumina HiSeq RNA-Seq were retrieved from the TCGA online database (https://portal.gdc.cancer.gov/repository). The expression data were quantified as raw read counts for differential expression gene (DEG) analysis. Corresponding clinical information of TCGA BRCA cohort were downloaded from cBioPortal Cancer Genomics website (https://www.cbioportal.org/). DNA methylation data based on human-methylation 450 bead-chip assay, including 1032 BRCA and 160 para-cancer tissues were obtained from the University of California Santa Cruz Xena Public Data Hubs (https://xenabrowser.net/datapages/). In addition, the methylation data of 295 BRCA patients based on human-methylation 450 bead-chip assay were downloaded from the GEO database using the accession numbers GSE72308. Figure 1 illustrates the protocol of bioinformatics analyses.

Schematic of the study method. H3K27ac Chip-SEQ and relative input bam format data of breast cancer were downloaded from ENCODE database and MACS2 software was used to select the significant peaks. By using ROSE software in Python2 environment, 651 super-enhancers were identified. On the contrary, DNA methylation data of 1032 BRCA and 160 adjacent normal samples were download form TCGA database. A total of 83 654 differently methylated sites between BRCA and adjacent samples were identified using ChAMP package in R software. Overlap analysis was used to assess the potential different methylation sites in super-enhancers region. Then, 2397 differently methylated probes in super-enhancers region were used to feature selection and develop clinical prediction model. Feature selection was performed by Cox regression and LASSO algorithm based on TCGA training cohort which include 526 samples. Finally, model validation (discrimination and calibration) was performed in TCGA training cohort, TCGA validation cohort, and GEO validation cohort. ENCODE, Encyclopedia of DNA elements; TCGA, The Cancer Genome Atlas; BRCA, breast invasive carcinoma; GEO, gene expression omnibus; LASSO, least absolute shrinkage and selection operator.
SE identification
The binary alignment files (in. BAM format) of breast H3K27ac Chip-seq data set generated by Bowtie 2 (version 2.3.5) based on hg19 reference genome was primary download from ENCODE database. MACS2 software (version 2.2.6) was used to identify enriched peaks and enhancer enrichment regions. The ROSE software 4,15 in Python2 environment was used to distinguish between enhancers and SEs. In the SEs recognition process, H3K27ac ChIP-seq peaks within ± 1000 bp of transcription start sites (TSS) were subtracted, and the enhancer sutured at a distance of 12 500 bp before ranking stitched enhancers according to H3K27ac occupancy rates. In addition, a cutoff value was determined according to the geometric inflection point to identify SEs.4,15 On the contrary, SEs target genes were calculated by using Young and colloeagues 37 algorithm.
Function annotation analysis and DEG analysis
To study the potential mechanism of SEs in tumorigenesis and metastasis of breast cancer, SEs target genes were used to function annotation analysis by using the ClusterProfiler and org. Hs.eg.db packages which was developed by Yu et al 38 in Bioconductor (http://www.bioconductor.org/). A P value less than 0.01 was served as statistically significant. Differential expression gene and overlap analysis was performed to identify the differential expression SEs target genes between breast cancer and normal tissues. The DEGs of RNA-seq data from TCGA database were identified by edgeR packages in R software (Version 3.5.1). A P value less than .05 and fold-change over 2.0 were served as statistically significant in DEG analysis.
Differential methylated positions and SE methylation analysis
The BRCA methylation data downloaded from XNA Public Data Hubs is a β value matrix. The β values for each locus and sample were calculated by the formula [β = Mean_methylated (M)/(Mean_methylated (M) + Unmethylated (U))]. Using the ChAMP package (Version 2.13.5) in R software (Version 3.5.1), β value matrix was first filtered and normalized through the embedded SWAN method. The differential methylated probes (DMPs) between BRCA tissue and adjacent normal tissue were identified by the champ.DMP () function in ChAMP package with the parameters P value less than .05 and delta β value over 0.1. 39 Then, we analyzed the methylation of SEs based on whether the coordinates of DMPs and SEs is overlapped.
Feature selection and prognosis model develop
We randomly divided 751 DNA methylation data matching full follow-up records and overall survival (OS) time greater than 30 days into TCGA training cohort (N = 526) and TCGA validation cohort (N = 225) according to a 3:2 ratios. Univariate Cox regression analyses were performed to evaluate whether the relation between prognosis and follow-up records in the TCGA training cohort and TCGA validation cohort were consistent. Feature selection was performed by univariate Cox regression and least absolute shrinkage and selection operator (LASSO) algorithm based on TCGA training cohort which include 526 samples. Briefly, the association between DMPs in SEs and OS were first filtered by univariate Cox regression analysis with a threshold of P value less than .05. Then, LASSO with 10-fold cross validation, which was often served as a robust dimensionally reduction technique, was applied to TCGA training cohort to select final predicative features. Finally, the multivariate Cox regression model fitted on final predicative features was used to calculate the risk scores and generate linear formula linear evaluation formula.
Validation of the prognosis model and development clinical nomogram
Prognosis model validation was performed in TCGA training cohort, TCGA validation cohort, and GEO test cohort. The discrimination efficiency including area under the curve (AUC) value and concordance index (C-index) of the prognosis model were assessed by Receiver-Operator Characteristic (pROC) package, Time ROC, Timereg, Survival, Survminer, and CompareC packages in R software (Version 3.5.1). A clinical nomogram integrating follow-up records and SEs methylation signatures was created by regplot package in R software (Version 3.5.1). In addition, the ROC and calibration curve of nomogram were derived by using R packages “pROC” and “rms.”
Results
SE and its potential function in human breast tissue
By using H3K27ac ChIP-seq data in ROSE pipeline, we identified 651 human breast-tissue-specific SEs (Figure 2A). The circos plot in Figure 2B shows that chromosome 1 has the highest percentage of breast-tissue-specific SEs, accounting for 14%. However, the top-ranked SEs was located on chromosome 11. On the contrary, chromosome 13 and X had the lowest percentage of breast-tissue-specific SEs, accounting for 0.46% and 0.31%, respectively. The distribution profile of SEs indicates that in human breast tissue the genes located in chromosome 1 are frequently regulated by SEs, while genes in X and 13 chromosome are less affected by SEs. The gene ontology (GO) and KEGG analysis revealed that SEs target genes were significantly enriched in cell migration, proliferation, cell junction, and cancer-associated processes and pathways (Figure 3A to D). In addition, 8.96% of SEs target genes (315) were further identified as the DEGs between BRCA and normal breast tissue (Figure 4A to B). Those genes were significantly enriched in cancer cells migration and metastasis-associated pathway (Figure 4C).

Super-enhancer in breast tissue. (A) Schematic of the stitching process to identify enhancer clusters and ranking based on H3K27ac signal intensities; (B) Using ROSE software, we identified 651 super-enhancer in human breast tissue. Chromosome 1 has the highest density and proportion of super-enhancers. Top-10 super-enhancers are marked with red dots.

Pathway enrichment analysis of super-enhancer target genes in breast cancer. Biological process (BP) (A), cell component (CC) (B), molecular function (MF) (C), and Kyoto encyclopedia of genes and genomes (KEGG) (D) pathway of SE target genes in breast cancer. TCGA represent The Cancer Genome Atlas; P < .05 was set as the cutoff criteria.

Functional analysis of super-enhancer target genes in breast cancer. Using edgeR package, we identified 3515 differentially expressed genes between breast cancer and normal breast tissues from TCGA breast cancer data set (A). 315 super-enhancer target genes were further identified as the DEGs between breast cancer and normal breast tissue (B) and those genes were significantly enriched in cancer cells migration and metastasis associated pathway (C). TCGA represent The Cancer Genome Atlas; P < .05 was set as the cutoff criteria.
Differential methylated sites in SE region
Using the champ.DMP () function in ChAMP package, we identified 83 654 DMS (P < .05 and|delta β| > 0.1) in the sample of 1032 BRCA and 160 adjacent normal tissues (Figure 5A). Meanwhile, we analyzed the annotation information of human-methylation 450 bead-chip and found that gene body (GB) and intergenic region (IGR) shared the highest proportion of DMS, 34.7% and 30.9%, respectively (Figure 5A). The distribution of DMS in the noncoding region of the genome (such as IGR) indicates that methylation of DNA regulatory elements could act as underlying mechanisms for oncogenic transcription, tumorigenesis, and metastasis of BRCA. In addition, overlap study identified 2397 of these DMS were located in the breast-tissue-specific SEs region (Supplementary Table 1). Interestingly, we found that there are multiple DMS in a breast-tissue-specific SE region, such as the SE-ID-36299 and SE-ID- 30649537 regions including 49 and 45 DMS, respectively (Figure 5B to C).
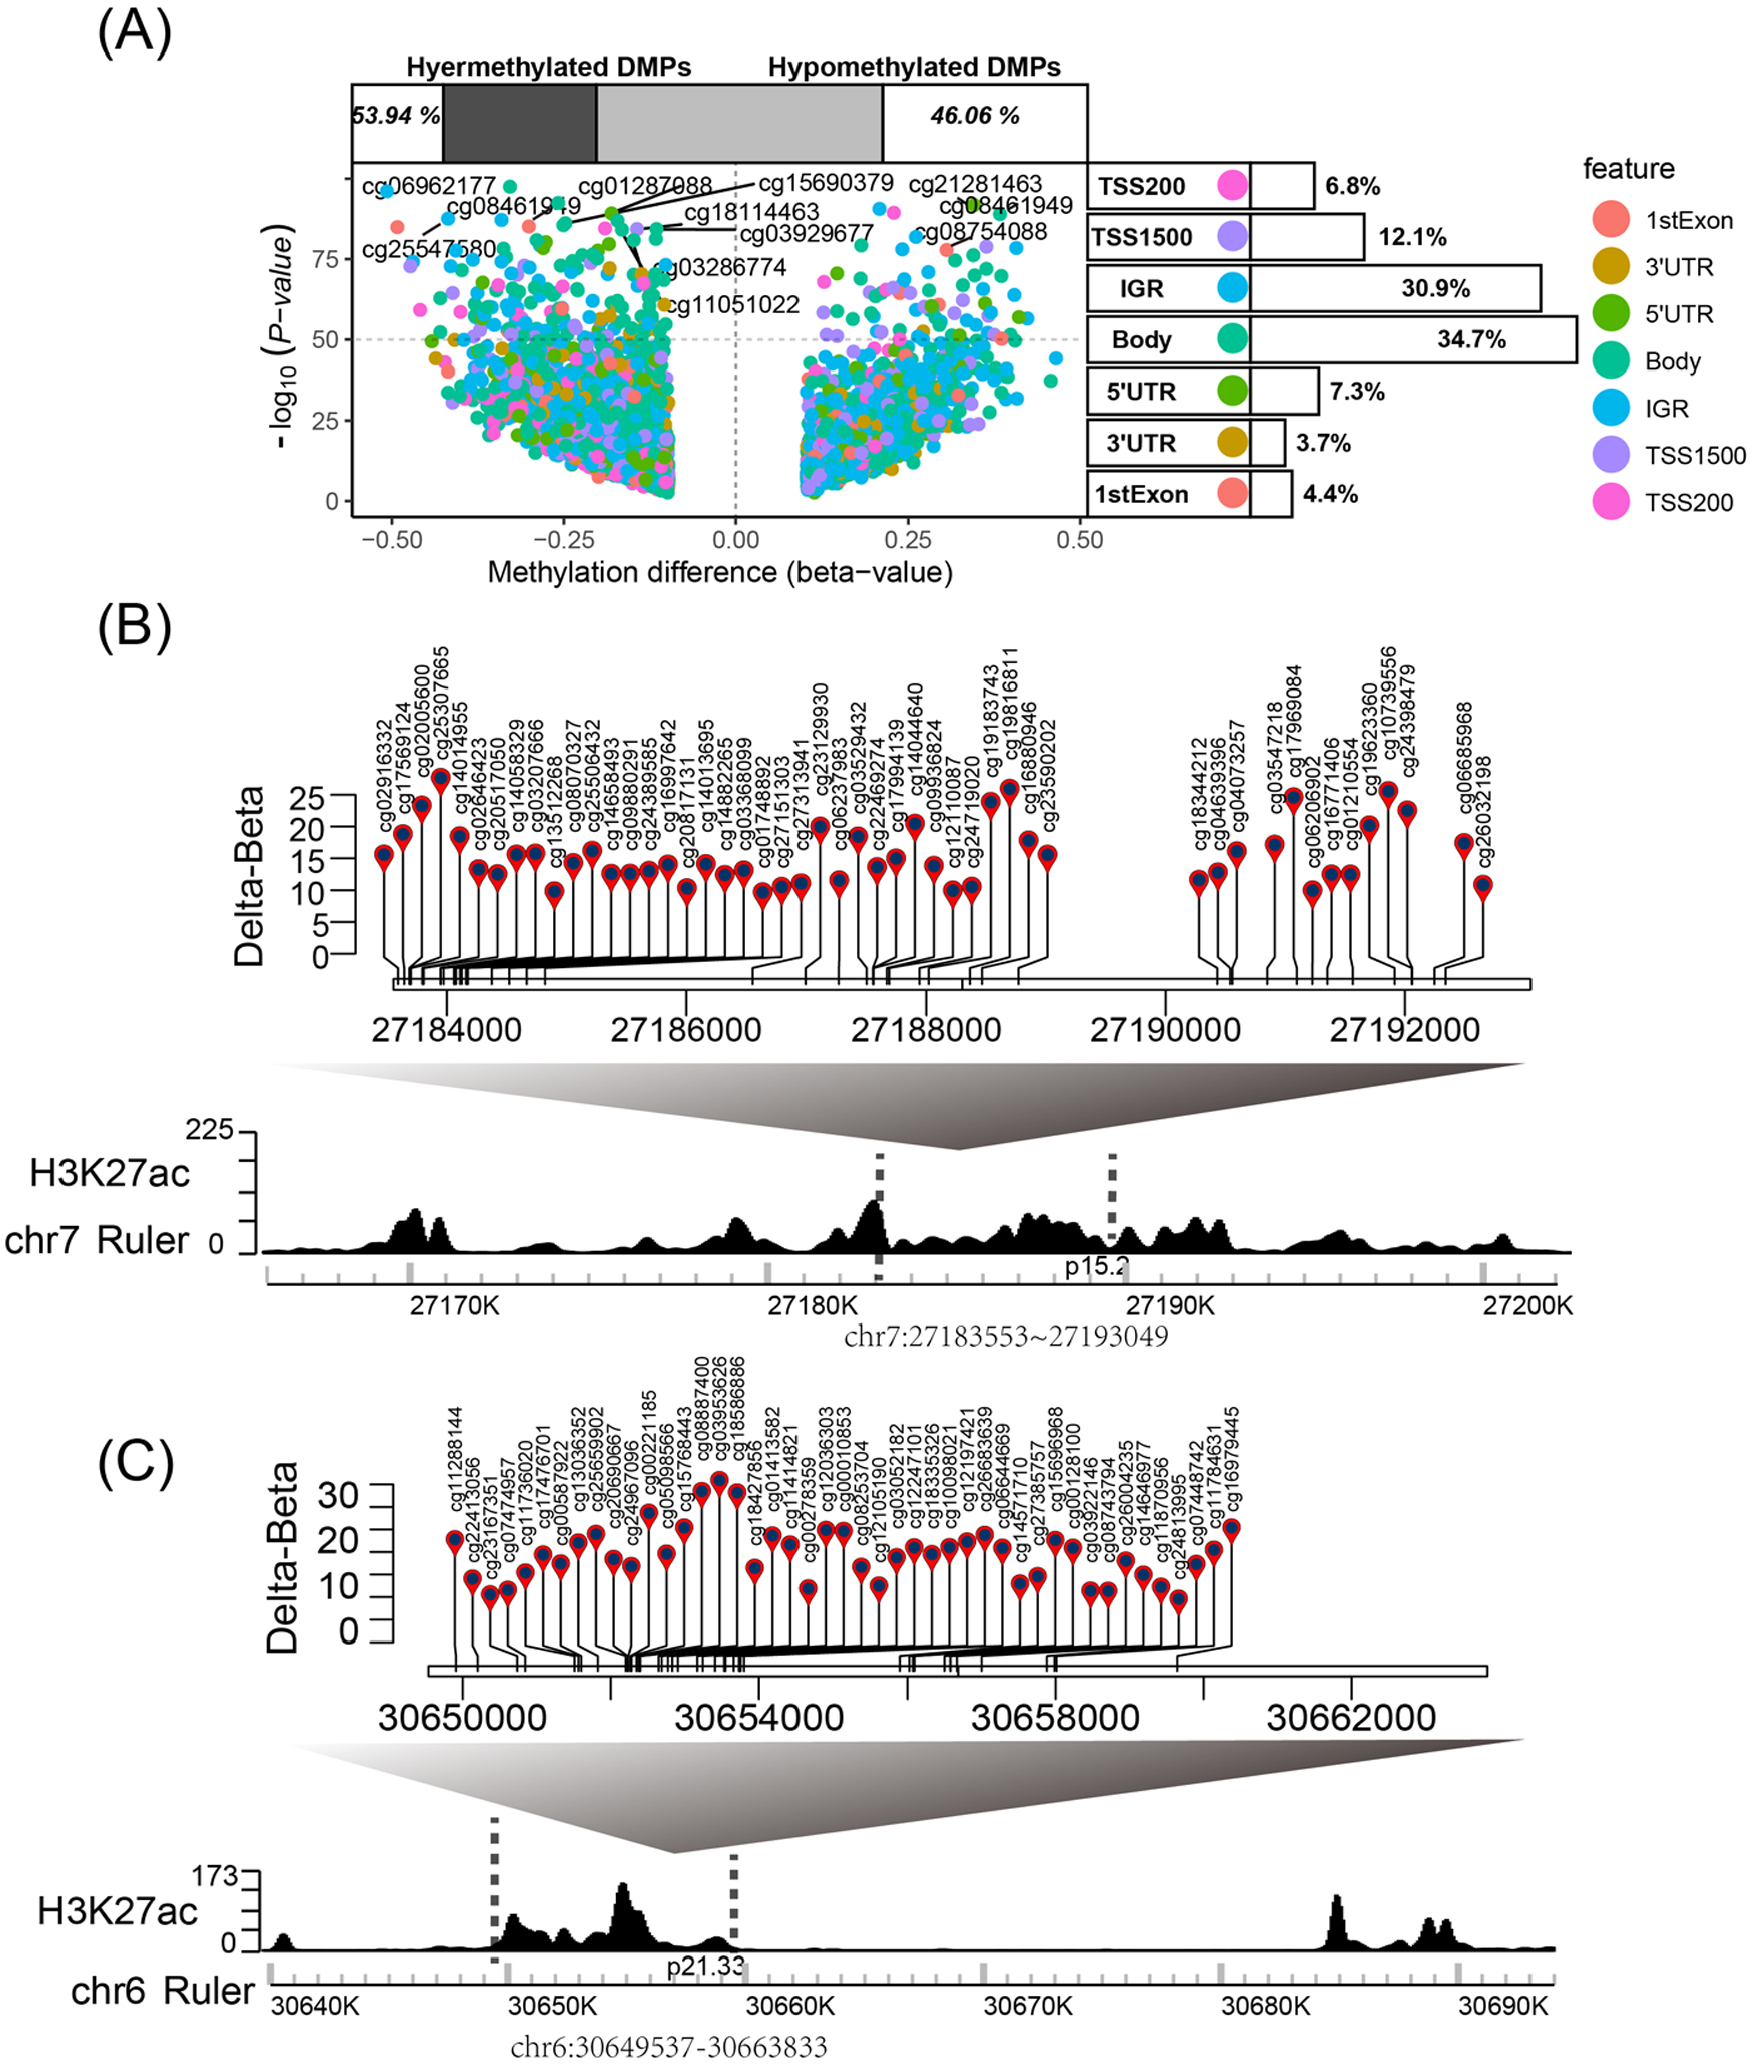
Identification of differential methylation probes of super-enhancer. (A) Volcano plot of –log10 (
The final prognosis features in clinical predication model
Univariate Cox regression analyses were performed to evaluate whether the relation between prognosis and follow-up records in the TCGA training cohort and TCGA validation cohort were consistent (Table 1). Specifically, the parameter including distant metastasis (M), Stage, HER2, and PR were consistent. Then, feature selection was performed by univariate Cox regression and LASSO algorithm based on TCGA training cohort which included 526 samples. We finally selected 42 features to develop a CPM (Supplementary Table 2, Figure 6A to B). The Kaplan-Meier curve (Figure 6C, D, E) of 42 DMSs in the low-risk and high-risk groups was performed in the TCGA training cohort, TCGA validation cohort and GEO text cohort, respectively. Using the median score as the cut-off value, patients were classified into low-risk and high-risk groups. The Kaplan-Meier curves confirmed significantly better survival for low-risk groups than their high-risk counterparts (log-rank tests P < .001, Figure 6C), which was confirmed in TCGA validation cohort (log-rank tests P < .001, Figure 6D) and GEO text cohort (log-rank tests P < .001, Figure 6E). On the contrary, we tested the discrimination (Figure 7) and calibration (Figure 8) of the CPM. At the discovery stage, the C-index for OS prediction of the model was 0.846 in the TCGA training cohort (Figure 7A). The AUCs for 1000, 2000, and 3000 days OS predictions in the training set were 0.894, 0.906, and 0.957 (Figure 7B). The preliminary result indicated the model achieved good performance in predicting OS using training set data (Figure 7A, B). In the TCGA validation cohort, the C-index for OS prediction was 0.870, the AUCs for 1000, 2000, and 3000 days OS predictions in training set were 0.886, 0.845 and 0.875 (Figure 7C, D). In the GEO validation cohort, the C-index for OS prediction was 0.785, the AUCs for 1000, 2000, and 3000 days OS predictions in the training set were 0.825, 0.820, and 0.848 (Figure 7E, F). The discrimination efficiency of the model was ideal. Finally, a nomogram predicting 5 and 8 years OS of patients was constructed according to the univariate analysis results of the TCGA training set (Figure 8A). In TCGA training and validation cohort, the univariate analysis indicated that M, TNM stage impacted significantly on OS, whereas the status of HER2, PR were found to be insignificant parameters, although ER impacted significantly on OS in TCGA training cohort, but it wasn’t validated in TCGA validation cohort (Table 1). Therefore, we incorporated TNM Stage and the CPM model into the nomogram (Figure 8A). The C-index for OS prediction of the nomogram was 0.80 ± 0.04 in TCGA training cohort. Internal validation using data from TCGA validation cohort revealed that a C-index of 0.86 ± 0.04. For external validation, C-index calculated using GEO test cohort data was 0.79 ± 0.04. The calibration plots displaying the probability of 3, 5, and 8 years survival indicated favorable curve-fitting between the nomogram-predicted outcomes and actual observation in the TCGA training cohort, TCGA validation cohort, and GEO validation cohort, respectively (Figure 8B to D).
Characteristics of patients in the primary and validation cohorts.

Note: TNM: TNM Staging of Breast Carcinoma; T: T1 to T4; N: N0-N3, M: M0-M1; Cancer stage: stage I to stage X; Age: less 55 over 55
Abbreviations: CI, confidence interval; ER, estrogen receptor; H, high; HER2, human epithelial growth factor receptor-2; L, low; PR, progesterone receptor.
P value less than 0.05; **P value less than 0.01; NSP value over 0.05.

The final prognosis features in clinical predication model. (A, B) Least absolute shrinkage and selection operator analysis (LASSO) coefficient profiles of 42 DMSs selected by univariate Cox regression analysis. In the TCGA training cohort, the Kaplan–Meier curve (C) 42 DMSs in the low-risk and high-risk groups. In the TCGA validation cohort, the Kaplan–Meier curve (D) 42 DMSs in the low-risk and high-risk groups. In the GEO validation cohort, the Kaplan–Meier curve (E) of 46 DMSs in the low-risk and high-risk groups.

The discrimination efficiency of the prognosis model. Time dependent AUC analysis during the observation period of 1~10 years and receiver operating characteristic (ROC) analysis for the 1000-,2000- and 3000 day OS probability in the TCGA training cohort (A, B), TCGA validation cohort (C, D) and GEO test validation cohort (E, F).

The establishment and assessment of a novel nomogram (A) A nomogram integrating clinical features with a 42-DMSs risk score for predicting of 3, 5, and 8 years OS in patients with breast cancer. Calibration plots of the nomogram for 3, 5, and 8 years OS prediction in the TCGA training cohort (B), the TCGA validation cohort (C), and the GEO test validation cohort. (D), respectively. The abscissa represents the nomogram-predicted survival probability and the ordinate represents the actual survival.
Discussion
In this study, we systematically analyzed the methylation landscape in TCGA BRCA cohort, 2397 differently methylated probes between BRCA and adjacent samples in SEs region were identified. Forty-two features were selected to develop a CPM by Cox regression and LASSO algorithm based on TCGA training cohort. Both training (TCGA) and validation cohorts (TCGA and GEO) show that the CPM has ideal discrimination and calibration. Therefore, it has important application value for judging the prognosis of BRCA patients.
Breast cancer is the most frequently diagnosed cancer and the leading cause of cancer death among females all over the world. Its prognosis is weak because of the gene signature complexity and other factors of breast cancer. 40 Clinicopathological factors are not sufficient for the accurate prognosis of breast cancer. Recently, there are methods which have been proposed to identify multigenes for breast cancer prognosis, and some of the methods have been approved for commercial use, including PAM50, Mamma, and RS test; these methods lead to a progress in the breast cancer treatment paradigm. 41 Although the screening, diagnosis, and treatment of BRCA have been significantly improved, the clinical prognosis of some patients is still poor. Therefore, it is of great significance to develop new molecular markers based on different detection methods. It is presented in this article that we developed and validated a nomogram prognosis model based on different methylated probes within SEs regions. The CPM has ideal discrimination and calibration, which combined with TNM stage could improve prognostication, and thus maybe contribute to individualized medicine.
Enhancers regulate the transcription of related genes in an orientation-independent manner.1,2 All cell types of different tissues of the human body have the same genome, but the morphology and function of the cells are completely different, which largely depends on the cell type-specific enhancer. 3 Super-enhancers are a new class of DNA regulatory regions, composition of clusters of enhancers, which are often associated with genes specific to key lineages that control cell status and differentiation in somatic cells.4,5 They have a stronger ability to promote gene expression and are mainly responsible for regulating and determining cell identity by regulating gene transcription.5,6 Under normal circumstances, most SEs are in a suppressed state, and usually only a few SEs that determine cell identity is being turned on. 3 Once SEs are not properly regulated in a specific somatic cell, it will cause abnormal expression of key lineage-specific genes that control cell state and differentiation and lead to a variety of diseases.7-9 In cancer cells, the SEs could control the expression of key oncogenic drivers.6,15 The new oncogenic SEs may be produced through a variety of mechanisms in tumor cells, including mutations and genomic changes, chromosomal rearrangements, spatial changes in the location of SE due to changes in 3-dimensional chromatin structure, and viral oncogenes. 42 For example, the expression of critical oncogenes such as KLF5, TAL1, RARA, LMO1, CACNA1H, and so on were driven by SEs, which implicated that tumor cells generate SEs at oncogenes which are involved in cancer pathogenesis.10-14 The destruction of SEs function can effectively inhibit the expression of oncogenes in cancer cells. 15 And disruption of SE-driven tumor suppressor gene expression promotes the malignancy of breast carcinoma. 43 These data validated that SEs play an important role in tumor. Recently, scPrognosis had been proposed to improve breast cancer prognosis with scRNA-seq data, but it only provided clues to the link between Epithelial-MesenchymalTransition (EMT) and clinical outcomes of breast cancer. 41 In our prognosis model, the GO and KEGG analysis revealed that SEs target genes were significantly enriched in cell migration, proliferation, cell junction, and cancer associated processes and pathways. In addition, 8.96% of SEs target genes, which were further identified as the DEGs between BRCA and normal breast tissue, were significantly enriched in cancer cells migration and metastasis associated pathway. These results implied that SEs impact on transforming processes of oncogenic transcription, tumorigenesis and metastasis in breast cancer. Therefore, the prognostic model based on SEs may be much better suitable for breast cancer.
Epigenetically regulated SEs could drive abnormal oncogenes transcription in human cancer cells. For example, changes in the distribution of SEs DNA methylation in cancer cells are related to the excessive activation or silencing of transcription of the corresponding target genes.16,44 The obtained DNA methylation suggests that TFs contribute to this local activity of SEs, and the regulation of DNA methylation profile modulated by trans-acting factors has an impact on the transformation process during carcinogenesis. 16 Therefore, we suspected that the DMS in the SE regions could be used to judge the prognosis of patients. Our results also proved this conjecture. The more important thing is the CPM based on the different methylation sites in the SE regions could judge the prognosis of breast cancer. In an early study, a 28-CpG-based multi-CpG methylation panel was identified and validated which could classify breast cancer patients into significantly different survival groups, but the discrimination was not ideal. 45
Interesting studies have shown that H3K27ac-related SE is a previously undiscovered defect in human breast cancer epithelial cells carrying BRCA1 mutations, 27 and BRCA1 mutations impair the SEs function and chromatin looping in haplo-insufficient human breast epithelial cells. 27 The DNA methylation profiles of breast cancer vary based on hormone receptor status, molecular subtypes, and with the presence of oncogene mutations were demonstrated.28-30 Abnormal DNA methylation at the promoter position of an oncogene or cancer suppressor gene is a hallmark of malignant tumors, these aberrant DNA methylations contributes to the tumorigenesis and metastasis of breast cancer.31-34 It was reported that typical enhancer DNA methylation could also affect the expression of oncogenes and the prognosis of breast cancer patients. 35 In the study, we identified 83 654 DMS between BRCA and adjacent tissues, and 2397 DMS were in SEs region, which implied methylation status changes in enhancer regions of BRCA promotes tumorigenesis and development, and emphasized the importance of the location of DNA methylation for the development of cancer biomarkers. 46
DNA methylation status in normal cells points to locally active regulatory sites at SEs, which are targeted by the expression of downstream genes. 16 The DNA methylation profile shift of SE of human tumors is related to the transcriptional silence or over-activation of the corresponding target gene. 16 Therefore, the clinical value of genome-wide SEs methylation signature analysis in breast cancer is warranted. In this study, genome-wide SEs methylation signature in breast cancer and its clinical value were explored. We found that GB and IGR shared the highest proportion of DMS, 34.7% and 30.9%, respectively. Overlap studies identified 2397 of these DMS were located in the breast-tissue-specific SEs region. We also found that there were multiple DMSs in one breast-tissue-specific SE region, such as the SE-ID-36299 and SE-ID-30649537 regions including 49 and 45 DMSs, respectively. We finally selected 42 features to develop a CPM using Cox regression and LASSO algorithm. Both training (TCGA) and validation cohorts (TCGA and GEO) show that the CPM has ideal discrimination and calibration.
We systematically analyzed the SEs methylation landscape in TCGA BRCA cohort and developed a CPM based on SEs DMS with high performance for risk stratification of BRCA patients. In our study, the AUCs for 1000-, 2000- and 2000-day OS predictions were greater than 0.800 in the TCGA training cohort, TCGA validation cohort and GEO validation cohort, the C-index for OS prediction were greater than 0.785. We would like to acknowledge that this study is not devoid of limitations. This study has a drawback of retrospective design, it needs multicenter, large-scale, prospective studies to further validate the conclusions.
Conclusion
In this study, we systematically analyzed the SEs methylation landscape in TCGA BRCA cohort and developed a CPM based on DMS on SEs regions, both training (TCGA) and validation cohorts (TCGA and GEO) show that the CPM has ideal discrimination and calibration, which combined with TNM stage could improve prognostication, and thus contribute to individualized medicine.
Supplemental Material
sj-csv-1-bbi-10.1177_11779322231162767 – Supplemental material for Somatic Super-Enhancer Epigenetic Signature for Overall Survival Prediction in Patients with Breast Invasive Carcinoma
Supplemental material, sj-csv-1-bbi-10.1177_11779322231162767 for Somatic Super-Enhancer Epigenetic Signature for Overall Survival Prediction in Patients with Breast Invasive Carcinoma by Xu Yang, Wenzhong Zheng, Mengqiang Li and Shiqiang Zhang in Bioinformatics and Biology Insights
Supplemental Material
sj-doc-2-bbi-10.1177_11779322231162767 – Supplemental material for Somatic Super-Enhancer Epigenetic Signature for Overall Survival Prediction in Patients with Breast Invasive Carcinoma
Supplemental material, sj-doc-2-bbi-10.1177_11779322231162767 for Somatic Super-Enhancer Epigenetic Signature for Overall Survival Prediction in Patients with Breast Invasive Carcinoma by Xu Yang, Wenzhong Zheng, Mengqiang Li and Shiqiang Zhang in Bioinformatics and Biology Insights
Footnotes
Funding:
The author(s) disclosed receipt of the following financial support for the research, authorship, and/or publication of this article: This study was supported by a Research Start-up Fund from the Seventh Affiliated Hospital, Sun Yat-sen University. (ZSQYRSFPD0005), Shenzhen Science and Technology Program (JCYJ20220530144814033) and Guangdong Basic and Applied Basic Research Foundation (2023A1515010690).
Declaration of Conflicting Interests:
The author(s) declared no potential conflicts of interest with respect to the research, authorship, and/or publication of this article.
Author Contributions
X.Y. and W.Z. participated in the design and/or interpretation of the reported experiments or results. All authors participated in the acquisition and/or analysis of data and in drafting and/or revising the manuscript. M.L. and S.Z. provided administrative, technical, or supervisory support.
Supplemental Material
Supplemental material for this article is available online.
References
Supplementary Material
Please find the following supplemental material available below.
For Open Access articles published under a Creative Commons License, all supplemental material carries the same license as the article it is associated with.
For non-Open Access articles published, all supplemental material carries a non-exclusive license, and permission requests for re-use of supplemental material or any part of supplemental material shall be sent directly to the copyright owner as specified in the copyright notice associated with the article.