
Abstract
Whole genome sequencing has rapidly progressed in recent years, with sequencing the SARS-CoV-2 genomes, making it a more reliable clinical tool for public health surveillance. This development has resulted in the production of a large amount of genomic data used for various types of genomic exploration. However, without a proper standard protocol, the usage of genomic data for analyzing various biological phenomena, such as mutation and evolution, may result in a propagating risk of using an unvalidated data set. This process could lead to irregular data being generated along with a high risk of altered analysis. Thus, the current study lays out the foundation for a preprocess pipeline using data analysis to analyze the genomic data set for its accuracy. We have used the recent example of SARS-CoV-2 to demonstrate the process overflow that can be utilized for various kinds of biological exploration such as understanding mutational events, evolutionary divergence, and speciation. Our analysis reveals a significant amount of sequence divergence in the gamma variant as compared with the reference genome thereby making the variant less infective and deadly. Moreover, we found regions in the genomic sequence that is more prone to mutational localization thereby altering the structural integrity of the virus resulting in a more reliable molecular viral mechanism. We believe that the current work will help for an initial check of the genomic data followed by the biological assessment of the process overflow which will be beneficial for the variant analysis and mutational uprising.
Keywords
Introduction
At the end of 2019, a large number of human pneumonia cases were reported in the Chinese city of Wuhan. 1 The causative agent of this disease was later identified as virus, and it was named as coronavirus disease 2019 (COVID-19). 2 Whole genome sequencing of the virus revealed the resemblance of its RNA genome with previously discovered coronavirus SARS-CoV in 2003; hence, it was officially designated as SARS-CoV-2. 3 Over the time, different variants of SARS-CoV-2 has been identified, such as alpha variant (B.1.1.7; first detected in United Kingdom), gamma variant (P.1; first detected in Brazil), and omicron variant (B.1.529; first detected in South Africa) (Figure 2). A large number of genome sequences have been submitted in the National Center for Biotechnology Information (NCBI; https://www.ncbi.nlm.nih.gov/) database. With a huge deposition of genomic data, it becomes imperative to use them to explore the molecular- and genomic-level changes in different variants.
The generated genomic information (ie, WGS/WES information) incorporates tremendous measures of data of expected significance for an individual. The wide accessibility of genomic information likewise offers opportunities for reuse for extra clinical, well-being, research, or sporting purposes. Establishment of a proper pipeline reassures how the process can be streamlined. Exploratory data analysis (EDA) of genomic sequences can lay the foundation to identify a good quality genomic sequence, explore the genomic variability with reference sequence and identify potential variants.
A large amount of effort has been put forward for the development of vaccines against SARS-CoV-2 but a preliminary analysis of the genomic sequence might reveal the minute genomic changes in different emerging variants that is necessary for drug development. The current work focuses on the usage of EDA to establish a pipeline (Figure 1) for initial assessment of the genomic sequence and explore the wide range of genomic variability. Our work establishes a workflow which can be used for any viral/bacterial genome sequencing to identify evolutionary changes throughout the population growth time, mutational changes, variability with respect to the reference genome. Taking SARS-CoV-2 as an example, we explored the genomic instability of 3 variants of concern (VOCs; alpha, gamma, and omicron). The results obtained suggest a clear advantage of the EDA usage for preliminary examination of genomic data. The proposed pipeline offers an advantage to the user to perform the EDA of a given genomic sequence and explore the potential viability of the sequence being generated by a particular sequencing device. This further allows the user to analyze whether to continue the analysis with the given sequence or not as performing the biological examination on a poorly produced sequence from the device can result in an unreliable result.

Process overflow of the proposed pipeline. The flowchart represents the steps involved in performing the exploratory data analysis for a given sequence. The details of each step have been further discussed in the methodology section. NCBI indicates National Center for Biotechnology Information; SRA, Sequence Read Archive; WGS, whole genome sequencing.
Methodology
Data procurement
The whole genome sequence data of SARS-CoV-2 (wild-type Wuhan sequence, NC_045512), alpha variant (B.1.1.7; first detected in United Kingdom, SRR13453793), gamma variant (P.1; first detected in Brazil, SRX12693832), and omicron variant (B.1.1.529; first detected in South Africa, SRX13632861) were downloaded from the Sequence Read Archive (SRA) database of NCBI (https://www.ncbi.nlm.nih.gov/sra/). Only those WGS that were produced using Oxford Nanopore MinION were taken.
EDA of whole genome sequences
The downloaded data for the respective variants were analyzed to understand the sequencing data quality. The length of the sequence reads and the Phred score (Q) were calculated to analyze quality in terms of the base call error probability (P). Phred scores are resolved using different indicators of conceivable mistakes, for example, peak spacing, uncalled/called peak proportion, and peak resolution. The Phred score (Q) is normally defined in terms of the base error call probability (P) as

So, Q = 10 corresponds to a 10% probability of a base to be placed at a wrong position. Subsequently, a high sequencing profundity, for example, an enormous number of coverings peruses at each arrangement position, is expected to accomplish precise outcomes.
Read mapping
The respective variant reads were then mapped with the corresponding reference genome to explore the homologous regions between the reference and the variant. For the homologous regions between the read and the genome, all matches ought to be roughly on a similar diagonal. Little deviations might emerge from insertions/deletions (indels). Tyler and group 4 have demonstrated an indel error rate for MinION where insertion rate pi = 0.03 and deletion rate pd = 0.05. Based on these values, a band can be defined that approximately covers the read indels 5 :
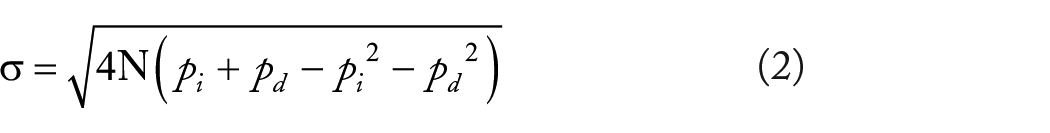
where sigma gives the standard deviation from the correct diagonal and N corresponds to the read length.
Variant calling
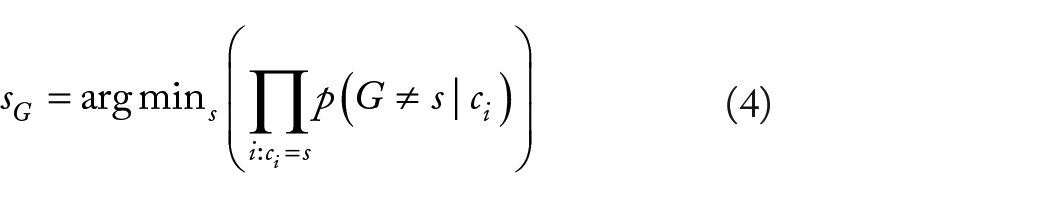
Variation calling is the most common way of distinguishing replacements and indels in the sequencing information contrasted with a reference genome. For the most part, this errand is not guaranteed to be straight-advanced: For instance, the sequencing information could start from a diploid genome, so there may be 2 variations for each situation because of heterozygosity. For our situation, we dissect a viral genome, so we expect just a single variation, which makes the test a lot more straightforward. Sophisticated variation calling techniques might consider a ton of variables, for example, expected GC content and error rates, to handle the issue of incorrect base calls from the sequencer. Considering a solitary grouping area on the genome, we are keen on tracking down the most plausible base from the sequencing information, or as such the base that is least the consequence of a sequencing mistake. For a symbol (base) s ϵ {A, C, G, T}, the likelihood P of having a genotype G ≠ s reliant upon all base calls ci is relative to the result of the error probabilities for each base call on the grounds that each base call is viewed as an autonomous occasion:

The proportionality rather than uniformity applies here, as this equation disregards base calls where ci ≠ s, as these cases do not affect which base is generally likely.
As we consider the base that is least the consequence of a sequencing mistake as most plausible genotype, we really want to find sG, where
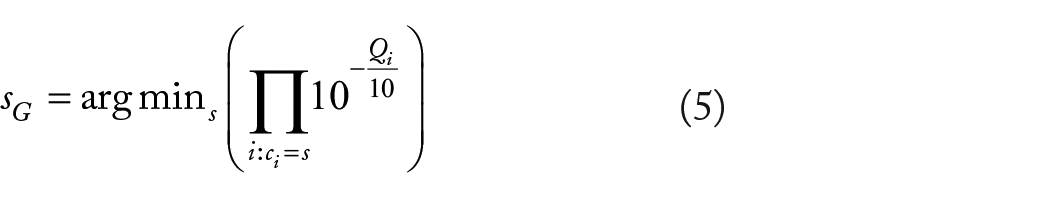
We can replace the base call error probability p(G ≠ s|ci), as it is given by the Phred score:
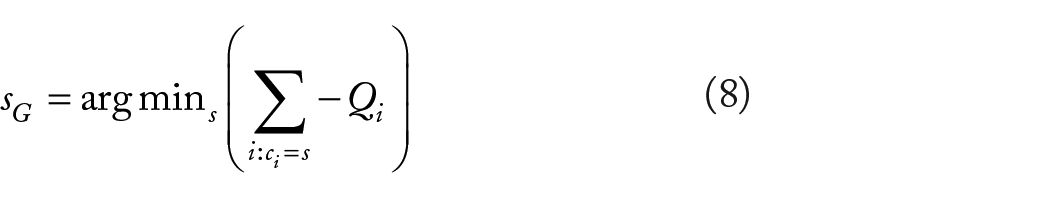
To simplify this equation, we can take the logarithm of the product on the right expression, as the logarithm is a monotonic function:


Results
Analyzing the whole genome sequences has a very prominent role in bioinformatics. But understanding the quality of data being generated by different sequencing techniques is important to exploit the data for information. Exploratory data analysis of the genome sequences of different variants of SARS-CoV-2 revealed the quality, read mapping, and variant calling qualities for alpha (B.1.1.7), gamma (P.1), and omicron (B.1.1.529) variants (Figure 2).

3D representation of SARS-CoV-2. The upper panel (A) shows the trimeric structure of the viral surface glycoprotein with 3 chains. The lower panel (B) shows the single chain of the 3 variants with key characteristic mutations (highlighted in magenta color). SARS-CoV-2 indicates severe acute respiratory syndrome coronavirus 2.
Phred score
Analyzing the quality of the sequence reads shows that majority of the read length is longer than 1 kb (Figure 3A and B). But in the case of gamma variant (Figure 3C), the sequence read length varies greatly as compared with the other 2 variants. This is great advantage of the sequencing technology especially for the de novo genome assembly because longer read sequences facilitate the process. But if we look at the Phred score for the sequences, majority of them shows a value higher than 15 to 20 depicting that the base call error probability is higher for these sequences (Figure 3A to C). This becomes more evident if we plot the histogram for the Phred score. The low accuracy turns out to be much more noticeable, while making a histogram over quality scores of individual bases, rather than averaging the scores over each perused (Figure 3A to C right panel). Alternatively, we could avoid or manage peruses with extraordinarily low Phred scores. 6 In any case, rather we depend on a high sequencing profundity to sift through mistaken base calls.

Sequence quality analysis. The upper panel in A, B, and C represents the read length vs the number of reads showing that majority of reads are above 1 kb size in case of alpha and omicron. The lower panel in A, B, and C shows the Phred score vs number of reads showing that for all the 3 variants the Phred score is not the optimal value. The right panel represents the histogram of Phred score showing that for all the 3 variants the base call accuracy is low. We rely on high sequencing depth to filter out the erroneous base calls.
Read mapping
Mapping each read to its position with respect to the reference genome shows the accurate mapping of all the variant sequence with reference genome (Figure 4A, C, and E). There are certain reads that fall apart from the diagonal depicting a wrong positioning of the read. This activity is very pronounced in omicron variant as compared with other variants (Figure 4E). Once the mapping is finished, we visualize the output reads. The output shows a very clear mapping of the variant genome with respect to the reference genome (Figure 5A to C).

Mapping the variants with respect to reference genome. (A, C, and E) The diagonal shows the reference genome and the blue patches show the read maps of the respective variants with reference genome. The blue patches in the empty space are the reads that are characterized to be at the wrong place. (B, D, and F) The pattern of sequencing depth shows that in alpha and omicron variant, the range of nucleotides is more or less stable. But for gamma variant, the number of nucleotides contribution fluctuates.

Visualizing the read maps. Read mapping of (A) alpha variant, (B) gamma variant, and (C) omicron variant. (A, B, and C) The read mapping shows the gamma and omicron variants’ mapping to be more curated than the alpha variant’s mapping.
Variant calling
Once the analysis was done, the Phred score sum was overlapped with the sequencing depth to further confirm the sequencing quality and the output generated by the sequencer (Figure 4B, D, and F). For alpha and omicron variants, the analysis revealed the sequencing to be more or less stable (Figure 4B and F) and equal to the Phred score sum. But for the gamma variant, the sequencing depth was erroneous as is evident from Figure 4D. This pattern suggests the number of nucleotide participation for a particular region is more equalized for alpha and omicron variants. But for the gamma variant, this participation of nucleotides is highly fluctuating.
Sequence identity and mutation localization
The final aspect of sequence analysis involves finding the sequence identity and mutation localization. The alpha, gamma, and omicron variants showed 99.76%, 96.72%, and 98.47% sequence similarity, respectively (Figure 6E). Harboring nearly 40 mutations in the surface glycoprotein sequence, the omicron variant had a sequence identity which was more than the gamma variant. This might be possible due to the high variability in other regions of the gamma variants such as open reading frames (ORFs) and non-structural proteins (NSPs). To analyze the lower sequence identity in the gamma variant, we calculated the mutational localization with respect to reference genome. The result showed the high amount of variability in the gamma variant sequence with respect to the reference genome (Figure 6B). This high variability occurs throughout the different proteins of the virus. But the amount of variability is more or less conserved in alpha and omicron variants (Figure 6A and C). This result can be account for the less virulence of the gamma variant as it was too diverged from its ancestor SARS-CoV-2. On the contrary, the alpha variant shows a very high conservation of the regions with slight variations arising in the surface glycoprotein (S protein) and nucleocapsid protein (N protein) regions (Figure 6A). This analysis can prove beneficial to identify the regions being extremely diverged or conserved to design the drug and identify drug targets. Omicron variant showed an intermediate divergence with respect to reference genome with a high amount of divergence occurring in the S and N proteins making up for the near 40 mutations occurring in the surface glycoprotein.

Sequence divergence/similarity and mutational localization. (A) to (C) represent the mutational localization in different regions of the respective variants. The high amount of variability can be observed in the gamma variant as compared with the alpha and omicron variants. The alpha and omicron variants show divergence mainly in the surface glycoprotein and the nucleocapsid protein region. (D) Frequency plot of amino acids for different variants with respect to reference sequence. The amino acid frequency is almost similar for both alpha and omicron variants. But, on the contrary, for the gamma variant, the frequency of leucine is very high compared with the reference genome. (E) The alpha, gamma, and omicron variants showed 99.76%, 96.72%, and 98.47% sequence similarity, respectively, with the reference genome. SARS-CoV-2 indicates severe acute respiratory syndrome coronavirus 2.
To further understand the variability of these variants with respect to the reference genome, we calculated the amino acid frequency and compared it with reference genome (Figure 6D). Gamma variant shows a higher variability in leucine frequency compared with other variants. Leucine and serine comprises a large amount in protein sequence. Further investigation into specific proteins might reveal the changes in the structural integrity of the protein with accumulation of mutations.
Conclusions
With the advent of genome sequencing technologies, we are surrounded by the huge data set available for different species, from bacteria to virus to humans. But we need a pipeline to analyze the data generated by the sequencers to use the data for predictive modeling and conclusion. We demonstrated the need for an EDA of the whole genome sequences of SARS-CoV-2 and its different VOCs available. The analysis revealed the quality of the sequencing reads generated by the sequencers. The genome sequences of all variants possess a Phred score which depicts that the read sequences have an average rate of classification of the correct positions. Moreover, the read mapping and sequencing depth reveals the role of nucleotide positioning in certain regions being important for the virulence of the virus. The higher genomic-level variability in the gamma variant as compared with other VOCs necessitates the importance of an EDA in viral genome analysis to analyze sequence variability and evolutionary divergence of the viral sequences with respect to the reference genome. With a higher variability in the gamma variant, we analyzed the frequency of the amino acid and mutational localization which shows the higher abundance of certain amino acids in gamma variants than other VOCs. This analysis can be further explored to understand the role of specific amino acids in certain regions, such as surface glycoprotein and nucleocapsid regions, to understand the importance of mutations in the virulence and structural stability of the viral proteins.
The current pipeline, presenting a simplistic way to perform EDA for biological sequences, also has a minor drawback. The read mapping step in the pipeline requires a good computational power for sequence which are more complex and larger in data size. One solution that we propose to deal with this drawback is to use the multiprocessing architecture and submit the job on multiple cores to speed up the process. Even having a computational drawback, the current pipeline allows the user to explore and analyze the different sequences for biological explorations.
Footnotes
Funding:
The author(s) received no financial support for the research, authorship, and/or publication of this article.
Declaration of Conflicting Interests:
The author(s) declared no potential conflicts of interest with respect to the research, authorship, and/or publication of this article.
Author Contributions
SS and AK formalized the concept, performed the analysis, and wrote the manuscript.