
Abstract
High-throughput transcriptomics has advanced through the introduction of TempO-seq, a targeted alternative to traditional RNA-seq. TempO-seq platforms use 50 nucleotide probes, each specifically designed to target a known transcript, thus allowing for reduced sequencing depth per sample compared with RNA-seq without compromising the accuracy of results. Thus far, studies using the TempO-seq method have relied on existing tools for processing the resulting short read data. However, these tools were originally designed for other data types. While they have been used for processing of early TempO-seq data, they have not been systematically assessed for accuracy or compared to determine an optimal framework for processing and analyzing TempO-seq data. In this work, we re-analyze several publicly available TempO-seq data sets covering a range of experimental designs and use corresponding RNA-seq data sets as a gold standard to rigorously assess accuracy at multiple levels. We compare 6 aligners and 5 normalization methods across various accuracy and performance metrics. Our results demonstrate the overall robust accuracy of the TempO-seq platform, independent of data processing methods. Complex aligners and advanced normalization methods do not appear to have any general advantage over simpler methods when it comes to analyzing TempO-seq data. The reduced complexity of the sequencing space, and the fact that TempO-seq probes are all equal length, appears to reduce the need for elaborate bioinformatic or statistical methods used to address these factors in RNA-seq data.
Introduction
TempO-seq has emerged as a targeted alternative to traditional RNA-seq that is more amenable to high-throughput transcriptomics, 1 particularly for applications in Toxicogenomics.2,3 TempO-seq relies on next-generation sequencing platforms and ultimately generates short read data which must be processed and quality assessed much like other technologies using this platform, including critical analysis steps such as read alignment and normalization of raw read counts across samples of varying depth and quality. Thus far, studies using the TempO-seq method have relied on existing tools for processing the resulting short read data. However, these tools were originally designed for other experiment types and in some cases may not be suitable or optimal for this specific use case. To date, there has been no systematic comparison of these methods specifically for TempO-seq data analysis, or investigation of the impact of these analysis choices on the overall accuracy of the results.
A key difference between TempO-seq and RNA-seq is that TempO-seq uses 50 nucleotide probes which are designed to specifically target a known transcript. These 50 nucleotide sequences are ultimately what are amplified and sequenced in a TempO-seq experiment, which reduces the depth of sequencing needed per sample to obtain accurate results. Furthermore, a TempO-seq experiment typically uses anywhere from ~3000 probes designed to maximally cover known pathways and correlated expression modules 4 to ~20 000 probes designed to cover the majority of known coding genes in the human genome. 1 Thus, raw short read data from a TempO-seq experiment differs from standard RNA-seq data set in both the complexity of the sequence space (in theory, reads need only be aligned to the collection of 50 bp probe sequences used in the experiment with no consideration for gaps or splicing) and the number of features for which read counts need to be computed and normalized (~3000-20 000 features of uniform length, rather than > 50 000 possible transcripts and isoforms of variable length as seen in RNA-seq). These design factors may have an impact on the choice of appropriate alignment algorithm, normalization method, and parameters used to compute expression and fold-change estimates from TempO-seq data, but these choices have yet to be systematically explored.
In this work, we re-analyze several publicly available TempO-seq data sets covering a range of experimental designs, and use corresponding RNA-seq data sets as a gold standard to rigorously assess accuracy at multiple levels (Table 1). We adapt 6 different short read aligners, which vary widely in the underlying algorithm design and intended use cases, to the analysis of TempO-seq data. For each aligner, we also identify critical parameter adjustments that must be made to ensure reliable performance for this data type. We then further explore the impact of normalization methods on the accuracy of differential expression estimates from this platform. Our findings provide important justification for the choice of both alignment and normalization method used for TempO-seq data and lay out a general framework that can be used to expand this assessment as additional appropriate data sets and analysis methods become available.
Public data sets used for benchmarking analysis.

Abbreviations: GEO, Gene Expression Omnibus; SRA, Sequence Read Archive.
Table of all data sets used for benchmarking analysis of TempO-seq processing methods, including references to associated manuscripts, and accessions for source data in both Gene Expression Omnibus (GEO) and Sequence Read Archive (SRA).
Materials and Methods
Obtaining publicly available data sets
Table 1 provides a listing of all public data sets used with references and data repository accessions. Gene-level read counts for all RNA-seq samples from Yeakley et al 1 were obtained from processed data in GEO (GSE91395). All other RNA-seq and TempO-seq raw read data were downloaded from the Sequence Read Archive (SRA) and extracted to fastq format using the SRA toolkit v2.8.2-1 (https://www.ncbi.nlm.nih.gov/sra/docs/toolkitsoft/).
Previous analysis of the SEQC RNA-seq data 5 identified 1 sample (RNA ID = 98912) originally labeled as a carbon tetrachloride–treated liver that was revealed to be a sample mix-up. This sample was excluded from the RNA-seq data deposited in public repositories. We excluded the corresponding sample from the published TempO-seq data to keep the data sets comparable.
Alignment of reads to probe indexes
A defining feature of the TempO-seq method is the use of pre-designed probes targeted to specific 50 bp regions of known genes. 1 These probes are initially synthesized as 25 bp half-probes combined with template sequences needed for amplification and sequencing. When a TempO-seq probe library is mixed with a cell lysate or purified RNA sample, the half-probes hybridize to the endogenous RNA target sequence. Chemical ligation then joins half-probes that are hybridized in close proximity on the same target RNA, resulting in a complete probe sequence consisting of the 50 bp target sequence flanked by the Illumina template sequences. The rate of half-probe ligation reflects the relative concentration of the target RNA in the sample, and only the full probes resulting from ligation are amplified and sequenced in the final library. Thus, the relative count of 50 bp reads aligned to probe sequences from each gene is proportional to the relative concentration of the target RNA in the sample.
TempO-seq reads in single-end fastq format were aligned to corresponding probe sequences (rat S1500 + in Supplemental Table 1, human whole transcriptome in Yeakley et al 1 ) using each of the following aligners and additional parameters:
Bowtie v1.2.2 7 with the following additional alignment parameters: “-v 3 -k 10 m 10 --best --strata --trim3 1.” This configuration allows up to 3 mismatches (the maximum allowed for bowtie) and reports up to 10 multiple alignments per read when they are of equal quality. Only uniquely aligned reads were included in the probe-level read counts from this aligner. The “--trim3 1” parameter is included because some of the data sets used have read length = 51 bp, and bowtie will fail to align these reads to the 50 bp known probe sequences otherwise.
Bowtie2 v2.3.0 8 with the following additional alignment parameters: “--end-to-end -k 10.” This configuration enforces full-length alignment of the complete 50 bp probe sequence (no soft-clipping of reads), and reports up to 10 multiple alignments per read when they are of equal quality. Bowtie2 could align the 51 bp reads to the appropriate gene and hence "trim 3 1" was not used with Bowtie2. Only uniquely aligned reads with at least 40 matching bases were included in the probe-level read counts from this aligner.
Hisat2 v2.1.09,10 with the following additional parameters: “--dta --no-spliced-alignment --trim3 1.” This parameter configuration keeps memory usage low (“--dta”), disables spliced alignments from being reported (“--no-spliced-alignment”), and correctly handles the data sets that have read length = 51 bp (“--trim3 1”). This configuration has been used previously for high-throughput TempO-seq data alignment 11 and was chosen here to remain consistent with the previous work. By default, hisat2 reports multiple alignments per read when they are of equal quality. Only uniquely aligned reads with at least 40 matching bases were included in the probe-level read counts from this aligner.
Kallisto v0.44.0 12 with the following additional alignment parameters: “--single -l 50 -s 1 --single-overhang --bias”. These parameters configure Kallisto for single-end reads of known length (50 bp). Probe-level raw read counts were output directly by Kallisto.
Subread v1.5.1 13 with the following additional alignment parameters: “-n 33 --DPGapExt -1 -B 10 --sv.” Subread index construction was performed with the “-F” option to construct a full index with 16 bp subreads at every position of the reference sequences (which in this case consists only of the known probe sequences, not the entire genome). The alignment configuration used here matches all possible subreads (rather than sparsely sampled subreads), penalizes gapped alignments, reports up to 10 equally good alignments per read, and also allows chimeric alignments. Only those reads that uniquely aligned to at least 40 matching bases of a single probe were included in the probe-level read counts from this aligner. Remaining reads were categorized as either chimeric (based on the extended SAM tags used by Subread to denote chimeric alignments), multiply aligned (reported with 2 or more nonchimeric alignments), or unaligned (no alignment reported).
STAR v2.5.2b 14 via the “Temposeqcount” pipeline. 15 Probe-level read counts were output directly by this pipeline.
Note that Bowtie was developed to handle ungapped full-length alignments, while Bowtie2 was developed to support both full-length and local alignments, with or without gaps. Due to these differences, not all alignment parameters are available for both aligners. The “--end-to-end” parameter was used with Bowtie2 to force full-length alignments. “-v 3” was used for Bowtie to allow at most 3 mismatches. Bowtie2 uses a scoring function calculated using the match/mismatch/gap scores to consider an alignment “valid” (http://bowtie-bio.sourceforge.net/manual.shtml; http://bowtie-bio.sourceforge.net/bowtie2/manual.shtml). We have used the default Bowtie2 scoring options. “--best” and “--strata” make Bowtie guarantee that reported alignments are optimal in terms of the number of mismatches and/or quality values. Bowtie2 does not have any equivalent of Bowtie’s “--best” or “--strata” options. Given that Bowtie and Bowtie2 were developed at different times with slightly different goals, the two aligners do differ in available parameter choices, and hence, in their implementation in this work.
Alignment of SEQC RNA-seq data
Rat transcriptome sequences were downloaded from RefSeq in fasta format on March 27, 2018. In addition, 17 sequences corresponding to deprecated gene models from the S1500+ platform (Supplemental Table 2) were included to ensure maximum overlap between the RNA-seq and TempO-seq gene IDs. Raw paired-end RNA-seq data in fastq format was aligned to the rat transcriptome using Kallisto v0.44.012 to obtain transcript-level read counts. Transcript-level read counts were then condensed to gene-level read counts by summing the read counts for all transcripts mapping to the same Entrez gene ID.
Normalization of raw read counts
Raw read counts for both TempO-seq and RNA-seq data were normalized across samples by each of the following methods:
RPM: Simple reads per million (RPM) normalization = xi, j * 106 / Nj, where Nj is the total number of uniquely aligned reads in sample j.
QNorm: Simple RPM normalization followed by quantile normalization using the normalize.quantiles function in preprocessCore v1.36. 16
DESeq2: Normalization using the estimateSizeFactors and fpm functions in DESeq2 package v1.14.1 with default parameters17,18 and default size factor estimation used in the fpm function.
GMPR: DESeq2 fpm normalization with size factors computed using the GMPR method. 19 Author’s source code for implementing the GMPR method was downloaded from github.com/jchen1981/GMPR on December 14, 2018.
DESeq2+: A revised version of DESeq2 fpm normalization. 19 In this approach, the size factors are computed by adding 1 to all counts to ensure that the geometric mean is defined for all genes/probes.
All normalizations methods above produce normalized values that can be interpreted as reads/features per million. For all normalization methods above, these values were further transformed as to log2 scale with pseudo-count = log2(X + 1).
Identification of differentially expressed genes
Differentially expressed genes were determined based on log2 normalized read counts (alternate methods described above) using student’s t-test. Differentially expressed genes were called as having P ⩽ .001 and absolute fold-change ⩾ 1.5. Differential expression analysis was performed independently for each chemical treatment and corresponding controls in the SEQC data set. For the small number of genes with multiple corresponding TempO-seq probes, differential expression analysis was performed at the probe level, and each gene was called as differentially expressed if any of the corresponding probes passed the significance and fold-change thresholds noted above. When multiple probes for the same gene passed these thresholds, the probe with the highest absolute fold-change was used to represent the gene.
Assessment of TempO-seq accuracy
When comparable RNA-seq data was available, it was used as the “gold standard” for assessing the accuracy of TempO-seq data. For the cell type comparison data in Yeakley et al, 1 there is no correspondence between individual replicates, but the fold-changes and DEG calls between the two cell types can be compared. For the Yeakley titration experiments, the highest input concentration was treated as the “gold standard.” For the SEQC data, we compared only the samples that were common to both platforms. For both data sets, gene IDs were mapped to current NCBI Entrez IDs, and we computed all accuracy metrics based solely on genes that are common to both platforms.
We assessed the accuracy of corresponding log2 normalized expression values and/or log2 fold-change values by Pearson correlation coefficient (PCC). For the downsampled results, we also compared log2 fold-change values to gold standards using mean squared error (MSE), calculated as:
where X and Y correspond to vectors of corresponding log2 expression or fold-change values from TempO-seq and gold standard respectively. DEG calls were summarized as values of 0, 1, –1, indicating nonsignificance, upregulation, and downregulation, respectively. We assessed the accuracy of DEG calls by Matthews correlation coefficient (MCC).20,21
Downsampling of probe-level read count data
The SEQC data aligned using Bowtie was downsampled to each target depth of N total uniquely aligned reads per sample as follows: For each sample j, a vector Tj of probe IDs was generated such that the ID for probe i appears xij times in vector Tj, where xij is the number of reads from sample j uniquely aligned to probe i. Vector Sj was then generated by sampling without replacement N probe IDs from vector Tj, and the read counts for the downsampled version of sample j are computed as the sum of occurrences of each probe ID i in vector Sj.
This procedure is equivalent to randomly sampling N reads from the original fastq file and re-running the alignment and read-counting process, because the alignment of each read is independent and the only thing that changes with downsampling is which subset of reads get counted. However, this approach is computationally more efficient, as it does not require re-running the entire alignment process multiple times on redundant subsets of the data, and has the advantage of downsampling to a target number of uniquely aligned reads, which is the more meaningful metric of sample depth for TempO-seq.
We repeated the downsampling procedure on all SEQC TempO-seq samples on values of N from 100 K to 1M, at every iteration of 100 K reads. Downsampling and complete accuracy analysis was repeated independently 5 times on each value of N.
Results
Multiple types of alignment algorithms produce highly correlated TempO-seq expression estimates
In theory, the alignment problem for TempO-seq data is greatly simplified from that of RNA-seq or even DNA-seq. Short reads need only be aligned to the collection of 50 bp probe sequences on the target platform, as opposed to the complete transcriptome or genome for the organism of study. Additional complications such as splicing, indels, and single nucleotide variation (SNVs) do not need to be considered. The initial publication introducing the TempO-seq method 1 used the Bowtie algorithm, 7 which was designed to align short single-end reads to a genome or transcriptome without considering splicing, larger indels, or other types of variation, to complete this alignment task. An alternative pipeline has been proposed 15 for TempO-seq analysis using the STAR alignment algorithm, 14 which was originally designed to align RNA-seq data while handling potentially longer reads and allowing the discovery of novel splice junctions.
Although we did not perform a systematic comparison of all possible parameter combinations for all algorithms—some aligners tested have a large number of parameter choices, but most are unlikely to be relevant to this particular application—we do note that several parameters are critical for effectively applying certain aligners to TempO-seq. In general, we set parameters to require full-length alignment of probe sequences to prevent alignment of spurious ligation products or other sequencing artifacts. Another alignment issue is that some reported TempO-seq data sets have read lengths of 51 bp, despite the fact that the intended probe sequences are 50 bp. This likely results from an extra cycle of sequencing that picks up the beginning of the template sequence flanking the primary target sequence. In these cases, some aligners, such as Bowtie, failed to align any reads that were longer than the probe sequences used to construct the index (no soft-clipping allowed). The simple solution to this was to trim the TempO-seq reads to the expected length before alignment, which Bowtie1 can do when specific parameters are set (see methods). For the STAR aligner, we used the exact set of parameters specified by House et al 15 as part of the “Temposeqcount” pipeline.
We identified several publicly available TempO-seq data sets and processed the raw read files (fastq format) with 6 different open-source alignment tools that varied in both their fundamental algorithmic designs and their originally intended use cases. Each of the data sets analyzed here (SEQC and Yeakley cell type comparison) has a corresponding RNA-seq data set which was used as a “gold standard” for computing accuracy. For each TempO-seq data set we compared overall alignment rates, computed correlation of the read counts resulting from each aligner, and computed the accuracy of log2 fold-changes resulting from each aligner as compared with gold-standard data (Figure 1).

Comparison of alignment algorithms on TempO-seq data. Boxplot summarizing percentage of reads uniquely aligned to a single probe for each sample by each aligner for Human Whole Transcriptome TempO-seq data of 2 cell types from Yeakley et al (A) and Rat S1500+ TempO-seq data of chemically exposed liver samples from SEQC (B). Pearson correlation coefficient of raw read counts across all samples for each pair of aligners are shown for Yeakley et al data (C) and SEQC data (D). Log2 fold-changes for each gene across the 2 cell-types in Yeakley et al were computed from TempO-seq data, then correlated against comparable expression measured by RNA-seq (E). Log2 fold-changes for each chemical exposure in SEQC rat livers were computed from TempO-seq data, then correlated against matching treatment effects measured by RNA-seq (F).
All algorithms used were able to uniquely align >90% of the reads to a known probe sequence for most of the samples analyzed (Figure 1A and B). Despite the variation in overall unique alignment rate, we found that the aligners we tested produced read counts that were highly correlated across probes and sample (Figure 1C and D). For both the platform comparison data set 1 and the SEQC TempO-seq data set, 6 Pearson correlation coefficients exceeded 0.99 for all pairs of aligners.
Finally, we normalized the counts to the total uniquely aligned reads in each sample using the simple RPM method and compared the accuracy of log2 fold-changes estimated from each aligner compared with gold-standard RNA-seq results (Figure 1E and F). We found that for each data set, log2 fold-change estimates were highly correlated (Pearson correlation coefficient > 0.8) between the two platforms, with the choice of aligner showing very minimal impact on overall accuracy. Thus, the moderate variation in overall alignment rate does not impact the accuracy of the results at the level of fold-change estimation.
TempO-seq alignment rate and accuracy depend on sample quality
The data published by Yeakley et al 1 also include two titration experiments, one using a single type of cell lysate and the other using a universal reference RNA (URR) mixture. In each experiment, the starting material is diluted multiple times and profiled by TempO-seq in triplicate, producing a final data set spanning several orders of magnitude in terms of the amount of input material. These data were used in the original publication to identify a cutoff for optimal input concentration for the TempO-seq platform. Here, we use this data to explore the relationship between the magnitude of input material dilution and features of the per-sample alignment results, such as unique alignment rate and the occurrence of chimeric alignments—a relationship that may be missed in the analysis above due to the large amount of input material used to generate those data sets.
First, we noted that samples with extremely low or no input can still produce >500 K total sequenced reads (Figure 2A and B), but the vast majority of these do not produce unique full-length alignments to the target probe sequences (Figure 2C and D), suggesting that unique alignment rate may be a useful indicator of overall sample quality. In the TempO-seq assay, spurious ligation may occur between nonmatching half-probes, but the resulting reads should be a negligible part of the overall library that is produced when sufficient input material is used. However, when input material is below optimal levels, as in the diluted samples analyzed here, spurious ligation products may constitute a higher percentage of the overall reads. These spurious ligation products should result in reads that produce chimeric alignments to the known probe library and thus fail to uniquely align to a single probe under the stringent alignment criteria used here. The Subread algorithm 13 is designed to specifically detect and report chimeric alignments in addition to standard unique alignments, and this algorithm detected a substantially higher percentage (>10%) of reads with chimeric alignments from the samples with very low input concentrations (Figure 2E and F).

Alignment rate and accuracy depend on sample quality. Stripcharts summarizing: Total sequenced reads for cell lysate titration experiment with replicates grouped by input cell count (A) and for URR titration experiment with replicates grouped by input concentration in μM (B); Percentage of reads uniquely aligned to a single probe by each alignment algorithm for each input amount in cell lysate titration experiment (C) and URR titration experiment (D); Percentage of chimeric probe sequences detected by each alignment algorithm for each input amount in cell lysate titration experiment (E) and URR titration experiment (F); Pearson correlation coefficient of normalized (RPM) probe expression profile for each titrated replicate versus the average of all nontitrated samples for cell lysate titration experiment (G) and URR titration experiment (H). Abbreviation: URR, universal reference RNA.
We also computed the accuracy of each aligner in the titration experiments from Yeakley et al. 1 Here, we normalized the probe-level read counts in each sample using the simple RPM method and computed the correlation coefficient of each individual titrated sample expression profile against the average of all nontitrated samples (Figure 2G and H). As the titrated samples are expected to have the same normalized expression profile as the nontitrated samples, this provides a proxy for sample accuracy as a function of decreasing sample input material. Here, we found that accuracy generally degrades with sample input RNA concentration, but some aligners were more sensitive to this reduction. In particular, Subread had lower accuracy on samples with input concentration reduced 100x or 1000x, compared with the other aligners, although differences between aligners for each input concentration were always smaller than the overall differences between input concentrations.
Simple read depth normalization is sufficient for TempO-seq
Transcriptome sequencing experiments of any type are typically first quantified by counting the reads that are aligned to the features of interest (typically genes or isoforms). However, raw feature-level read counts are highly dependent on the overall number of reads sequenced and successfully aligned (often called “read depth” or “sequencing depth” of the sample). The read depth of a sample depends on both controlled and uncontrolled factors such as the quality of the sequencing library preparation, the specific sequencing platform used, and the number of samples multiplexed per sequencing run. If the same sample is sequenced twice, but the second sequencing run produces double the number of aligned reads as the first run, then each gene-level read count would be expected to roughly double on average. Thus, to compare expression estimates across samples with variable read depth, it is necessary to normalize read counts for this experimental factor.
The simplest approach to this normalization is to compute “reads per million” (RPM), alternatively called “counts per million” (CPM) or “features per million” (FPM)—this is the number of reads expected to align to the gene or other expression feature per 1 million reads, and is computed as xij = rij * 106 / Nj, where rij is the number of reads aligned to feature i in sample j and Nj is the total number of aligned reads for the whole sample. Previous work on RNA-seq normalization has found that transcriptome complexity can vary from sample to sample, in terms of both the number of expressed features and the distribution of reads across those features. Thus, multiple methods17,22 have been proposed to compute appropriate “size factors” that adjust for differences in both read depth and overall sample complexity. However, the use of these methods has not been tested specifically on TempO-seq data.
Here, we tested simple RPM normalization as described earlier, quantile normalization of RPM values (widely used in the microarray field), and several alternative methods for computing size factors, which we then applied with the DESeq2 package available in BioConductor. 18 All normalized counts xij were then transformed to log2(xij + 1) to obtain log-scale counts with a minimum transformed value of 0. We applied each normalization method to both TempO-seq and corresponding RNA-seq data, and compared the correlation of log2 fold-changes for all genes and comparisons. We also identified differentially expressed genes (DEGs) on each platform as those with a student’s t-test P ⩽ .001 and absolute fold-change ⩾ 1.5, and compared the accuracy of these calls using MCC.
We found that for high-quality data sets, the choice of normalization method did not have a substantial impact on the overall accuracy of the log2 fold-changes (Figure 3A and B) or differential expression calls (Figure 3C and D). Notably, accuracy varied slightly more between normalization methods than between aligners, indicating that normalization method has a larger impact on accuracy than alignment method, but the differences in accuracy between normalization methods were still negligible. We also note that most differences in accuracy were not consistent across the 2 data sets, eg, normalization methods that slightly overperformed relative to others on 1 data set were observed to underperform on the other data set. For example, QNorm has the highest Matthews correlation in the Yeakley et al data set but the second lowest Matthews correlation for the SEQC data (Figure 3 C and D). The one exception to this is the “DESeq2+” method, which incorporates pseudo-counts in the size factor estimation to use all features 19 and underperformed all other methods tested here. Overall, our current results support the use of simple RPM normalization on high quality data sets. More advanced methods add more computational and statistical complexity without a consistent or substantive gain in accuracy.

Comparison of normalization method accuracy using RNA-seq as gold standard. Bar charts summarizing: Pearson correlation coefficient (PCC) of the log2 MDA/MCF-7 fold-changes for the TempO-seq and RNA-seq data in Yeakley et al using each of 5 normalization methods (A). Pearson correlation coefficient (PCC) of the log2 fold-changes for each SEQC treatment (based on the global comparison of all gene x treatment combinations) between TempO-seq and RNA-seq (B). Matthews correlation coefficient (MCC) of the identified upregulated and downregulated differentially expressed genes (student’s t-test P ≤ .001 and absolute fold-change ≥ 1.5) for MDA vs MCF-7 cells based on each platform, treating the RNA-seq as gold standard (C). Matthews correlation coefficient (MCC) of DEG calls (student’s t-test P ≤ .001 and absolute fold-change ≥ 1.5) for each treatment in the SEQC data for each platform, treating the RNA-seq as gold standard (D).
We also examined differences in normalization method accuracy on the input titration data sets (Figure 4). Here, we observed clear differences in accuracy as sample input concentration is reduced. In all cases, overall accuracy is reduced with sample input concentration, but our results suggest that quantile normalization consistently produces the most accurate expression estimates from samples with varying depth and quality. Size factors do not produce a substantial improvement in accuracy, and in some cases actually perform worse than simple RPM estimates, at least when used with the normalization method in the standard DESeq2 package.

Comparison of normalization method accuracy on input titration data. Stripcharts summarizing Pearson correlation coefficient of normalized probe expression profile for each titrated replicate versus the average of highest input replicates for each normalization method, based on cell lysate titration experiment (A) and URR titration experiment (B). Abbreviation: URR, universal reference RNA.
Optimal read depth for S1500+ TempO-seq experiments
A critical design choice is what target read depth to aim for per sample, which is directly impacted by the number of samples multiplexed per lane of sequencing on Illumina platforms. The S1500+ TempO-seq probe sets in particular are designed to maximize throughput by reducing the number of measured probes thereby reducing the required read depth per sample. 4 However, no rigorous assessment of required read depth has been performed to date. The published data from the rat S1500+ TempO-seq platform 6 sequenced at least 2.4 million reads per sample, and we found that all samples had >2 million uniquely aligned reads when aligned with Bowtie1. We also noted that the individual chemical treatments in this data set result in a wide variety of total DEGs and mean fold-changes, independent of sample read depth, reflecting a difference in the overall effect size of each treatment (Table 2). We subsequently used this data set to explore the impact of sample read depth on probe coverage and expression accuracy by randomly downsampling the originally sequenced data.
SEQC chemical treatments ordered by effect size.
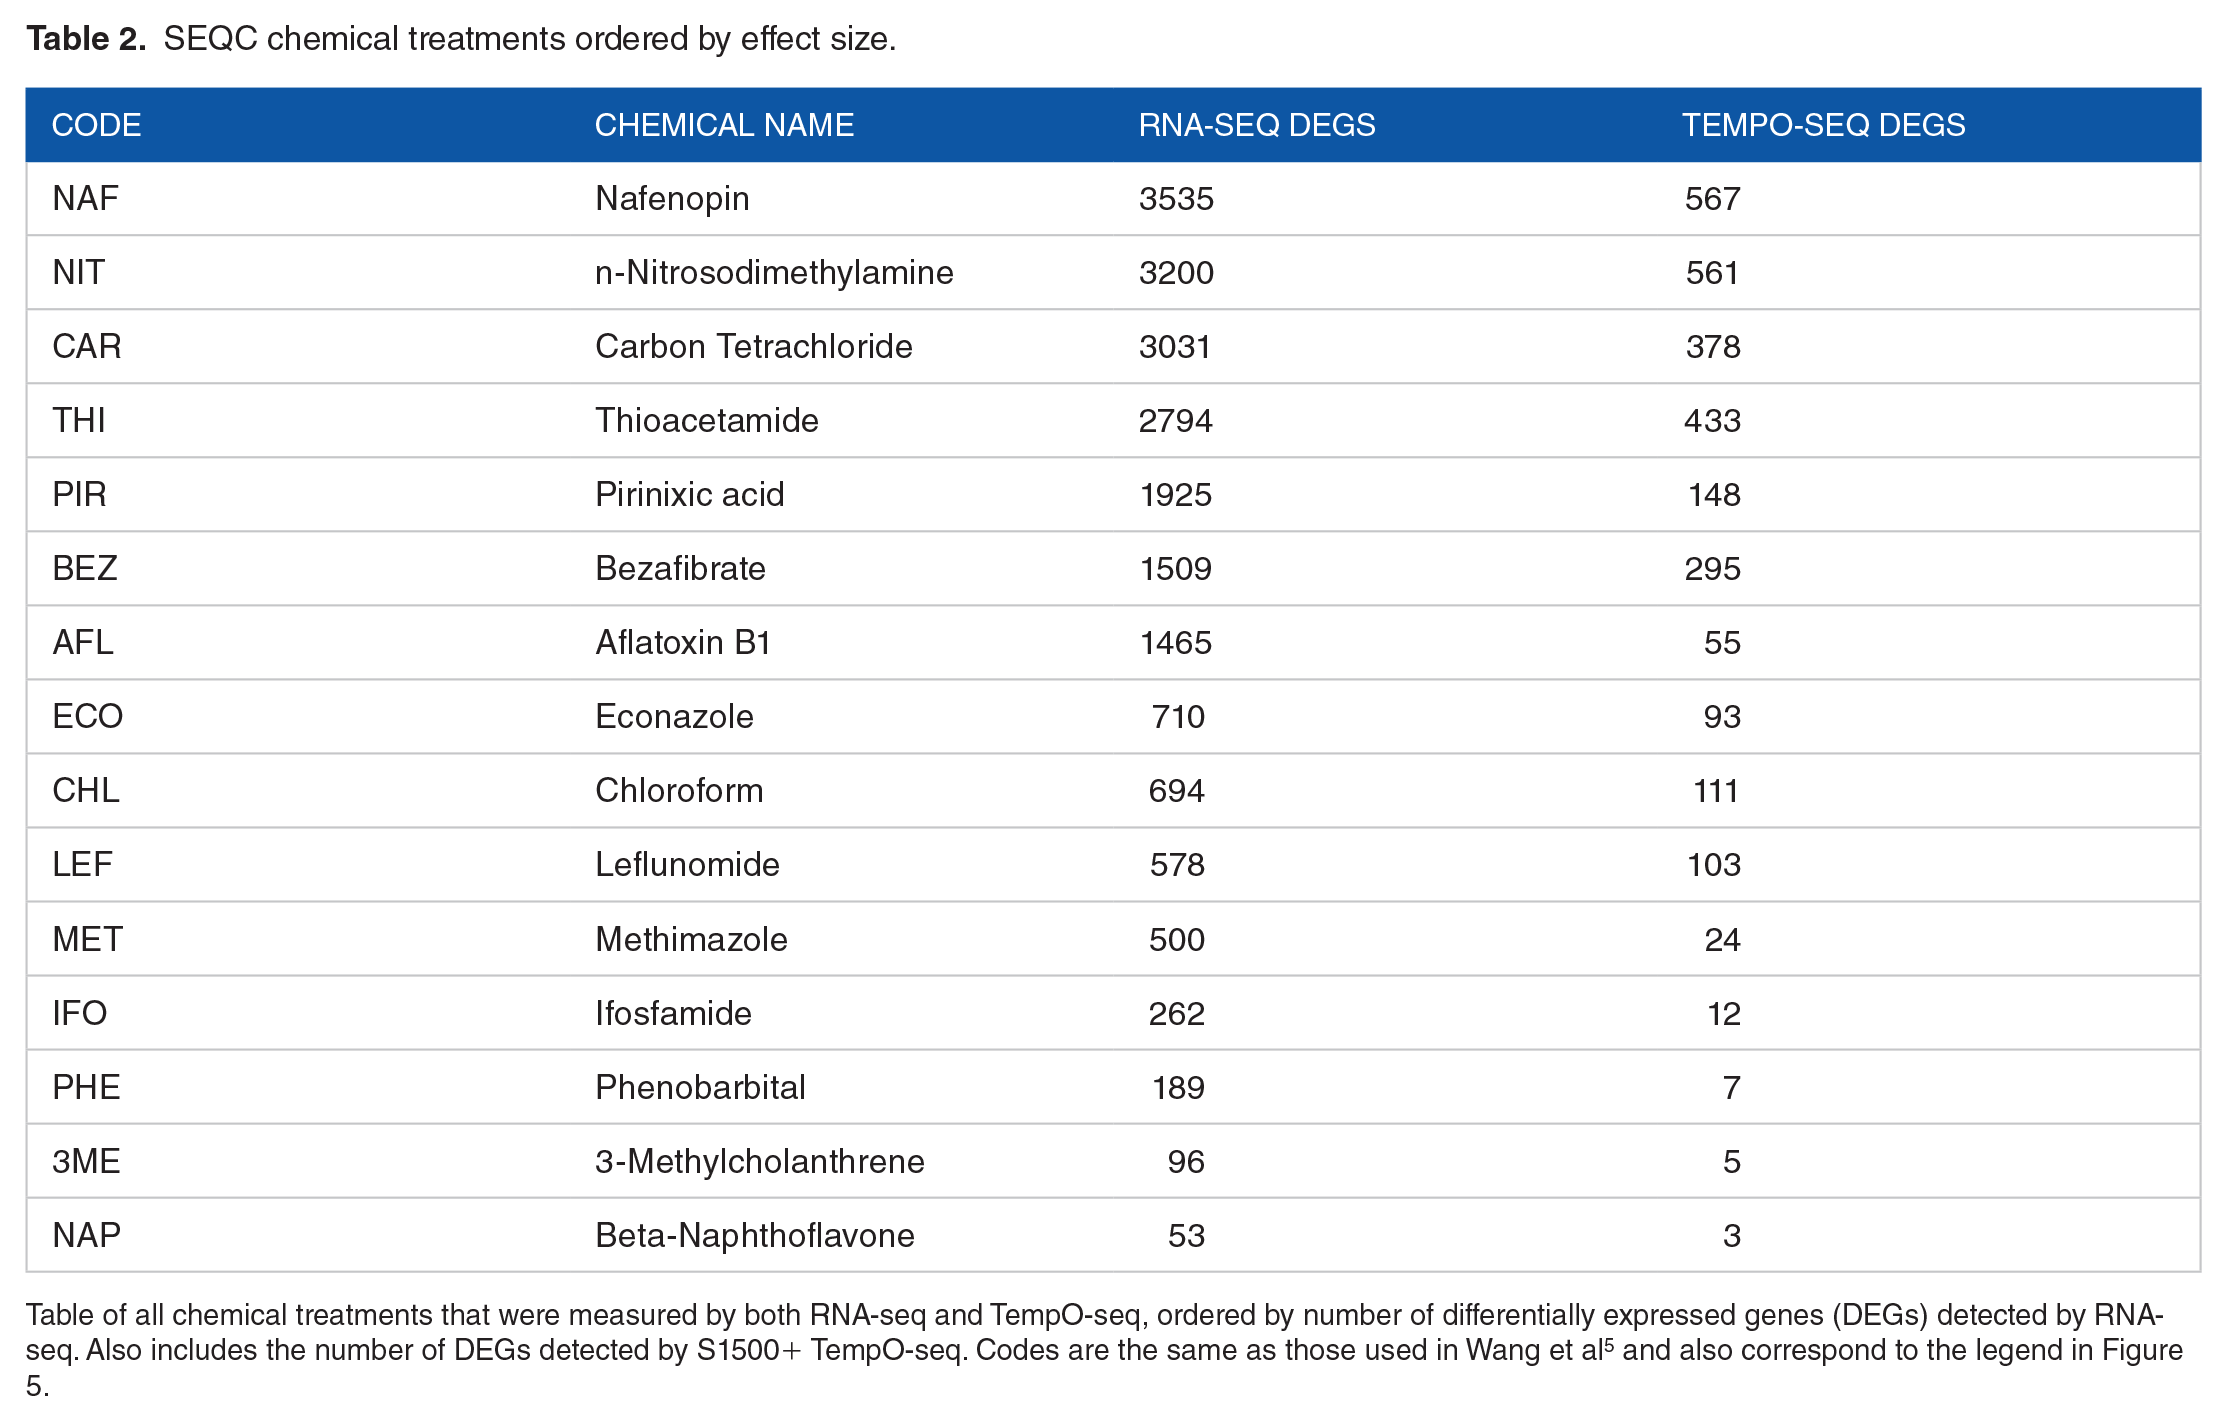
Table of all chemical treatments that were measured by both RNA-seq and TempO-seq, ordered by number of differentially expressed genes (DEGs) detected by RNA-seq. Also includes the number of DEGs detected by S1500+ TempO-seq. Codes are the same as those used in Wang et al 5 and also correspond to the legend in Figure 5.
We first created randomized downsampled versions of the original SEQC TempO-seq data by randomly sampling uniquely aligned reads without replacement from the original data. We generated 5 independent replicates of each sample at each target depth (uniquely aligned reads) of 1M, 900 K, . . ., down to 100 K. We then computed the percentage of probes with read counts ⩾5 as a metric of overall coverage of the probe set (Figure 5A). We found that this probe coverage statistic dropped off precipitously below 500 K uniquely aligned reads.

Impact of read depth on TempO-seq accuracy. (A) Scatter plot showing relationship between read depth and probe coverage, defined here as the percentage of probes with at least 5 reads uniquely aligned. Dark blue dots correspond to original samples with no downsampling. Light blue dots correspond to individual downsampled replicates. Dashed gray line shows loess best-fit curve. (B-D) Accuracy of TempO-seq after downsampling to decreasing numbers of uniquely aligned reads (X axis) for each individual chemical treatment, ordered by effect size (see Table 2). Accuracy metrics on Y axis are either Pearson correlation coefficient (PCC) (B, D) or mean squared residual error (MSRE) (C) of log2 fold-changes in downsampled data vs either the original TempO-seq data (B, C) or the matched RNA-seq data (D). Each dot represents an individual downsampling of the original full data set (all samples). Dashed lines indicate the median accuracy value at each target downsampling depth based on 5 independent runs of the downsampling procedure.
We then examined the impact of reducing read depth on overall accuracy, by comparing with both the RNA-seq gold standard and the original TempO-seq data without random downsampling (Figure 5B to E). Accuracy generally decreased with overall read depth, although the relationship between depth and PCC varies by treatment, with the smallest effect sizes showing the most rapid decline in accuracy. However, mean squared residual error (MSRE) trends were largely independent of treatment, and show a clear general inflection point at 300 K aligned reads.
Discussion
TempO-seq is a relatively new transcriptomic platform that combines advantages of microarray and RNA-seq and promises highly accurate estimates of relative expression at much higher throughput than existing next generation sequencing (NGS) based methods. However, as with all new genomic technologies, it may take several years to establish the experimental, computational, and statistical best practices as a wider variety of data sets are published for rigorous assessment.
In this work, we begin the important process of establishing a framework for rigorous assessment of analysis pipelines and key experimental design factors for TempO-seq. Our results first and foremost demonstrate the generally robust accuracy of the TempO-seq platform, independent of data processing methods. Based on the available data these results appear generalizable across species and experimental designs.
We attribute this overall robustness to the relative simplicity of TempO-seq data—rather than sequencing randomly sheared and variable-length fragments from across the transcriptome, TempO-seq focuses the sequencing task on known 50 bp indicator probes that are unique to each gene. This greatly reduces the space of target sequences to align to and obviates the need to consider indels or splice junctions. As a result, relatively simple alignment algorithms such as Bowtie, are sufficient for the primary task of counting reads from each probe.
When input concentration is reduced (Figure 2), both the rate of uniquely aligned reads and subsequent accuracy (based on PCC against nontitrated samples) degrades for all aligners, and the impact of input concentration on accuracy was generally greater than the choice of aligner used. However, even in these cases, Bowtie appears to achieve similar accuracy compared with aligners currently used for RNA-seq, such as STAR and Kallisto. Subread can be used to align and further examine chimeric reads, which may still be useful for troubleshooting problematic samples, although we did not see any advantage on higher quality data generated from samples with sufficient amount of input material.
We also note that while each aligner tested here produced similar levels of overall accuracy in most cases, many of these aligners have a large set of possible parameters and configurations that may yet impact accuracy and overall reliability. For example, we noted that some TempO-seq data sets include an extra base resulting in 51 reads. Naïve aligners such as Bowtie will not function properly unless this excess base is trimmed prior to alignment, otherwise the aligner will fail to align all reads. Similarly, our enforcement of full-length alignment to probe sequences is critical to avoid counting spurious ligation artifacts, which appear to be rare in high quality samples but can rise substantially for samples with low input material.
We also found that complex normalization methods using estimated size factors do not appear to have an advantage over simpler methods when it comes to specifically analyzing TempO-seq data. Again, the reduced complexity of the sequencing space, and the fact that TempO-seq probes are all equal length, appears to reduce the need for elaborate methods used to address these factors in RNA-seq data. We find that a simple RPM normalization followed by log2(X + 1) transformation is sufficient for high quality data sets. In the case of the titration studies, where both the concentration of input material and the overall sequence depth were more variable, we found that RPM followed by quantile normalization was the most appropriate method to account for these differences.
Finally, we demonstrate the utility of our framework and accuracy metrics for assessing optimal sequencing depth on the SEQC rat S1500+ TempO-seq data set. 6 Based on the results (Figure 5), we recommend targeting a total sequenced read depth of at least 300 K uniquely aligned reads to achieve sufficient accuracy and suggest that 500 K uniquely aligned reads is necessary to achieve sufficient coverage of the majority of probes. As not all sequenced reads will result in unique alignments to probe sequences (all aligners used here showed > 80% unique alignment rate for nontitrated samples), we recommend targeting a total sequenced read depth of at least 500 K for S1500+ TempO-seq platforms to ensure >300 K uniquely aligned reads resulting in sufficient accuracy. Our results also suggest that sequencing samples more deeply than 1M total reads (or 800 K uniquely aligned reads) is likely to produce diminishing returns, both in terms of probe coverage and accuracy (Figure 5), and this sequencing bandwidth would be better spent on multiplexing more samples. We note, however, that these recommendations are specific to the S1500+ probe set, and may need to be adjusted for other cell types and lysate preparations that could affect the proportion of uniquely aligned reads or the relative distribution of reads across probes. The analysis performed here provides a framework for assessing the impact of read depth on accuracy in future data sets. This approach can be applied to any future data set to optimize this critical experimental parameter for other species, cell types, lysate preparations, and versions of the TempO-seq platform, either with or without gold standard data from another platform.
Conclusions
We conclude that a variety of alignment algorithms, including the original Bowtie, 7 are sufficient to obtain accurate and reliable expression estimates from high quality TempO-seq samples. Various normalization procedures have also been shown here to provide generally robust accuracy of data from the TempO-seq platform. These results appear generalizable across species, platform types (whole transcriptome vs S1500+), and experimental setups (analyzing differences in cell lines vs more subtle chemical treatment effects on whole tissue) based on current publicly available TempO-seq data sets.
Supplemental Material
sj-xlsx-1-bbi-10.1177_11779322221095216 – Supplemental material for Impact of Aligner, Normalization Method, and Sequencing Depth on TempO-seq Accuracy
Supplemental material, sj-xlsx-1-bbi-10.1177_11779322221095216 for Impact of Aligner, Normalization Method, and Sequencing Depth on TempO-seq Accuracy by Logan J Everett, Deepak Mav, Dhiral P Phadke, Michele R Balik-Meisner and Ruchir R Shah in Bioinformatics and Biology Insights
Supplemental Material
sj-xlsx-2-bbi-10.1177_11779322221095216 – Supplemental material for Impact of Aligner, Normalization Method, and Sequencing Depth on TempO-seq Accuracy
Supplemental material, sj-xlsx-2-bbi-10.1177_11779322221095216 for Impact of Aligner, Normalization Method, and Sequencing Depth on TempO-seq Accuracy by Logan J Everett, Deepak Mav, Dhiral P Phadke, Michele R Balik-Meisner and Ruchir R Shah in Bioinformatics and Biology Insights
Footnotes
Acknowledgements
The authors acknowledge the computing support from Mihir Shah, Eric McAfee, and Jason Phillips of Sciome LLC.
Author Contributions
All authors conceived of the idea of the manuscript. LJE performed data preprocessing and primary data analysis. DM performed analysis and methods development. DPP and MRB performed additional analysis and quality control. All authors discussed and interpreted the results. LJE wrote the first draft of the manuscript. All authors performed critical revisions and approved the final version of the manuscript. Current affiliation for LJE: Center for Computational Toxicology and Exposure, Office of Research and Development, US EPA, Research Triangle Park, North Carolina. LJE performed all analysis work prior to current affiliation. This work does not necessarily reflect the views or policies of the US EPA, and company or product names do not constitute endorsement by US EPA.
Declaration of Conflicting Interests:
The author(s) declared no potential conflicts of interest with respect to the research, authorship, and/or publication of this article.
Funding:
The author(s) received no financial support for the research, authorship, and/or publication of this article.
Supplemental Material
Supplemental material for this article is available online.
References
Supplementary Material
Please find the following supplemental material available below.
For Open Access articles published under a Creative Commons License, all supplemental material carries the same license as the article it is associated with.
For non-Open Access articles published, all supplemental material carries a non-exclusive license, and permission requests for re-use of supplemental material or any part of supplemental material shall be sent directly to the copyright owner as specified in the copyright notice associated with the article.