
Abstract
Thermodynamic processes with free energy parameters are often used in algorithms that solve the free energy minimization problem to predict secondary structures of single RNA sequences. While results from these algorithms are promising, an observation is that single sequence-based methods have moderate accuracy and more information is needed to improve on RNA secondary structure prediction, such as covariance scores obtained from multiple sequence alignments. We present in this paper a new approach to predicting the consensus secondary structure of a set of aligned RNA sequences via pseudo-energy minimization. Our tool, called RSpredict, takes into account sequence covariation and employs effective heuristics for accuracy improvement. RSpredict accepts, as input data, a multiple sequence alignment in FASTA or ClustalW format and outputs the consensus secondary structure of the input sequences in both the Vienna style Dot Bracket format and the Connectivity Table format. Our method was compared with some widely used tools including KNetFold, Pfold and RNAalifold. A comprehensive test on different datasets including Rfam sequence alignments and a multiple sequence alignment obtained from our study on the
Introduction
RNA secondary structure prediction has been studied for quite awhile. Many minimum free energy (MFE) methods have been developed for predicting the secondary structures of single RNA sequences, such as mfold, 1 RNAfold, 2 MPGAfold, 3 as well as recent tools presented in the literature. 4 However, the accuracy of predicted structures is far from perfect. Recently, a new concept of normalized free energy for predicting the secondary structures of single RNA sequences was introduced. 5 The normalized free energy of an RNA substructure is the free energy of that substructure divided by the length of its underlying sequence. A dynamic programming algorithm, called Densityfold, was developed, which delocalizes the thermodynamic cost of computing RNA substructures and improves on secondary structure prediction via normalized energy minimization. 5 Here, we extend the concept used in Densityfold and present a new tool, called RSpredict, for RNA secondary structure prediction. RSpredict computes the RNA structure with minimum normalized energy based on the loop decomposition scheme used in the nearest neighbor energy model.6–8 The new tool focuses on the loops in an RNA secondary structure, whereas Densityfold considers RNA substructures where a substructure may contain several loops.
To understand the difference between the two tools, see Figure 1. In the figure, the substructure


Illustration of the loops and substructures in an RNA secondary structure. Each loop has at least one base pair. A stem consists of two or more consecutive stacks shown in the figure.
where


where

While the normalized energy model creates a foundation for RNA secondary structure prediction, there are many limitations in Densityfold, just like in all other single sequence-based MFE methods. Optimal structures predicted by these methods do not necessarily represent real structures. This happens due to several reasons. The thermodynamic model may not be accurate. The bases of structural RNAs may be chemically modified and these processes are not included in the prediction model. Finally, some functional RNAs may not have stable secondary structures. Thus, a more reliable approach is to use comparative analysis to compute consensus secondary structures from multiple related RNA sequences.
In general, there are three strategies with the comparative approach. The first strategy is to predict the secondary structures of individual RNA sequences separately and then align the structures. Tools such as STRUCTURELAB 9 and RADAR 6 are based on this strategy. The second strategy predicts common secondary structures of two or more RNA sequences through simultaneous alignment and consensus structure inference. Tools based on this strategy include RNAscf, 10 Dynalign, 11 stemloc, 12 and CARNAC. 13 These tools utilize either folding free energy change parameters or stochastic context-free grammars (SCFGs) and are considered derivations of Sankoff's method. 14
The third strategy is to fold multiple sequence alignments. RNAalifold15,16 uses a dynamic programming algorithm to compute the consensus secondary structure with minimum free energy by taking into account thermodynamic stability, sequence covariation together with RIBOSUM-like scoring matrices. Pfold 17 is a SCFG algorithm that produces a prior probability distribution of RNA structures. A maximum likelihood approach is used to estimate a phylogenetic tree for predicting the most likely structure for input sequences. A limitation of Pfold is that it does not run on alignments of more than 40 sequences and in some cases produces no structures due to under-flow errors. Maximum weighted matching (MWM), based on a graph-theoretical approach and developed by Cary and Stormo 18 and Tabaska et al, 19 is able to predict common secondary structures allowing pseudoknots. KNetFold 20 is a recently published machine learning method, implemented using a hierarchical network of k-nearest neighbor classifiers that analyzes the base pairings of alignment columns in the input sequences through their mutual information, Watson-Crick base pairing rules and thermodynamic base pair propensity derived from RNAfold. 2 The method proposed in this paper, RSpredict, joins the many tools using the third strategy; it accepts a multiple alignment of RNA sequences as input data and predicts the consensus secondary structure for the input sequences by minimizing their pseudo-energy, which takes into account both the normalized free energy and covariance scores of the input sequences.
The rest of the paper is organized as follows. We first describe the implementation and algorithms used by RSpredict, and analyze the time complexity of the algorithms. We then present experimental results of running the RSpredict tool as well as comparison with the existing tools. The experiments were performed on a variety of datasets. Finally we discuss some properties of RSpredict, possible ways to improve the tool and point out some directions for future research.
Methods
RSpredict, which can be freely downloaded from http://datalab.njit.edu/biology/RSpredict, was implemented in the Java programming language. The program accepts, as input data, a multiple sequence alignment in FASTA or ClustalW format and outputs the consensus secondary structure of the input sequences in both the Vienna style Dot Bracket format 16 and the Connectivity Table format. 21 Below, we describe the normalized energy model adopted by RSpredict. We then present a dynamic programming algorithm for folding a single RNA sequence via normalized energy minimization. Next, we describe techniques for calculating covariance scores based on the input alignment. Finally we summarize the algorithms used by RSpredict, combining both the folding technique and the covariance scores obtained from the input alignment, and show its time complexity.
Folding of a single RNA sequence
We represent an RNA secondary structure as a fully decomposed set of loops.6–8 In general, a loop
a hairpin loop (which is a loop enclosed by only one base pair; the smallest possible hairpin loop consists of 3 nucleotides enclosed by a base pair);
a stack, composed of two consecutive base pairs;
a bulge loop, if two base pairs are separated only on one side by one or more unpaired bases;
an internal loop, if two base pairs are separated by one or more unpaired bases on both sides;
a multibranched loop, if more than two base pairs are separated by zero or more unpaired bases in the loop.
We now introduce some terms and definitions. Let
We use the normalized energy concept as follows. Given a secondary structure
When generalizing the folding of a single sequence to the prediction of the consensus structure of a multiple sequence alignment, we introduce the notion of refined alignments. At times, an input alignment may have some columns each of which contains more than 75% gaps. Some tools including RSpredict delete these columns to get a refined alignment;
17
some tools simply use the original input alignment as the refined alignment. Suppose the original input alignment
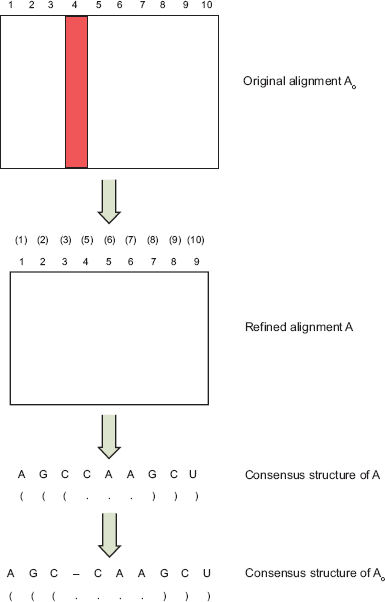
Illustration of the consensus structure definition used by RSpredict. Here, the RSpredict algorithm transforms the original input alignment
In what follows, we first present an algorithm for folding a single RNA sequence based on the normalized energy concept described here. We then generalize the algorithm to predict the consensus secondary structure for a set of aligned RNA sequences.
Algorithm
The functions and parameters used in our algorithm are defined below where
It is clear that:


The denominator in Equation 2) is 4 because there are four nucleotides in the stack. In (4),
That is, the normalized energy
(
(
(
(
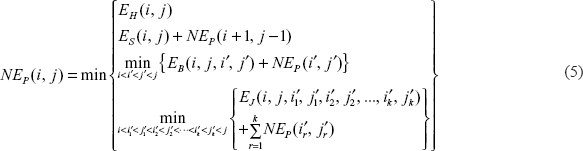
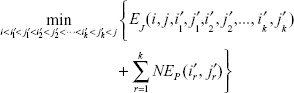
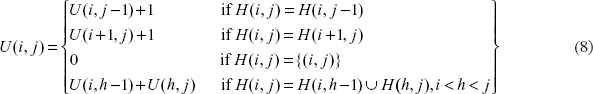
Equation (6) below shows the recurrence formula for calculating

That is, the normalized energy
the total normalized energy of all loops in the optimal secondary structure Illustration of the four cases in Equation 6). 
the total normalized energy of all loops in the optimal secondary structure
the total normalized energy of all loops in the optimal secondary structure
the minimum of
Note that case (iii) of Equation 6) is not considered when the nucleotides at positions
Complexity
In calculating the time complexity of the folding algorithm, there is a need to check for finding the optimal
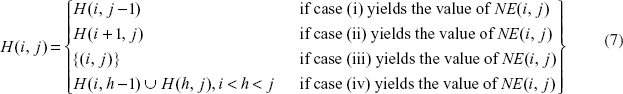
We introduce two entries to be updated based on the cases in Equation 6):
Depending on which case in Equation 6) yields the value of
With the two introduced entries, the case (iii) in Equation 5):

and the case (iv) in Equation 5):
can be combined and expressed by a single formula as follows:
where
Then:
calculate
Calculation of covariance scores
When applying the above folding algorithm to a multiple sequence alignment

containing more than 75% gaps to get a refined alignment
Covariance score
We use the covariance score introduced by RNAa-lifold
15
to quantify the relationship between two columns in the refined alignment. Let

Here,

where

Observe that the information acquired from the two base pairs (
For every pair of columns

Here,

where
Pairing threshold
We say that column
It is known that, on average, 54% of the nucleotides in an RNA sequence

and
Now, we calculate the covariance scores of all pairs of columns in the given refined alignment, and sort the covariance scores in descending order. We then select the top

Illustration of the pairing threshold computation. The pairing threshold used in RSpredict is computed as the average of the covariance scores inside the red shaded area.

where the denominator is the cardinality of the set difference
If the covariance score of columns
Algorithms for RSpredict
Given a refined multiple sequence alignment

Here,
Notice that when calculating the normalized energy for the loop
Input an alignment
Delete the columns with more than 75% gaps from
Compute the pseudo-energy
Run the minimum normalized energy folding algorithm on
Map the consensus structure
Notice that Equation 6) is used to compute the
Let
Results
We conducted a series of experiments to evaluate the performance of RSpredict and compared it with three related tools including KNetFold, Pfold and RNAalifold. We tested these tools on Rfam
23
sequence alignments with different similarities. The Rfam sequence alignments come with consensus structures. For evaluation purposes, we used the Rfam consensus structures as reference structures and compared them against the consensus structures predicted by the four tools. The similarity of a sequence alignment is determined by the average pairwise sequence identity (APSI) of that alignment. In the study presented here, a sequence alignment is of high similarity if its APSI value is greater than 75%, is of medium similarity if its APSI value is between 55% and 75%, or is of low similarity if its APSI value is less than 55%. The data sets used in testing included 20 Rfam sequence alignments of high similarity and 36 Rfam sequence alignments of low and medium similarity. These data sets were chosen to form a collection of sequence alignments with different (low, medium and high) APSI values, different numbers of sequences, as well as different sequence alignment lengths. More specifically, the data sets contained sequence alignments that ranged in size from 2 to 160 sequences, in length from 33 to 262 nucleotides and had APSI values ranging from 42% to 99%. We also tested the tools on a multiple sequence alignment obtained from our study on the
The performance measures used in our study include sensitivity (SN) and selectivity (SL), 20 where
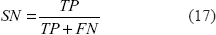
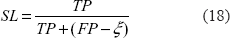
Here
Performance evaluation on Rfam alignments of high similarity
The first data set consisted of seed alignments of high similarity taken from 20 families in Rfam. The APSI values of these seed alignments ranged from 77% to 99%. The alignments ranged in size from 2 to 160 sequences and in length from 33 to 159 nucleotides. Table 1 presents details concerning the 20 families and their seed alignments.
The accession number, description, number of sequences, and length of the seed alignment of each of the 20 families used in the experiment.

The seed alignments of the 20 families from Rfam are of high similarity. Their average pairwise sequence identity (APSI) values are shown in the last column of the table.
All four tools including RSpredict, KNetFold, RNAalifold and Pfold were tested on this data set. Table 2 presents the values of Matthews correlation coefficient (MCC), sensitivity (SN) and selectivity (SL), as well as their mean and standard deviation for each of the four tools. Figure 5 compares the four tools based on these values. We use ROC (receiver operating characteristic) plots to simultaneously display both sensitivity and selectivity for each tool.

Comparison of the SN and SL values of the four tools under analysis on the seed alignments of high similarity taken from the 20 families listed in Table 1. We use ROC plots to simultaneously display the sensitivity and selectivity values achieved by each tool. The X-axis shows the selectivity values, whereas the Y-axis shows the sensitivity values.
The MCC, SN and SL values for each method tested in the experiment with sequence alignments of high similarity, as well as the mean and standard deviation of the MCC, SN and SL values for each tool under analysis.

The best MCC value for each family, and the best mean and standard deviation are highlighted in bold. Note that only 17 out of the 20 sequence alignments in this experiment were accepted as input to the Pfold server. The other three (RF00386, RF00041 and RF00389) had more than 40 sequences and therefore could not be run on the server. Note also that RSpredict has the best standard deviation in MCC, SN and SL respectively compared with the other three tools. This shows that RSpredict has stable performance across all the families tested in the experiment.
It can be seen from Table 2 and Figure 5 that RSpredict performed the best. The Pfold tool had good performance in selectivity but did not perform well in sensitivity and as a result in Matthews correlation coefficient. It also suffered from a size limitation (the Pfold web server can accept a multiple alignment of up to 40 sequences). Only 17 out of the 20 sequence alignments used in the experiment were accepted by the Pfold server; the other three alignments (RF00386, RF00041 and RF00389) had more than 40 sequences and therefore could not be run on the Pfold server. RSpredict had stable performance with the best mean 0.85 (standard deviation 0.16, respectively) in MCC, while the other methods’ MCC values varied a lot and had means (standard deviations, respectively) ranging from 0.71 to 0.82 (0.24 to 0.28, respectively).
Performance evaluation on Rfam alignments of medium and low similarity
In the second experiment, we compared RSpredict with the other three methods on multiple sequence alignments of low and medium similarity. The test dataset included seed alignments of 36 families taken from Rfam. 23 The average pairwise sequence identity (APSI) values of the seed alignments ranged from 42% to 75%, the number of sequences in the alignments ranged from 3 to 114, and the alignment lengths ranged from 43 to 262 nucleotides. Table 3 presents details concerning the 36 families and their seed alignments.
The accession number, description, number of sequences, and length of the seed alignment of each of the 36 families used in the experiment.

The seed alignments of the 36 families from Rfam are of low and medium similarity. Their average pairwise sequence identity (APSI) values are shown in the last column of the table.
Table 4 presents the values of Matthews correlation coefficient (MCC), sensitivity (SN) and selectivity (SL), respectively, as well as their mean and standard deviation for each of the four tools. Figure 6 shows ROC (receiver operating characteristic) plots, which simultaneously display both sensitivity and selectivity for each tool.

Comparison of the SN and SL values of the four tools under analysis on the seed alignments of low and medium similarity taken from the 36 families listed in Table 3. We use ROC plots to simultaneously display the sensitivity and selectivity values achieved by each tool. The X-axis shows the selectivity values, whereas the Y-axis shows the sensitivity values.
The MCC, SN and SL values for each method tested in the experiment with sequence alignments of low and medium similarity, as well as the mean and standard deviation of the MCC, SN and SL values for each tool under analysis.

The best MCC value for each family, and the best mean and standard deviation are highlighted in bold. Note that RSpredict has the best standard deviation in MCC, SN and SL respectively compared with the other three tools. This shows that RSpredict has stable performance across all the families tested in the experiment.
Comparing Table 2 and Table 4, we see that the methods under analysis generally performed better on sequence alignments of medium and low similarity than on sequence alignments of high similarity. RSpredict outperformed the other three methods based on the three performance measures used in the experiment. The tool achieved a high mean value of 0.94 in MCC, better than those of KNetFold (0.86), Pfold (0.88) and RNAalifold (0.89). Similar results were observed for sensitivity and selectivity values. Furthermore, RSpredict exhibited stable performance across all the families tested in the experiment. The tool had an MCC, SN and SL standard deviation of 0.08, 0.09 and 0.08, respectively. These numbers were better than the standard deviation values obtained from the other three methods, which ranged from 0.12 to 0.25. Due to the restriction on the alignment size imposed by the Pfold server, only 27 alignments out of 36 could be run on Pfold. The other nine alignments had more than 40 sequences and hence could not be accepted by the Pfold server.
Performance evaluation on the Drosophila dataset
The male-specific lethal (MSL) complex, which includes two noncoding RNAs on X (

Consensus structures generated from the roX2 RNA sequence alignment.
Discussion
In this paper we presented a software tool, called RSpredict, capable of predicting the consensus secondary structure for a set of aligned RNA sequences via pseudo-energy minimization. Our experimental results showed that RSpredict is competitive with some widely used tools including RNAalifold and Pfold on tested datasets, suggesting that RSpredict can be a choice when biologists need to predict RNA secondary structures of multiple sequence alignments. Notice that RSpredict differs from our previously developed KNetFold 20 in that KNetFold is a machine learning method that relies on pre-compiled training data derived from existing RNA secondary structures. RSpredict, on the other hand, is based on a dynamic programming algorithm for folding sequences and does not utilize training data.
RSpredict adopts the normalized energy concept originated from Densityfold, whose web server is named alteRNA. 5 We described the difference between RSpredict and Densityfold in the beginning of the Introduction section. Unlike RSpredict that predicts consensus structures for multiple sequence alignments, alteRNA predicts secondary structures for single sequences. Thus, one cannot do a direct comparison of performance between the two tools. We implemented the idea in alteRNA in a program that uses the same covariance scores as RSpredict to predict consensus structures for multiple sequence alignments. The performance of this program is inferior to those of the four tools studied in the paper.
RSpredict contains two user-defined parameters,
It was observed that the accuracy of the consensus structures produced by RSpredict varies with sequence lengths, though there is no clear trend between the accuracy and the lengths. For example, referring to Tables 3 and 4, the seed alignment of RF00230 (RF00559 and RF00468, respectively) has a length of 262 nt (81 nt and 66 nt, respectively) and MCC value of 0.83 (0.91 and 0.65, respectively), showing no direct relationship between the alignment length and the MCC.
Finally, we compared the computational time required by the four tools studied in the paper. Pfold and KNetFold are available as web servers. We submitted the same multiple alignments having a length of 100 nt, 200 nt and 300 nt, respectively to each of the four web servers. Results were reported back by KNetFold (Pfold, RNAalifold, RSpredict, respectively) in 605, 660, 1125 seconds (10, 15, 33 seconds, 9, 10, 11 seconds, 9, 19, 76 seconds, respectively). While the speed of a web server also depends on network traffic and server workload, these timing data give an estimate of how fast each tool can run. The RSpredict program needs 0.3 MB RAM (1.3 MB and 2.9 MB, respectively) to perform the computation for the input alignment whose length is 100 nt (200 nt and 300 nt, respectively) measured on a PC with Intel(R) Core(TM)2 Duo CPU (2.19 GHz/ 2.00 GB RAM/Microsoft Windows XP). The RSpredict web server can accept multiple alignments with at most 200 sequences in size and at most 500 nucleotides in length, though the downloadable version does not have this restriction.
All the four tools studied in this paper take multiple sequence alignments as input data. We are looking into algorithms for enhancing the quality of multiple sequence alignments so as to improve on secondary structure prediction. One approach is to take into consideration the effect of base-pair covariation in the alignment process, like the Murlet tool. 26 There are other approaches for obtaining better sequence alignments. For example, BlockMSA 27 uses a combination of a biclustering algorithm and a divide-and-conquer technique. Groups of similar sequences are found and subsequences within them are locally aligned. The final alignment is obtained by dividing both the set of sequences and their contents. 27 Other ways to improve the prediction accuracy include the utilization of evolutionary information, more sophisticated models of covariance scoring, and training data for more accurate pairing thresholds. Finally, by integrating our previously developed RADAR server 6 with RSpredict, we plan to offer our software as a suite of tools to the user as done in some recent work. 28
Footnotes
Acknowledgements
We are grateful to the anonymous reviewers for their useful comments and to David Mathews for his constructive suggestions on an earlier draft of this paper. This work was partially supported by the National Science Foundation grant IIS-0707571 and the National Institutes of Health grant R01 AI053835. YP was supported by the American Heart Association grant 0535548T, the UMDNJ Foundation grant and the National Science Foundation grant MCB-0818464. BAS was supported by the Intramural Research Program of the National Institutes of Health, National Cancer Institute, Center for Cancer Research.
The authors report no conflicts of interest