
Abstract
Due to major breakthroughs in sequencing technologies throughout the last decades, the time and cost per sequencing experiment have reduced drastically, overcoming the data generation barrier during the early genomic era. Such a shift has encouraged the scientific community to develop new computational methods that are able to compare large genomic sequences, thus enabling large-scale studies of genome evolution. The field of comparative genomics has proven itself invaluable for studying the evolutionary mechanisms and the forces driving genome evolution. In this line, a full genome comparison study between 2 species requires a quadratic number of comparisons in terms of the number of sequences (around 400 chromosome comparisons in the case of mammalian genomes); however, when studying conserved syntenies or evolutionary rearrangements, many sequence comparisons can be skipped for not all will contain significant signals. Subsequently, the scientific community has developed fast heuristics to perform multiple pairwise comparisons between large sequences to determine whether significant sets of conserved similarities exist. The data generation problem is no longer an issue, yet the limitations have shifted toward the analysis of such massive data. Therefore, we present XCout, a Web-based visual analytics application for multiple genome comparisons designed to improve the analysis of large-scale evolutionary studies using novel techniques in Web visualization. XCout enables to work on hundreds of comparisons at once, thus reducing the time of the analysis by identifying significant signals between chromosomes across multiple species. Among others, XCout introduces several techniques to aid in the analysis of large-scale genome rearrangements, particularly (1) an interactive heatmap interface to display comparisons using automatic color scales based on similarity thresholds to ease detection at first sight, (2) an overlay system to detect individual signal contributions between chromosomes, (3) a tracking tool to trace conserved blocks across different species to perform evolutionary studies, and (4) a search engine to search annotations throughout different species.
Introduction
In the last decades, the advancements in sequencing technologies have caused a drastic reduction in time and cost per sequencing experiment, dropping from over a $10 000 down to a few cents per megabase. 1 As a result, the collection of publicly available sequenced genomes has heavily increased. This has encouraged the scientific community to develop computational methods to compare large genomic sequences and increase our understanding of the underlying genomic mechanisms that play a key role in evolution. 2 However, the increasing complexity of the current more-and-larger-genome trend is rendering some of the prevailing computational methods as futile.
In this line, comparative genomics has proven itself indispensable, not only for the research of evolutionary mechanisms and forces but also for helping in the understanding of the human genome. In short, the essence of this field is that a sequence that is conserved across multiple and/or distant species is likely to be involved in a biological function, 3 thus affecting its evolution. 4
Computing large genomic pairwise comparisons often requires long running times and computational resources. Although tools such as GECKO, 5 CGALN, 6 or MUMMER 7 have been developed for large-scale sequence comparison, they can require up to several hours depending on factors such as the length of the sequences or number of repetitions. Moreover, comparing the full genome between 2 species (all-vs-all chromosomes) can comprise up to 400 pairwise comparisons (around 20*20 chromosomes) where a noticeable amount of the results is composed mostly of repeats and nearly no syntenic blocks. Accordingly, novel bioinformatics tools such as CHROMEISTER 8 reduce the computational complexity of performing an exhaustive comparison by incorporating a heuristic step. These tools effectively determine whether conserved similarities exist across a collection of genomic sequence without requiring large computation times. The detection of conserved blocks includes both coding and noncoding regions, which enables the further identification of computational synteny blocks (CSB). 9 These CSBs describe a group of closely located regions that tend to be conserved due to several reasons, such as the interaction of gene products,10,11 lateral gene transfer, co-localization of gene transcripts, 12 or co-expression under specific environmental conditions. 13 Furthermore, the identification and tracking of highly conserved and collinear regions are important to solve multiple problems in comparative genomics, such as the prediction of operon-protein interaction and functional annotation of uncharacterized genes, 14 and to study genome evolution and organization.15-17
Thus, these fast comparison methods provide further insight regarding large-scale genome evolutionary studies. However, effective and quick visualization methods to explore and analyze these comparisons are still required. Most of the handling, exploration, and curation of genomic information to identify coding regions or detect CSBs from pairwise comparisons are performed throughout dedicated platforms such as NARCISSE, 18 Genomicus, 19 or GBrowser. 20 For instance, NARCISSE is a Web-based tool that enables the researcher to visualize both genome and chromosome comparisons along a collection of precomputed data through a multiple dotplot-like visualization, but lacks, for instance, (1) methods to visualize both the importance and the contribution of each comparison, (2) a tracking system for conserved blocks, (3) a dynamic communication between the visualization and the user, or (4) the ability to work with user-generated data. NARCISSE provides a matrix of 1 versus 1 comparisons that can be expanded as XCout does. This enables the user to visit each one of the regions to obtain a detailed view of that specific part.
Regarding Genomicus, it is a useful tool for genome comparison visualization that provides also a gene tracking system but has some limitations such as the following: (1) working with full genome multi-pairwise comparisons through different species and (2) tracing shared regions through different species; GBrowser, on the contrary, is helpful for genome analysis but does not enable to track conserved regions between species. Other tools have opted for static visualization reports and statistics, such as Synimia, 21 Evol2Circos, 22 and SimpleSynteny, 23 as opposed to dynamic, tailored, and interactive representations as presented in Genomicus or NARCISSE.
Although Genomicus and NARCISSE have been a source of inspiration for XCout, we propose a completely new method for carrying out experiments involving huge amounts of comparisons. (1) At a technical level, Xcout takes advantage of current state-of-the-art techniques in Web visualization and Web development (ie, responsiveness, ubiquity access, application programming interface [API] support, dynamic interaction, etc) to improve user experience and broaden the scope of research experiments. (2) Regarding biological information, the amount of precomputed data is in the order of 50 000 comparisons. Although researchers can run their own instance of XCout, a method for working with proprietary data is also provided to use XCout as a public instance. Furthermore, the XCout API has also been developed taking into account the possibilities to expand the database through petitions to keep it updated. Finally, XCout also expands the capabilities of genome comparison visual analysis by providing methods for tracking conserved blocks and overlaying different comparisons to create more complete pieces of the genomic puzzle.
In summary, in this article, we present XCout, a Web-based visual analytics application for multiple genomic comparisons designed to improve the workflow of analyzing large amounts of already computed genomic data by using novel technologies in Web visualization. XCout enables the user to check the results of hundreds of huge comparisons, further reducing the time of the analysis by identifying pairwise comparison similarities with a significant signal of interest between different chromosomes across multiple species. The comparisons are presented to the user through an approach similar to a heatmap, using a color scale to detect comparisons of interest at first sight. In addition, the user can notice the origin of the contributions of multiple chromosomes of one species against another chromosome of interest by performing an on-the-fly overlap of the genome selection. XCout also provides an annotation tracking system that allows the researchers to identify genes between similar blocks and view related information, such as their coordinates, gene ID, product, and notes. The presented genomic information has been retrieved from the GenBank annotation files provided by the National Center for Biotechnology Information (NCBI).
In addition, an all-versus-all genome comparison between 10 different species has been carried out, and the results of more than 50 000 pairwise comparisons are publicly available through a REST service API. Similarly, users are able to compute their own comparisons locally and visualize their results through our graphical interface.
Finally, we present a systematic and general approach to contrast the collected CSBs from different comparisons regarding their location, similarity, and evolution through time, hence enabling the researchers to select a set of comparisons between chromosomes of different species and follow the CSBs that are directly linked between one another. This feature can be executed throughout the Web application in which the resulting relationships can be downloaded and visualized.
System and Methods
System architecture
XCout is based on an N-tiered architecture composed of 3 layers (see Figure 1). First, in the client side, we can find the first layer, the Presentation layer, where all the visualization is carried out. The other 2 layers are located in the Server side where the complex workload is delegated through a REST API. This side is composed of a layer where logic has been implemented and a Database layer in charge of storing and accessing the files. The Database layer contains information regarding the species and chromosomes of all the stored pairwise comparisons. This structure allows us to perform the expensive computational methods in the server, even if the user decides to visualize local files.

N-tier architecture of XCout. It is composed of the presentation, logical, and database layers with an application programming interface layer that enables the communication between the client and server side. The client side has been developed using jQuery and D3.js and contains 3 different types of visualization: (1) heatmap-like, (2) comparison overlay, and (3) CSB tracking. The server side has been developed in Django.
The 3 layers that compose the system architecture are the following:
Presentation layer: It provides the graphical user interface (GUI) of the Web application for the user. The layer enables the user to retrieve and visualize information from the server through the REST API regarding the species, chromosomes, and comparisons stored in the server or locally loaded.
Logic layer: This is responsible for accessing the controller tier to manipulate and transform the data requested and send the results to the presentation tier. In addition, the REST API interface will enable users to request information from third party applications.
Database layer: This tier is in charge of accessing and manipulating data from the data sources. Moreover, the creation of simple reusable components allows this layer to invoke stored procedures and retrieve data from the database.
Client side
The client platform is composed of multiple independent modules that execute specific visualizations and functionalities for each of the visualizations offered by the application: grid, overlay, and block tracing. This platform was developed using a regular HTML5 24 structure combined with a customized CSS3 25 design based on Bootstrap library 26 to provide a responsive style.
Similarly, Javascript 27 was used to manage the natural behavior of the Web structure elements, accompanied by jQuery 28 to control the user interaction. The different visualization methods were designed using D3.js, 29 a famous data visualization library.
Server side
The server platform has a modular organization with 2 main sections that control the database and the services. On top of them, there is a REST API that enables the Client platform to communicate with the server to obtain the adequate response, whether it is a Web page or the results of a process. In other words, the REST API is the interface between the Client and the services provided by the Server platform.
The use of Python has become increasingly popular in bioinformatics. Moreover, the huge variety of useful existing modules and the possibility to allow the user to develop his own are the reasons why we developed the backend implementation using Django, 30 a Python framework designed for Web applications. This is the backbone of the server and simplifies the development of specific components of the application as it is based on a modular structure.
Database storage
Users are capable of loading local properly formatted data set results into XCout. However, to avoid the repetitive task of manually loading them, we have implemented a database that stores information regarding the species and chromosomes for each comparison. The stored information is accessed and manipulated through the controller layer tier of the system architecture, which ensures a proper usage via the REST API.
Including comparisons into the database can be performed manually, yet we suggest the use of the API methods we have developed and implemented that automatize this tedious process. The detailed description of this process and the information stored by the database are provided in the Supplementary Material.
Comparative genomics workflow
This section describes the multiple visualization methods provided by XCout to display and analyze the results of full genome comparisons properly formatted, independent of whether they are stored locally or in a server. XCout has been developed to work specifically with the results of CHROMEISTER, so we fully encourage users to follow this step. Either way and as mentioned before, data can be loaded from local so that users can adapt their data to our specific input.
Grid visualization
Considering that a full genome comparison between 2 species comprises over N × M comparisons, with N and M being the number of chromosomes per organism, the user can visualize all the generated images through our grid visualization (see Figure 2, top). Such visualization facilitates the visual identification, based on the similarity degree, of comparisons of interest out of a huge number of comparisons by presenting an interactive matrix canvas in which each row and column represent a chromosome of a species and the cells represent the comparisons between them. These cells are distinguished by a customizable color gradient that represents the similarity of the compared sequences. Furthermore, functionalities such as adjusting the color gradient and cell size, manually or automatically, expedite the multiple genome comparison analysis. Furthermore, this visualization enables the user to load as many desired all-versus-all comparisons at once (ie, 1vs3, 2vs2, etc).

On the top, all-versus-all pairwise comparison visualization of the chromosomes of Homo sapiens against the chromosomes of Mus musculus. The color of each cell is in the range of red-green-white color scale, which represents the similarity degree of each comparison, respectively, from the most similar to the least. At the bottom, the overlay of the 3 pairwise comparisons of the chromosomes of Mus musculus chromosomes against the first chromosome of Homo sapiens.
Extended cell visualization
The user is capable of selecting and visualizing the pairwise comparison image by selecting a cell. Moreover, an overlay feature has been implemented to enable the researcher to select a chromosome and overlay all the detected CSBs of such genome against all the chromosomes of another species (see Figure 2, bottom). This aspect supports a fast recognition of the contributions of multiple chromosomes of one species regarding another, which provides insight regarding the chromosomal mutations that have taken place.
CSB tracing
Researchers can also trace the CSBs that have been previously overlaid, or just those interesting, among different species. XCout performs the tracking on the server side and sends the results to the user to visualize it. From the computational standpoint, the block tracing is performed by assessing whether the shared section of CSBs of 2 different species is statistically significant.
Annotations search engine
Regarding the tracking of conserved regions, XCout enables researcher for searching through annotations retrieved from GenBank. Through this feature, specific annotations are represented at the same time with the tracking so that the user can visually compare them. Annotations can also be downloaded for any further processing that have to be done out of the XCout environment. Noncoding regions (ie, sequence zones without any annotations) can be also downloaded for deeper analysis.
File management
XCout allows the researcher to make complete analysis through different tools, but further processing may be required. In this way, XCout implements methods to download information regarding the current session such as conserved regions or annotations. The use of local files, to work with specific comparisons bypassing the database, is also available through the interface. Regarding the work involved, data set must include a collection of images, one for each comparison, as well as a scoring metric comparison. CHROMEISTER is known to produce these type of results, but any other software can be used.
Implementation
Client side
The client platform is composed of multiple independent modules that execute specific visualizations and functionalities for each of the visualizations offered by the application: grid, overlay, and block tracing. This platform was developed using a regular HTML5 24 structure combined with a customized CSS3 25 design based on Bootstrap library 26 to provide a responsive style.
Similarly, Javascript 27 was used to manage the natural behavior of the Web structure elements, accompanied by jQuery 28 to control the user interaction. The different visualization methods were designed using D3.js, 29 a famous data visualization library.
Server side
The server platform has a modular organization with 2 main sections that control the database and the services. On top of them, there is a REST API that enables the Client platform to communicate with the server to obtain the adequate response, whether it is a Web page or the results of a process. In other words, the REST API is the interface between the Client and the services provided by the Server platform.
The use of Python has become increasingly popular in bioinformatics. Moreover, the huge variety of useful existing modules and the possibility to allow the user to develop his own are the reasons why we developed the backend implementation using Django, 30 a Python framework designed for Web applications. This is the backbone of the server and simplifies the development of specific components of the application as it is based on a modular structure.
Database storage
Users are capable of loading local properly formatted data set results into XCout. However, to avoid the repetitive task of manually loading them, we have implemented a database that stores information regarding the species and chromosomes for each comparison. The stored information is accessed and manipulated through the controller layer tier of the system architecture, which ensures a proper usage via the REST API.
Including comparisons into the database can be performed manually, yet we suggest the use of the API methods we have developed and implemented that automatize this tedious process. The detailed description of this process and the information stored by the database are provided in the Supplementary Material.
Results
We will demonstrate the capabilities of XCout to explore and assess the evolutionary differences and similarities across multiple species, namely, human, gorilla, and mouse. We have designed an exercise comprising multiple pairwise comparisons and conserved block tracking aimed at showcasing the following features: (1) to understand the evolution between the multiple chromosomes of Gorilla gorilla (gorilla) to the first chromosome of Homo sapiens (human) using the signal contribution analysis and (2) to observe the different chromosomal mutations that have taken place along evolution in the genome of Mus musculus. Step-by-step descriptions of multiple exercises are detailed in the Supplementary Material.
To be of relevance to human medicine, the animals used in research should show similarities to human biology to maximize the chances of success during an experiment. In this sense, mice and rats are invaluable for studying biological processes that have been conserved during the evolution of the rodent and primate lineages and for investigating the developmental mechanisms by which the conserved mammalian genome gives rise to a variety of different species. 31 These rodents are widely used for scientific research due not only to its resemblance of human genome but also because they are small, breed readily, can be genetically modified rather easily, and are usually inexpensive.32,33 However, mice and humans have evolved and adapted to different environments; therefore, despite their genomic relatedness, they have become very different organisms. There are some examples where the gaps between the biology of rodents and that of humans are too wide: the rodents’ brain functions, diseases, reproduction, and susceptibility to certain infections are radically different from the human biology.34,35 Hence, the research has to consider these gaps or it might be done on more closely related animals such as primates or apes. 36
To begin the exercise, we open the full genome comparison between the human and mouse genome. The grid visualization provides insight regarding the similarities between chromosomes (Figure 2, top). To fathom the contribution of the mouse chromosomes to the human’s first chromosome, we proceed to overlay the detected CSBs from the 3 most significant comparisons (Figure 2, bottom). The visual analysis provides evidence of coverage between these chromosomes.
Consequently, we proceed our analysis by tracing the detected CSBs across human and mouse. We have added the gorilla to the comparison to show how blocks evolve through species as chromosome 1 of human and gorilla shares several conserved regions (Figure 3, bottom). In the first comparison, between human and gorilla, we clearly identify 2 big blocks (A, B) that cover almost all the chromosome. Second, we identify 3 groups of blocks (C, D, E) that have been traced across these species and mice by splitting into 3 different chromosomes. We can see how the conserved region A in the human chromosome can be partially found in mouse chromosome 3 (D) and in mouse chromosome 4 (E). The display also enables the detection of inversions, for example, in blocks C1, C3, D1, E2 and E3 and translocations, for instance, in blocks D and E.
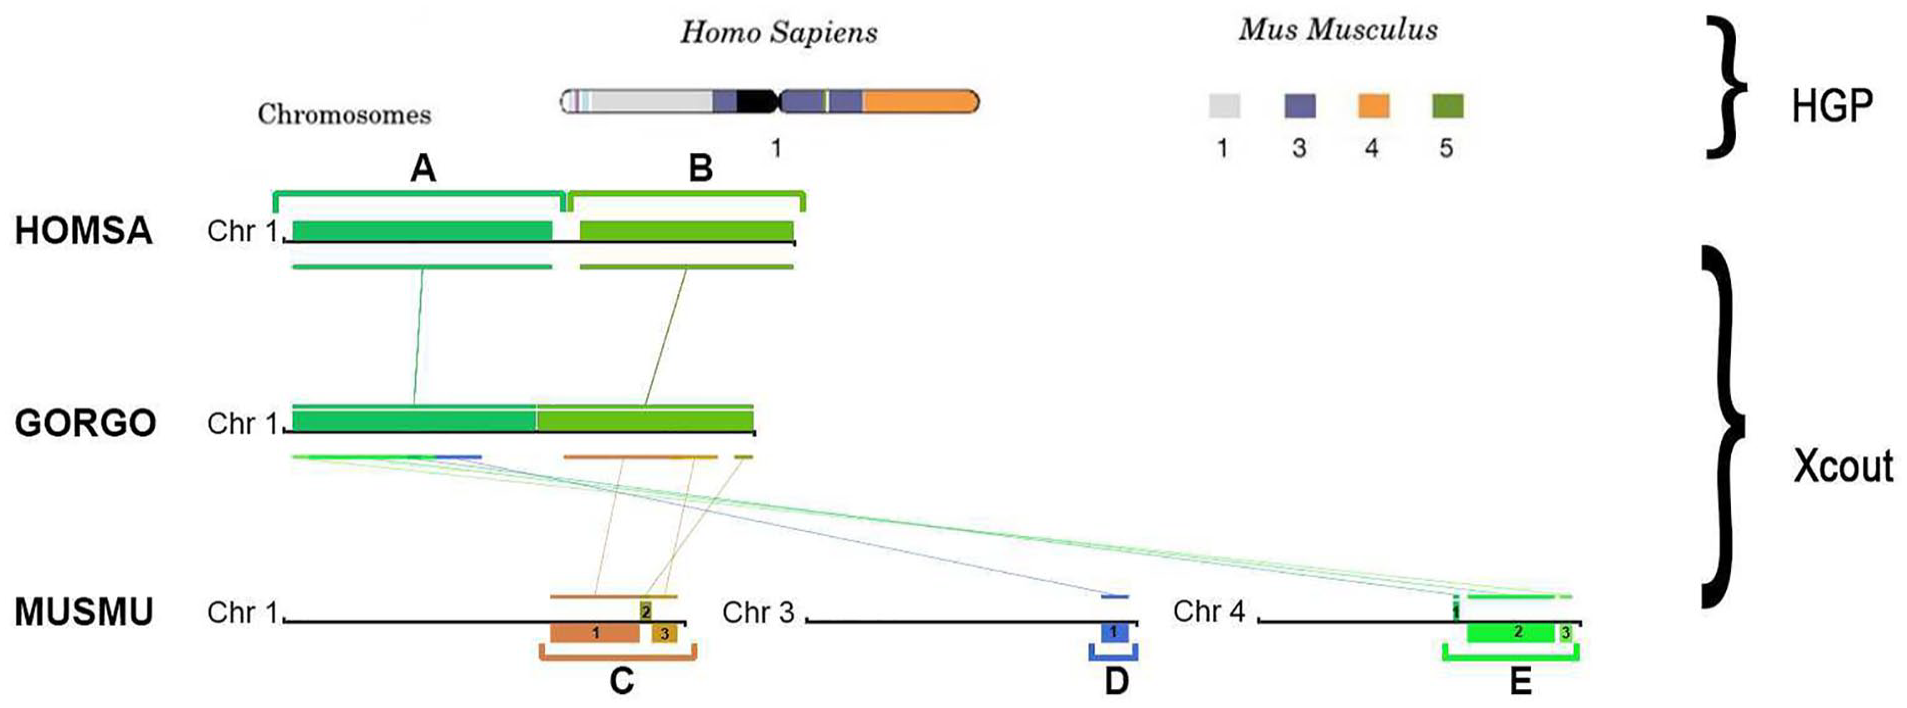
Visualization comparison between XCout results and Human Genome Project (HGP). On the top, the HGP analysis of the first human chromosome shows the conserved regions in the mouse genome where each color block represents a particular mouse chromosome. On the bottom: XCout visualization of human first chromosomes and detected CSBs from the first, third, and fourth chromosome of mouse and the first chromosome of gorilla, in which the analogous color blocks correspond to the same pairwise comparison.
The analysis shows several interesting features of the comparison, for instance, (1) the human and mouse genomes are very similar and share several CSBs as seen in Figure 2 (bottom); (2) the translocations between different chromosomes, which help identify evolutionary rearrangements; and (3) how these blocks are also conserved in the first chromosome of Gorilla gorilla as seen in Figure 3. Although the evolution is not linear, the tracing of blocks could help researchers to study the history of genes and how they have been rearranged, replicated, removed, or created throughout evolution. In addition, this information could be useful to determine how far a group of species is in evolutionary terms.
To validate the accuracy of the methods from XCout, we will compare the analysis with that of the HGP. 37 At the time of publishing, they also compared the similarities between the human and mouse genome (Figure 3, top). From such comparison, we observe that not only do our methods provide an accurate result, but they also provide further interactive information regarding the subdivisions of each chromosome’s contribution.
Finally, our proposal enables to navigate through all the annotated genes located between the coordinates of the selected block (Figure 4). Afterward, selecting a gene will automatically (1) retrieve its coordinates, (2) search for genes within the matching regions of other species, and (3) display the results. In addition, there is a search function that allows to find desired products inside the selected blocks (Figure 4). We can also download sequence files for both coding and noncoding regions along with the chromosome positions, as it could be used to extract related sequences aside for future investigations.
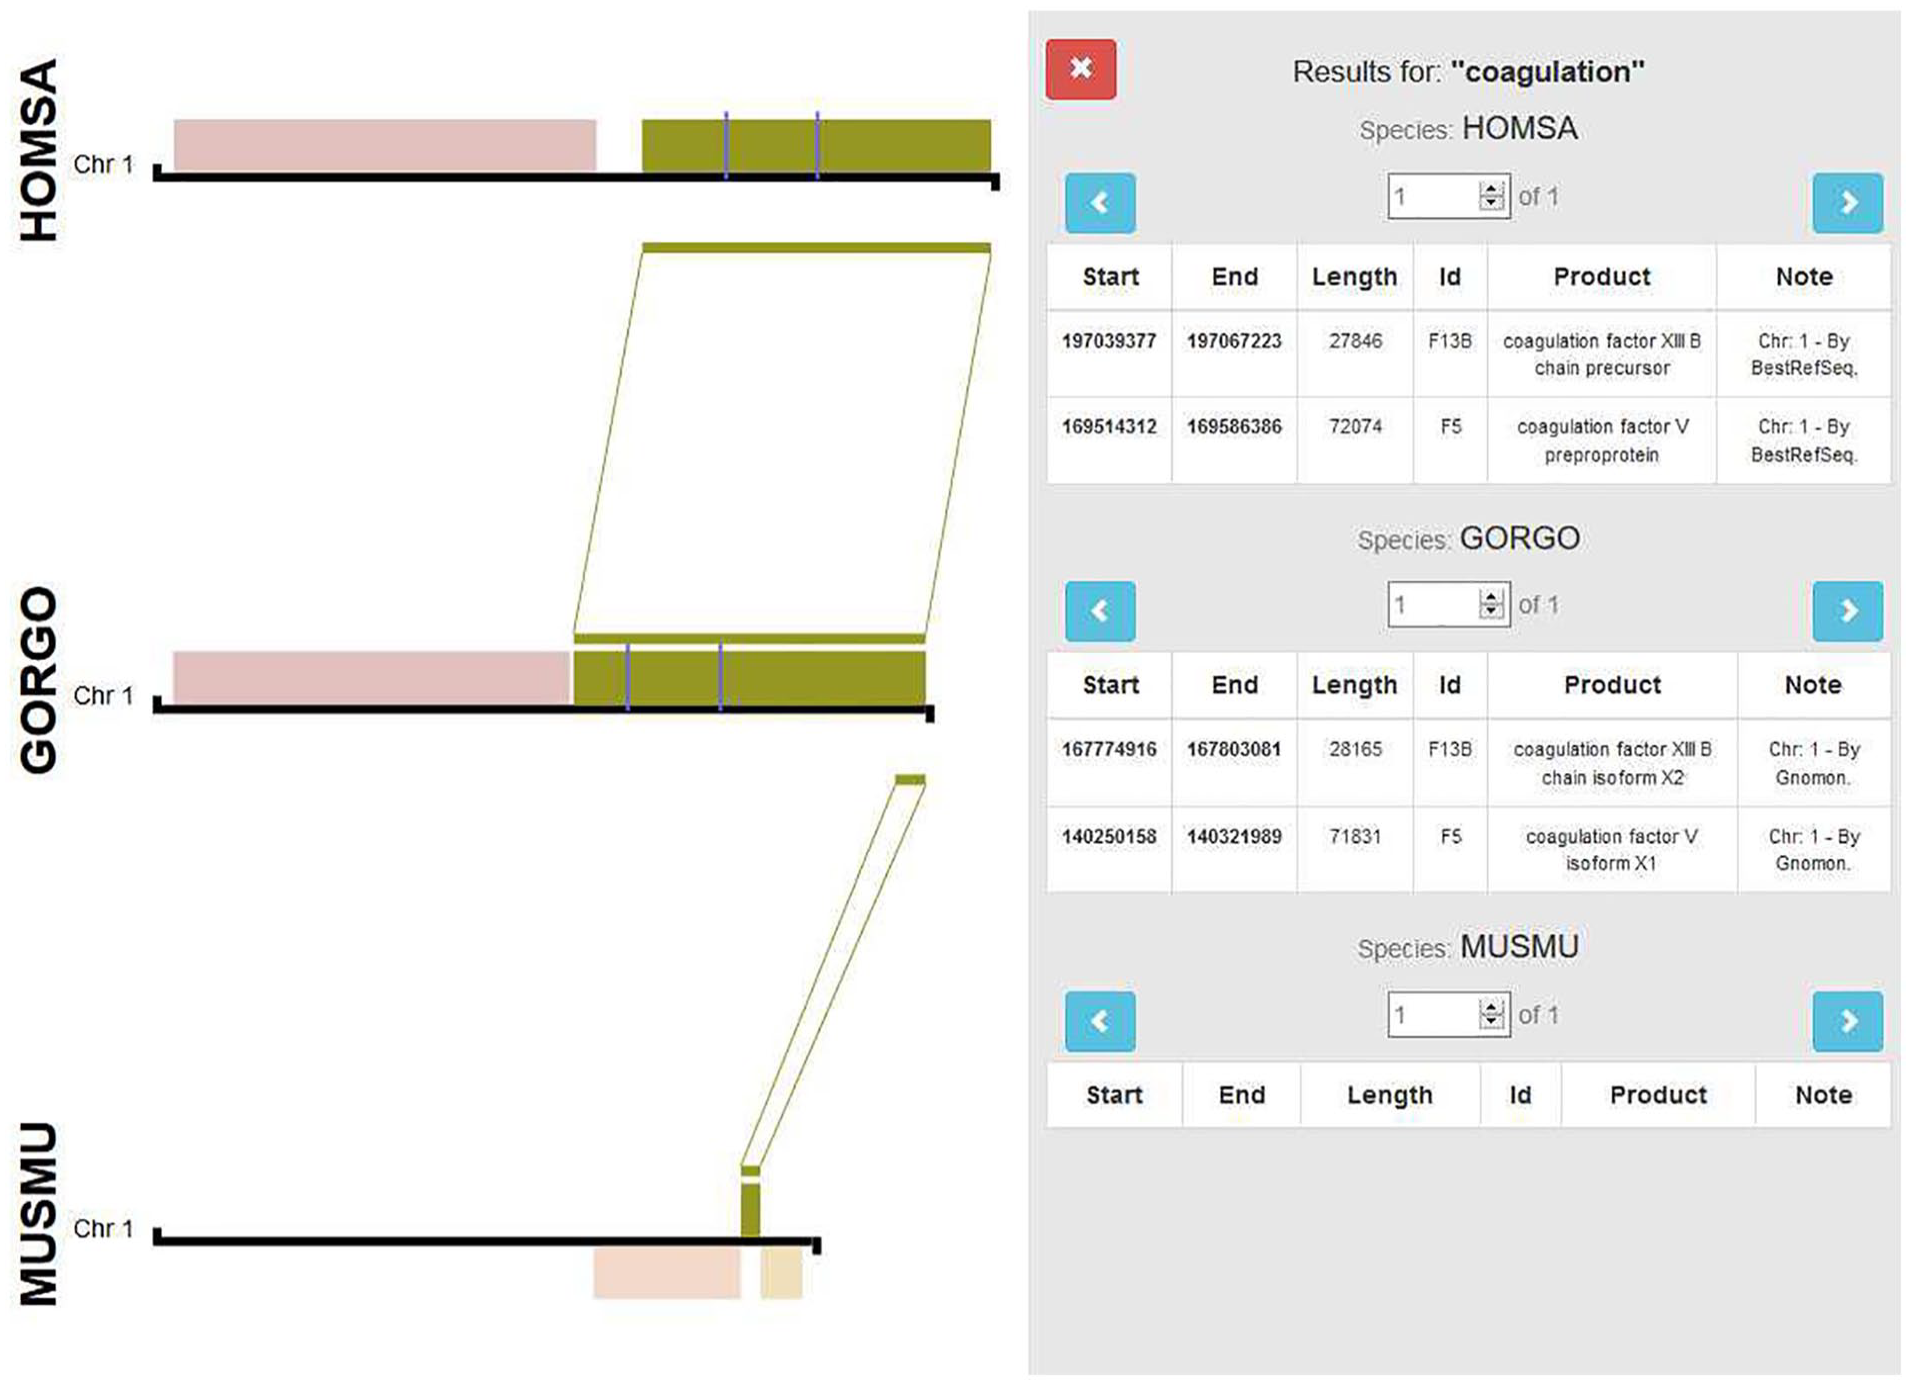
Example of the search tool capabilities to find the coagulation factors across different species, after selecting the green synteny block from Homo sapiens. For more information about features and functionality, a Supplementary Document is provided.
Discussion and Conclusions
Web technologies are constantly growing into more complete and consistent tools. The bioinformatics field has traditionally used Web services as a result of the complexity of some of its tasks. In the particular case of data analysis, Web visualization methods offer ubiquitous and multi-platform access while enabling interactivity, aesthetics, and useful results. We have combined the momentum of Web technologies and the intricacy of bioinformatics data with our point of view of the future of the Web and designed a fully integrated one-stop tool to carry out extensive comparative genomic analysis using state-of-the-art technologies in Web applications.
XCout is a Web-based application with innovative features that contribute to the field of comparative genomics and data visualization applied to bioinformatics. This software provides new methods to aid in the identification of large-scale genome rearrangements and its evolution throughout different species involving huge amounts of data. In particular, XCout provides researchers with novel tools that enable new experiments which typically require extensive manual inspection, annotation, and curation, such as the identification of significant signal in all-versus-all genomic comparisons or the automated on-demand tracking of conserved regions across several species.
These contributions include (1) the grid heatmap–based visualization, which enables to obtain a quick overview of the similarity between multiple comparisons of interest; (2) the large-scale genome rearrangement tracking system; and (3) the annotation search engine. Furthermore, XCout provides a database with up to 50 000 precomputed comparisons that can be also accessed through the API.
Throughout the different experiments, we have shown the differences and similarities between the human genome and the mouse through the grid visualization. Afterward, we focused on the contributions of Mus musculus to the first chromosome of Homo sapiens with the help of the extended cell visualization. Once the importance of chromosomes 1, 3, and 4 of Mus musculus in respect to the first chromosome of human genome was assessed, and due to the similarities found between Homo sapiens and Gorilla gorilla, specific rearrangements were tracked with the CSB Tracking System through these 3 different species to further perform an annotation search for genes related to coagulation.
In summary, the identification of these similarities and the further analysis of specific regions conserved across different species provide a more profound understanding of multiple organisms, thus unraveling new insights regarding the underpinnings of evolution and prevention of diseases, the etiology of which is related to DNA mutations.
Supplemental Material
sj-pdf-1-bbi-10.1177_11779322211021422 – Supplemental material for Unraveling Genome Evolution Throughout Visual Analysis: The XCout Portal
Supplemental material, sj-pdf-1-bbi-10.1177_11779322211021422 for Unraveling Genome Evolution Throughout Visual Analysis: The XCout Portal by Sergio Diaz-del-Pino, Esteban Perez-Wohlfeil and Oswaldo Trelles in Bioinformatics and Biology Insights
Footnotes
Acknowledgements
We wish to thank the BITLAB Group and the application testers for all their support and comments which have significantly contributed to improve this work.
Funding:
The author(s) disclosed receipt of the following financial support for the research, authorship, and/or publication of this article: This work was partially supported by the European project ELIXIR-EXCELERATE (grant no. 676559), the Spanish national project Plataforma de Recursos Biomoleculares y Bioinformáticos (ISCIII-PT13.0001.0012 and ISCIII-PT17.0009.0022), the Fondo Europeo de Desarrollo Regional (UMA18-FEDERJA-156), the Instituto de Investigación Biomédica de Málaga (IBIMA), and the University of Málaga.
Declaration of conflicting interests:
The author(s) declared no potential conflicts of interest with respect to the research, authorship, and/or publication of this article.
Author Contributions
SDdP designed and implemented the software, analyzed the state of the art solutions and wrote the paper. EP-W analyzed and interpreted the results, tested the software and wrote the paper. OT conceived and designed the experiments, analyzed and interpreted the results.
Availability
The XCout portal can be found at https://pistacho.ac.uma.es/xcout/. The source code can be found at ![]() .
.
Supplemental Material
Supplemental material for this article is available online.
References
Supplementary Material
Please find the following supplemental material available below.
For Open Access articles published under a Creative Commons License, all supplemental material carries the same license as the article it is associated with.
For non-Open Access articles published, all supplemental material carries a non-exclusive license, and permission requests for re-use of supplemental material or any part of supplemental material shall be sent directly to the copyright owner as specified in the copyright notice associated with the article.