
Abstract
Molecular phylogeny is a fundamental tool to understanding the evolution of all life forms. One common issue faced by molecular phylogeny is the lack of sufficient molecular markers. Here, we present PhyloMarker, a phylogenomic tool designed to find nuclear gene markers for the inference of phylogeny through multiple genome comparison. Around 800 candidate markers were identified by PhyloMarker through comparison of partial genomes of Microcebus and Otolemur. In experimental tests of 20 randomly selected markers, nine markers were successfully amplified by PCR and directly sequenced in all 17 nominal Microcebus species. Phylogenetic analyses of the sequence data obtained for 17 taxa and nine markers confirmed the distinct lineage inferred from previous mtDNA data. PhyloMarker has also been used by other projects including the herons (Ardeidae, Aves) phylogeny and the Wood mice (Muridae, Mammalia) phylogeny. All source code and sample data are made available at http://bioinfo-srv1.awh.unomaha.edu/phylomarker/.
Introduction
Assembling the tree of life is an ultimate goal in biology. Utilizing many nuclear gene markers that are distributed throughout different chromosomes is one of the fundamental ways to resolve incongruence in large-scale phylogenies. 1 The inclusion of additional characters from multiple independent genes could reduce sampling errors and systematic biases while reinforcing phylogenetic signals. However, only a limited number of nuclear markers are available for the analysis of deep phylogeny, especially for non-model organisms. 2 Moreover, one of the future challenges is to develop optimized procedures for the detection and selection of orthologous genes with low levels of saturation. 3
To address the above issues, Li et al 4 initiated a phylogenomic approach that systematically compares genomes to identify candidate nuclear gene markers and presented a case study in constructing a fish tree of life. This initial effort was focused on the large exon markers that are suitable for the analysis of deep phylogeny. However, other genomic markers such as introns and exon-primed intron-crossing markers are more appropriate for small-scale phylogeny and population genetics.5,6 We developed PhyloMarker, a phylogenomic tool that can be easily used by biologists to find both intron and exon markers through genome comparison. With the advent of next generation sequencing technologies, sequencing subgenomic regions or transcriptomes is becoming common practice. 7 PhyloMarker can take advantage of such large genomic databases for mining phylogenetic markers. Here, we present the conceptual algorithm of PhyloMarker and introduce its implementation and usage. Additionally, we demonstrate its utility with a case study that evaluates the phylogeny of the nominal mouse lemur species, genus Microcebus, along with summarizing the results for several vertebrate groups.
Molecular phylogeny of mouse lemurs
With advances in molecular technology and improvements of analytical tools, the number of cryptic species described in the last two decades has proliferated in many taxonomic groups (eg, amphibian and reptiles,8,9 bats, 10 fishes, 11 tenrecs 12 ). This expansion is especially true for diversity within lemur genera as the taxonomy has been dramatically revised.13–15 Found throughout Madagascar, including regions with substantial anthropogenic changes, 16 the mouse lemur, genus Microcebus, is considered the smallest, most abundant and widespread lemur. 17 Initially classified as a single species, M. murinus Miller was divided into two regionally defined species, M. murinus in the west and M. rufus in the east. 18 In the last two decades, the genus Microcebus has expanded incredibly from two to 18 species based primarily on mitochondrial DNA (mtDNA) fragment sequences and morphological data.13,14,19–25
Tattersall 26 questioned whether the increase in lemur species was taxonomic inflation and suggested that more data was needed to delimit or validate the legitimacy of these new taxa. Based on the intra- and interspecific genetic distance estimation and Population Aggregation Analysis simulation, Markolf et al 27 argued that several recently named lemur taxa should be re-evaluated with additional data from multiple nuclear and sex-specific genetic loci. Heckman et al 28 found that comparisons between mtDNA and nuclear DNA (nucDNA) data were fundamentally congruent, but incomplete lineage sorting and low mutation rates of nucDNA data may limit the phylogenetic resolution. Weisrock et al 29 verified the high lineage diversity in Microcebus based on nucDNA and mtDNA sequence data, but raised questions on the validity of M. mamiratra and suggested that additional cryptic species were included within the current distributions of M. murinus, M. myoxinus and M. simmonsi.
Until recently, only a limited number of nuclear loci have been utilized in phylogenetic studies of Microcebus, all of which were previously developed from other taxonomic groups.28,29 Although Horvath et al 30 has developed a phylogenomic “toolkit” for lemurs consisting of seven previously utilized markers and 11 novel loci, this toolkit has not been utilized extensively with lemurs. The amount of genomic sequence available generated from next generation sequencing has increased significantly, which has promoted the use of multilocus phylogenetic approaches to resolve the phylogenies of amphibians, birds, fishes, and primates.4,6,31–33 Using genomic data available in the Ensembl database, we utilized PhyloMarker to extract candidate nuclear phylogenetic markers shared between the two partial genomes of the Gray mouse lemur, Microcebus murinus, and the Northern greater galago, Otolemur garnettii, generating nucDNA sequence from nine exons to evaluate the phylogenetic relationships among 17 nominal Microcebus species.
Methods
PhyloMarker
PhyloMarker was designed to find single copy nuclear gene regions that are relatively conserved across a variety of species. The process consists of three steps: (1) exon or intron sequence extraction; (2) intra-genome comparison; and (3) inter-genome comparison (Fig. 1).
Conceptual design of PhyloMarker.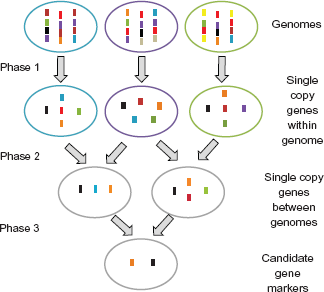
In Step 1, extraction of exon or intron sequences from GenBank input files is performed using the BioPerl package. The exon positions are available for each gene entry, which can be used to extract specific sequences. The intron positions need to be calculated from the location of consecutive exons. Extracted sequences that are longer than the user-defined sequence length and have less than 20% ambiguous nucleotides are written to a FASTA file.
In Step 2, each FASTA file acts as both the query database and the subject database with the sequences being compared using the BLAST algorithm with minor modification to compute the alignment coverage. 34 Sequences with coverage and identity values below the user-defined thresholds are extracted and written to a file that consists of single copy exons or introns for each given genome.
In Step 3, the single copy nuclear gene sequences predicted in the first or reference genome are compared to the single copy nuclear sequences from each of the subsequent genomes. Those sequences with coverage and identity values above the user-defined thresholds are extracted from the compared genomes. These pairwise single copy “orthologs” are further evaluated, and each candidate is selected only if the exon or intron from the reference genome has an ortholog from each of the other genomes. Finally, the information from the single copy nuclear gene candidates are assembled and formatted into an Excel file.
Case study in genus Microcebus
Sample collection
Seventeen tissue samples were collected from Madagascar as detailed in Andriantompohavana et al 22 and Louis et al13,14 which represent the 17 nominal Microcebus species (M. arnholdi, M. sambiranensis, M. mamiratra, M. margotmarshae, M. myoxinus, M. berthae, M. rufus, M. lehilahytsara, M. mittermeieri, M. tavaratra, M. jollyae, M. bongolavensis, M. ravelobensis, M. danfossi, M. murinus, M. griseorufus). A sample was not available for the recently described M. gerpi, and thus, was not included in this study. 25 Total genomic DNA was extracted from the tissue samples using a whole genome amplification kit (WGA; GE Healthcare, USA). Samples extracted using the WGA method, which did not yield a PCR product were re-extracted with the standard PCI protocol (phenol/chloroform isoamyl alcohol). 35
Mining for phylogenetic markers and primer design
New nuclear markers developed by PhyloMarker for mouse lemur phylogeny, with primer sequences and PCR annealing temperature (Tm).

Internal primer for sequencing.
The sequence fragments were aligned to generate consensus sequences using Sequencher 4.10 (Gene Codes Corporation, Ann Arbor, MI). All sequences (accession numbers JX017385–JX017537) have been deposited in GenBank. Single haplotypes for COII and COIII to ND4 (PAST) mtDNA fragments representing each of the 17 recognized Microcebus species were analyzed and compared to the novel nuclear gene data set.13,14,22 Comparative sequence data was mined from three taxa as follows: O. garnettii and M. murinus from the partial genomes available from Ensembl and the draft genome for the Aye-aye, Daubentonia madagascariensis. 37
Phylogenetic analysis
Sequences of nine novel nuclear markers from the 17 nominal mouse lemurs, along with two outgroups, the Northern greater galago and Aye-aye, were tested in phylogenetic analyses to evaluate their effectiveness. Sequences were aligned utilizing MAFFT according to the default settings. 38 Initial sequence comparisons and measures of variability were performed using MEGA version 4.0. 39 We analyzed three concatenated data sets as follows: nine nucDNA sequence fragments, COII and PAST mtDNA sequence fragments, and nucDNA and mtDNA sequence data sets. Phylogenetic trees were estimated from the data sets using Maximum likelihood (ML) and Bayesian inference methods, utilizing the computer packages PAUP* 4.0b10 and MrBayes v3.1.2.40–42
An optimal nucleotide substitution model for each data set was chosen using the Akaike Information Criterion as implemented in Modeltest v3.7. 43 The ML analyses were performed for each data set under the best model with PAUP 4.0b10 software. 40 A heuristic search was performed using random sequence addition (n = 10) and TBR branch swapping. We performed 1000 bootstrap replicates with TBR branch swapping to test the support for nodes in the topology.
Bayesian inference analyses were conducted using MrBayes v3.1.2.41,42 A Markov Chain Monte Carlo (MCMC) with four simultaneous chains and 5,000,000 generations was performed under the GTR+I+G model selected by MrModeltest v2.2 for the DNA sequence data set. 44 For every 100 generations, the tree with the best likelihood score was saved, resulting in 50,000 trees. Topologies prior to–-ln likelihood of equilibrium were discarded as burnin and clade posterior probabilities (PP) were computed from the remaining trees. These trees were condensed into a majority rule consensus tree using PAUP* 4.0b10. 40 Branch supports were presented as posterior probabilities on the consensus tree.
The coalescent-based Bayesian species tree inference method implemented in the software *BEAST (an extension of BEAST v1.6.1).45,46 The software *BEAST also implements a Bayesian MCMC analysis, and is able to co-estimate species trees and gene trees simultaneously. 45 The input file was formatted with the BEAUti utility included in the software package, using the same partition scheme of the concatenated analysis.
Although *BEAST does not require the inclusion of outgroups for rooting purposes, Northern greater galago and Aye-aye sequences were incorporated in the analysis. The *BEAST analysis was conducted utilizing a strict molecular clock model (no loci violated a strict clock assumption, data not shown), a random starting tree, and a speciation Yule process as the tree prior. In the absence of an independent and reliable calibration point (ie, dated fossil record), relative evolutionary rates (ie, branch lengths) were estimated in substitutions per site by setting the mean clock rate equal to 1.0 following Drummond and Rambaut. 46 The final analysis was run for 500 million generations, with 50 million trees discarded as burnin with every five thousandth tree kept thereafter. Convergence of the MCMC was assessed by examining trace plots and histograms in Tracer v1.5 after obtaining an effective sample size greater than 200 for all model parameters. 47 A maximum clade credibility tree was generated using the program TreeAnnotator v1.6.1 provided in the BEAST package, with a burnin of 5000 (10%) and visualized in FigTree v1.3.1.46,48
Results
PhyloMarker development
Two versions of PhyloMarker were developed with the same core procedures. The Web PhyloMarker was built using the LAMP (Linux, Apache, MySQL and Perl/PHP) architecture. The standalone PhyloMarker was programmed in PERL. The latest version of PhyloMarker has many improvements including a global function controlling all the procedures, updated coverage/identity and sequence extraction algorithms, the coverage and identity flags separated for single copy exon and ortholog comparisons, and the ability to use more than two genome data sequence files simultaneously. PhyloMarker can be used for either exon or intron marker searches. The bioinformatics pipeline is presented in Figure 1.
PhyloMarker uses NCBI BLAST core programs for sequence comparison. The program was tested with BLAST 2.2.24, but other versions prior to BLAST+ should work as well. For standalone PhyloMarker, the user needs to download the BLAST package from NCBI (ftp://ftp.ncbi.nlm.nih.gov/blast/executables/release/2.2.24/) and install it on a local computer. Several additional PERL packages, including BioPerl, Data, Error, and FindBin, that are used in PhyloMarker are available via CPAN (Comprehensive Perl Archive Network, http://www.cpan.org/).
The use of PhyloMarker
To run Web PhyloMarker, the following four steps are necessary: selecting marker type (exon or intron), choosing data type, setting up parameters, and uploading files (Fig. 2A). For selecting data type, the program accepts either GenBank or FASTA format. The GenBank files are usually much larger and thus Web PhyloMarker requires gunzipped (gzipped) files as input. The gzipped files of genomes can be downloaded from Ensembl (http://www.ensembl.org/info/data/ftp/index.html). Genome sequences downloaded from NCBI (ftp://ftp.ncbi.nih.gov/genomes/) or other public repositories need to be gzipped for Web PhyloMarker to use. Alternatively, Web PhyloMarker accepts sequences in FASTA format, a universal data format for nucleotide and protein sequences. This feature is particularly useful for high throughput sequence data. The Web PhyloMarker program is suitable for a data set less than 10 MB.
PhyloMarker Web Tool input page (A), result page (B), and resulting Excel table (C).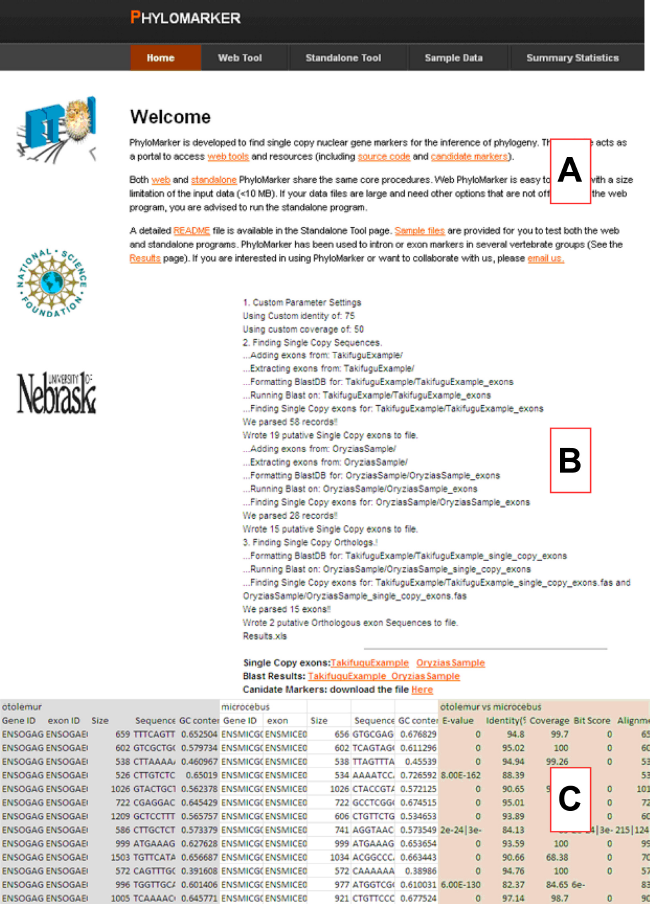
For parameter settings, the user needs to provide the maximum and minimum size of the markers and the minimum sequence identity and coverage values used to identify orthologous genes (inter-genome comparison). Setting identity and coverage values to isolate single copy genes (intra-genome comparison) is currently not available in Web PhyloMarker.
The last steps are to decide the number of genomes to compare and to upload the files. Once the number of genomes is entered, click “Ok”, and the user can upload sequence files in either gzipped GenBank format or FASTA format. Once the “Run PhyloMarker” button is clicked, Web PhyloMarker will be executed with the results page displayed (Fig. 2B). Several links will be shown at the bottom of this page where the user can download single copy exons (or introns) in each genome, pairwise Blast results, and candidate markers. The resulting Excel file includes detailed information of the markers as follows: Gene ID, Intron or Exon ID, GC content, sequences, identity and coverage (Fig. 2C).
To run the standalone PhyloMarker, only a few steps are required. A detailed readme file with instructions is provided to demonstrate how to utilize PhyloMarker. The PhyloMarker program and the readme file can be downloaded from the “Standalone Tool” page. We have also created small tutorial files located on the “Testing” page.
Genus Microcebus as a test case for PhyloMarker
Genomic statistics and the numbers of single copy genes and candidate markers identified by PhyloMarker in three vertebrate groups.

Summary information of nine novel exon genes identified by PhyloMarker amplified in the 17 nominal Microcebus species. *

bp, base pairs; var., variable sites (Ingroup + Outgroup/Ingroup); PI, parsimony informative sites (Ingroup + Outgroup/Ingroup); Genetic distance, average uncorrected distance (Ingroup + Outgroup/Ingroup).
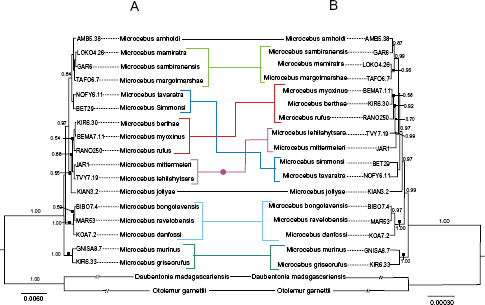
Using concatenated sequences of all nine nucDNA markers (8,007 bp), a phylogeny of the 17 nominal Microcebus species in addition to two outgroups was inferred (Fig. 3A). The taxonomic framework of the nucDNA phylogeny was mostly congruent to the phylogenetic tree based on COII and PAST fragment combined mtDNA data with most of the differences confined to shifts among groups of species (Fig. 3 and 4). A multispecies coalescent approach was taken to infer the most likely species tree on the basis of gene tree topologies estimated for each molecular marker as obtained with *BEAST (Fig. 5). Compared to the phylogenetic tree based solely on mtDNA sequence data, most sister taxa relationships in Figure 5 are congruent to Figure 3B except for the position of M. tavaratra and M. simmonsi. The phylogenetic relationships among 17 nominal Microcebus species inferred from species tree and concatenated analyses followed a regional geographic distribution except for M. tavaratra and M. jollyae. For the nuclear and mtDNA combined data set, both phylogenetic tree and species tree are congruent (Figs. 4 and 5B).
Phylogenetic relationships among the 17 recognized Microcebus species inferred from maximum likelihood and Bayesian approaches, utilizing the combined sequence data of nine novel nucDNA genes identified by PhyloMarker (A) and mtDNA COII and PAST fragments (B) for 18 mouse lemur individuals with two outgroup taxa. Phylogenetic relationships among Microcebus species inferred from the ML and Bayesian approaches for the concatenated nucDNA gene identified by PhyloMarker and mtDNA combined sequence data from 17 mouse lemur individuals with two outgroup taxa. Maximum clade credibility phylogeny of the genus Microcebus inferred by the *BEAST species tree analyses of nine concatenated nucDNA genes identified by PhyloMarker from 18 mouse lemur individuals with two outgroup taxa (A) and nuclear gene identified by PhyloMarker and mtDNA combined sequence data from 17 mouse lemur individuals with 2 outgroup taxa (B).

Discussion
PhyloMarker is a unique tool that can be used to find and develop single copy nuclear gene markers for the inference of large scale phylogenies. The computer package has been used by several research programs to identify phylogenetic markers in model based mammals and birds to be utilized in specific non-model species (Table 2). For instance, the complete genomes of chicken and zebra finch were compared and identified 730 exon markers and 37 intron candidate markers for heron phylogeny (http://bioinfo-srv1.awh.unomaha.edu/phylomarker/results.php). Furthermore, a comparison of rat and mouse genomes resulted in 1,038 exon and 595 intron candidate markers for Wood mice phylogeny. Another salient feature of PhyloMarker is its utility to identify duplicated genes through intra-genome comparison, an important task in the study of molecular evolution and species phylogeny. Moreover, PhyloMarker can take advantage of high throughput genomic or transcriptomic sequence data to select candidate phylogenetic markers, as long as the assembled sequences are in the FASTA format. In regard to future upgrades, we will incorporate algorithms to improve sensitivity and accuracy for sequence comparison and add support for newer versions of BLAST+. The chromosomal positions of candidate markers are currently not included in the resulting Excel file. A utility is needed to parse the chromosome information and display the distribution of the markers as a chromosome map. The source code is available and users are welcome to test PhyloMarker.
In regards to the genus Microcebus case study, lemur taxonomy has been dramatically revised due to extensive field work to previously unexplored regions and to advances in molecular technology, primarily centered on mtDNA sequencing and analyses. Consequently, the number of lemur species described in the past three decades has increased from 36 to 101 species.49,50 This proliferation has been questioned as to whether or not the recently described lemurs were unnoticed cryptic species or taxonomic inflation.26,27 There are many potential sources of discrepancy between gene trees and species trees that contribute to this argument, including unresolved genetic issues pertaining to horizontal transfer, lineage sorting, and gene duplication or loss.28,45,51,52
In this study, we verified the phylogeny, as previously defined by mtDNA analyses, of the current 17 Microcebus species using nine novel nuclear loci identified with PhyloMarker. Incongruence between mtDNA and nucDNA data sets was primarily related to alternative linkages between identical groups of species. However, the original criteria for defining these species including character state differences and geographic barriers were not altered, but simply augmented. Debates continue to simmer regarding the validity of lemur taxonomic revisions with important management and conservation decisions dependent on a miniscule percentage of each taxon's genome. With advances in next generation sequencing, additional prosimian genomes will become available to extract comparable single copy exons and introns that function across all lemur taxa. PhyloMarker provides a practical utility to extract numerous single copy genes from large repositories of sequence data across multiple distant or closely related taxa, thus enabling future scientific decisions to be based on sound information.
Conclusion
PhyloMarker, a phylogenomic tool, is introduced to find single copy nuclear gene markers through genome comparison. It involves intra-genome comparison for detecting single copy exons or introns and inter-genome comparison for orthologous markers. The software is flexible and user friendly since the user can set different threshold values for marker identification and has both web and standalone versions of the same core program. Source code and sample data are available at the project website: http://bioinfo-srv1.awh.unomaha.edu/phylomarker/. Users are encouraged to test PhyloMarker, along with suggesting new features that can be included in future upgrades. The power of PhyloMarker in mining new markers for the inference of reliable phylogeny was demonstrated in the case study of mouse lemurs, genus Microcebus. Furthermore, additional candidate markers for fish (puffer fish versus rice fish), birds (chicken versus zebra finch), and rodents (mouse versus rat) were developed using PhyloMarker are also available at the project website.
Funding
The development of PhyloMarker was supported by the National Science Foundation (DEB-0732838) and by the University Committee on Research and Creative Activity (UCRCA) at the University of Nebraska at Omaha. The phylogeny of mouse lemur was supported by a grant from Ahmanson Foundation and the generosity of Bill and Berniece Grewcock and the Theodore F. and Claire M. Hubbard Family Foundation.
Author Contributions
Conceived and designed the experiments: GL, EEL, and RL. Developed the software: TWR. Generated and analyzed the data: RL, LZ, CAB, SEE, MLW, MCC and GHP. Wrote the manuscript: EEL, GL, RL, CAB, SEE, MLW, and TWL. All authors reviewed and approved of the final manuscript.
Competing Interests
GP has a grant or grant pending from NSF. Other authors disclose no potential conflicting interests.
Footnotes
Acknowledgements
The authors are particularly grateful to C. Li for his initiation of the project and acknowledge F. J. Potmesil and G. Zhang for their help with programming. We would also like to acknowledge G. Orti and other users who beta tested PhyloMarker and provided us feedback. We would like to thank the staff, field assistants and drivers of the Madagascar Biodiversity Partnership for the dedication in collecting the necessary samples in Madagascar, and the staff at the Grewcock Center for Conservation and Research at Omaha's Henry Doorly Zoo and Aquarium for their expertise with sequence generation. We would like to thank the Ministère des Eaux et Forêts of Madagascar and USFWS for assistance in issuing the necessary collection, exportation and importation permits.
As a requirement of publication authors have provided to the publisher signed confirmation of compliance with legal and ethical obligations including but not limited to the following: authorship and contributorship, conflicts of interest, privacy and confidentiality and (where applicable) protection of human and animal research subjects. The authors have read and confirmed their agreement with the ICMJE authorship and conflict of interest criteria. The authors have also confirmed that this article is unique and not under consideration or published in any other publication, and that they have permission from rights holders to reproduce any copyrighted material. Any disclosures are made in this section. The external blind peer reviewers report no conflicts of interest.