
Abstract
The eclosion of data acquisition technologies has shifted the bottleneck in molecular biology research from data acquisition to data analysis. Such is the case in Comparative Genomics, where sequence analysis has transitioned from genes to genomes of several orders of magnitude larger. This fact has revealed the need to adapt software to work with huge experiments efficiently and to incorporate new data-analysis strategies to manage results from such studies. In previous works, we presented GECKO, a software to compare large sequences; now we address the representation, browsing, data exploration, and post-processing of the massive amount of information derived from such comparisons. GECKO-MGV is a web-based application organized as client-server architecture. It is aimed at visual analysis of the results from both pairwise and multiple sequences comparison studies combining a set of common commands for image exploration with improved state-of-the-art solutions. In addition, GECKO-MGV integrates different visualization analysis tools while exploiting the concept of layers to display multiple genome comparison datasets. Moreover, the software is endowed with capabilities for contacting external-proprietary and third-party services for further data post-processing and also presents a method to display a timeline of large-scale evolutionary events. As proof-of-concept, we present 2 exercises using bacterial and mammalian genomes which depict the capabilities of GECKO-MGV to perform in-depth, customizable analyses on the fly using web technologies. The first exercise is mainly descriptive and is carried out over bacterial genomes, whereas the second one aims to show the ability to deal with large sequence comparisons. In this case, we display results from the comparison of the first Homo sapiens chromosome against the first 5 chromosomes of Mus musculus.
Keywords
Introduction
New DNA sequencing technologies have propelled the identification of full genome sequences.1,2 Part of the data processing pipeline for this large sequences includes visualization of the main relationships identified by comparison algorithms, both in pairwise and multiple sequence comparison studies.
Traditionally, this kind of data-visualization software targeted to display similar segments, repetitions, and small variations as the main micro-evolution event in genes and proteins. However, technology advances have extended the framework to genome level to disclose also large rearrangements such as repetitions, inversions, translocations, transpositions, or in other words the large evolution events with the ultimate purpose to elucidate evolutionary relationships between species.
Nowadays, typical comparative genomics studies involve comparing 2 or more genome sequences to identify shared blocks, determine synteny blocks, refine their borders, identify the type of evolutionary events, etc. These tasks are performed, among other things, to assess similarities between the genomes of interest. For instance, by comparing one chromosome of one species to all of the chromosomes of another organism, the independently inherited chunks of DNA originated because multiple evolutionary events could be detected.
The strategy to display the results of sequence comparison algorithms graphically is commonly referred to as dotplot. 3 In a dotplot representation, one of the sequences is aligned along the horizontal axis, whereas the other sequence is aligned along the vertical axis. Then, a dot is drawn where a match between 2 residues from 2 different sequences occurs. For several years, this method was widely used for pairwise sequence comparison of genes and proteins. Subsequently, a number of improvements were made to both the underlying algorithms4,5 and the resulting visualization.6,7 However, because of the increasing length of input sequences and the growing complexity of the procedure, the analysis of long sequences became unfeasible and attention was turned from computing residue matches to subsegments of a pair of sequence that share a high level of similarity, known as high-scoring segment pairs (HSPs). The graphical representation of HSPs or fragments has the same visual effect, with the advantage that HSPs calculation is computationally faster. 8
DOTTER 9 appeared as the first non-static dotplot-like visualization approach. Mauve10,11 modified DOTTERs visualization approach by arranging genomes in horizontal lines and calculating local collinear blocks (LCBs), which are homologous regions shared by 2 or more genomes. Similarly, Gepard 12 includes an internal algorithm that compares genomic sequences by exploring the coordinates of genes and proteins provided by the user. In addition, it includes a user-friendly interface to visualize the computed similarities. 13 In the last few years, some different approaches have been presented to facilitate the interpretation of genome comparisons through visualizations: Narcisse 14 is a web-based visualizer for a set of precomputed comparisons aimed to identify similarities; SynTView 15 targets the visualization of single-nucleotide polymorphisms in microbial genomes; ACT, 16 which works with BLAST comparisons but lacks interactive visualization; MUMmer, 17 EasyFig, 18 and CIRCOS 19 apply similar approaches each one using a different type of static visualization, horizontal and circular, of the commonly called dotplot. Likewise, alternative visualization techniques to the dotplot have been implemented by: Panaconda, 20 which graphs syntenic gene families; Smash, 21 chromosomal display of genomic rearrangements; or VISTA, 22 a curve-based visualization technique to analyze orthologous sequence comparisons.
In this article, we present a new approach that extends the capabilities of traditional tools for visually representing and exploring the relationships between large and multiple genomic sequences disclosed by comparison algorithms. This new tool enables completely dynamic interaction with the user and allows to zoom, filter, select, and search for fragments using functional annotations. Furthermore, GECKO-MGV has been developed to deal with comparison file sizes which go from bacteria to large mammalian chromosomes. With all the benefits of a Web-based Client-Server platform developed using state-of-the-art technologies, GECKO-MGV is proposed as a solution for the analysis of comparative genomics puzzle. It merges improved state-of-the-art approaches with newcomer ideas in the field as (1) layered image representation, (2) web-interaction, and (3) post-processing built-in services. To the best of our knowledge, this is the first software tool to incorporate the concept of layered image representation, which is commonly used in image edition tools, to display pairwise and multiple genome comparison on the same canvas and session. In addition, this software tool offers a simple way to extend and customize the existing set of post-processing tools in the market. We illustrate the capabilities of GECKO-MGV in 2 guide exercises and describe in more detail in the user-guide tutorial.
System and Methods
System architecture
GECKO-MGV is based on a traditional Client-Server architecture (see Figure 1). The Client side runs in the local web-browser, where simple tasks such as filtering, zooming, and searching for functional annotations are performed. Heavier and more complex workloads are delegated to the server side via web services. The results yielded by these services are stored in the server side and sent back, as requested by the user, to the client for visualization.

Client-server architecture of GECKO-MGV.
Client side components
The Client platform is composed of several independent modules that execute specific components of the application: Files, Canvas, and Matrices.
Canvas Manager: This component displays the results of comparative analysis on the main canvas. It provides a vertical and a horizontal view. Based on the concept of layered image representation, Canvas Manager can manage one (pairwise comparison) or a full set of multiple comparisons by switching on/off the layers associated with each dataset. Then, operations (i.e. zooming, selection) are performed on the active layers.
Matrix Manager: This module represents and manages different types of matrix data, that is, the fragment distribution matrix (FDM) generated by GECKO and how the score changes along the fragment. The FDM produced automatically by GECKO displays the distribution of fragments by length and percentage of identity for each pairwise comparison (including random fragments); therefore, it can be used to obtain customized thresholds for statistical significance filtering and represent the position of the selected fragments on the image.
File Manager: This module is in charge of all the processes related to local and remote files management. From data up/download and CSV processing, to file previsualization and CRUD operations.
Evolutionary Events Manager (EE): The EE Manager is a prototype module that shows how the EE occurred over the years. The EEs are calculated by our proprietary external service (currently in beta version) and merged with regular fragment files. Once the sequence of EEs is available, the program can revert and display them step-by-step. We refer to it as a prototype in the sense that we use it to illustrate how to incorporate new visualization procedures. An example of this module is described in the Supplementary Material.
The client side architecture is completed with its main module. The Client Manager not only implements interactivity actions but also coordinates the activity of the other modules. Therefore, any functionality related to the interactive interface, ranging from the management of tables using information about EEs and HSPs to other traditional tasks such as applying filters and going back and forward in zoomed comparison, is processed in this module.
Server side components
In a similar way to the Client platform, the Server platform also has a modular organization with 3 main sections that control the File system, authentication tasks, and Services. On top of them is the core module, MGV (Multiple Genome Viewer), which enables interaction with the Client platform by accepting its requests and in turn launching the adequate process to solve it and return a response. In few words, this module is the interface between the Client and the services provided by the Server platform.
File System: This module executes file management tasks in the server like creating, deleting, or opening files for upload/download. One of the main tasks of this module is to control user access to files once the required credentials have been awarded.
Services: This module is in charge of managing all the executions related to proprietary and third-party services for further analysis. The purpose is to allow GECKO-MGV to be extended with useful services related to genome comparison as aligners, sequence extraction, repetitions finder, etc. Thus, proprietary services are usually executed in the same server as GECKO-MGV while third-party services are usually executed through web-service calls, the results of both of them are stored in the GECKO-MGV file system. A set of tools is already registered in our instance of GECKO-MGV, but it could be easily extended by registering new ones to satisfy the user necessities. An example of this process is available in the Supplementary Material.
Authentication. This module provides a secure way to store and retrieve user information. It is build up on the authentication service provided by Django. Login, user session, cookies usage, etc are controlled by this module. A non-registered user is unable to access the File System or execute Services, yet the user is able to load local comparison files.
The GECKO-MGV workflow
GECKO-MGV (standing for Multi Genome Viewer) integrated in the GECKO Suite8,23 interactively displays, browses, and analyzes the results of genome comparison produced by GECKO or equivalent software (e.g. BLAST) using a simple format translation program. In both cases, the main data source are the HSPs or ungapped fragments file(s) containing the common fragment coordinates of the set of genomes used as input data in the sequence comparison software (see Figure 2, blocks 1 and 2).

Full workflow: (1) the process starts with 2 or more genome input files; (2) then HSPs are calculated either using the GECKO software suite or any other equivalent software; (3) next, the resulting files, such as fragment files, fragment distribution matrix, and evolutionary events, are loaded in GECKO-MGV to start the analysis. The analysis may involve the steps depicted on the right side of the figure (eg, browsing, filtering). HSP indicates high-scoring segment pair.
The pairwise sequence comparison workflow (GECKO), the basis of the GECKO software suite, is a modular application that accurately and rapidly computes similar regions or HSPs shared by 2 genomes. In the same suite, different tools collect GECKOs output and add complementary information extracted from the detected HSPs, for instance: (1) computationally detected synteny blocks and breakpoints; or (2) general evolutionary events (EE) such as inversions, transpositions, reverted transpositions, and duplications. Functional annotations and other complementary files can also be incorporated during the visualization to provide further insight regarding the pairwise comparison.
General functionalities
GECKO-MGV acts as a final step from the GECKO Suite workflow; however, it enables the user to perform an in-depth analysis of the obtained pairwise comparison results (block (3) in Figure 3). The user may make use of the following functionalities of the software once the comparison has been loaded: (1) browsing; (2) zooming; (3) fragment filtering, extension, selection, and extraction; (4) load annotations; and (5) create new layers on demand during the upload of a comparison.
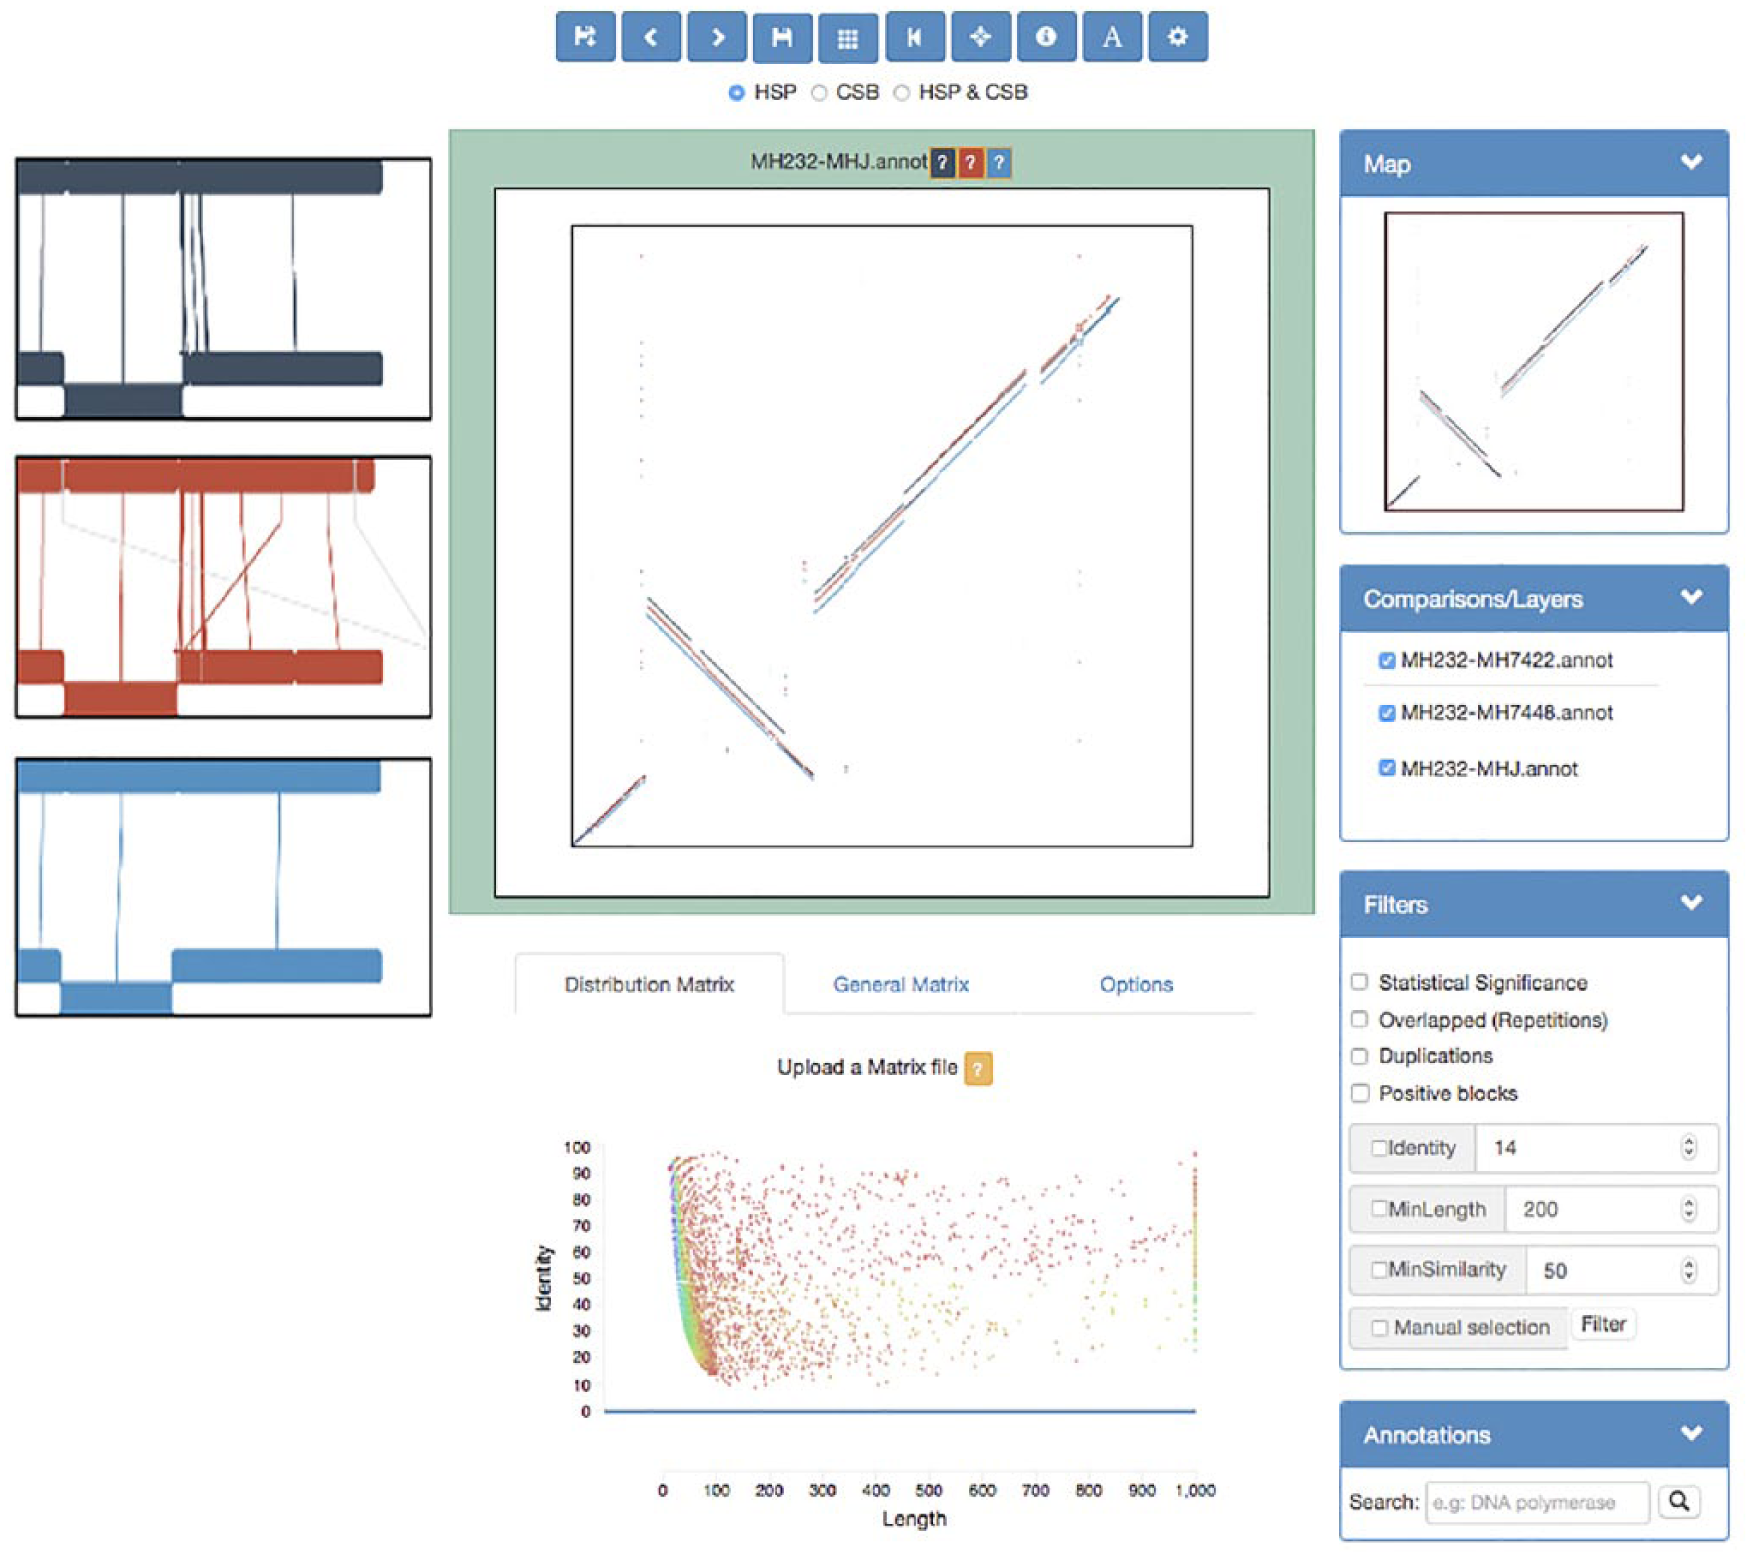
The main screen layout of the program: the horizontal views, on the left, of the comparisons loaded; the vertical view in the center with each comparison in a different layer and different color and the matrix representation of fragments distribution by identity and length. On the right side, we can find several menus to ease the use of the viewer: an interactive map and filtering and layering options.
Post-processing functionalities
This software can be set up together with proprietary and external post-processing services. The results provided by these post-processing services, whose main function is the exploratory data analysis of genome comparison results (GECKO included), are stored in the user storage space of the server. Therefore, to continue the analysis, it is not necessary to download and upload the results (more details about the execution of external services are provided in the guided exercise). Accordingly, this article is particularly focused on the structure and capabilities of the visualization software.
Implementation
Client side
To develop this platform, we used a regular HTML5 structure 24 combined with a customized CSS3 25 design based on Bootstrap library. Pure JavaScript was used to develop time-bounded functions such as the ones executed in the Canvas Painter module while the well-known jQuery 26 JavaScript library was used for user interaction and web structure management. D3.js, 27 a Javascript Library for data visualization, was used in the Matrix Painter module. Papa Parse 28 and SlickGrid 29 are used in the File and table Manager because of performance improvements related to multithread CSV processing and lazy loading techniques.
Layers are not available per se and they need to be built up programmatically by the developer. In GECKO-MGV, layers were implemented using a different Canvas for each layer, representing the generated data using pure JavaScript functions. This concept allows users to switch on-off layers of their interest, track every action and continuously have a complete overview of the study without the need of navigating via other windows or tabs. Also, all layers can be activated to analyze multiple genome comparison results. It is worth mentioning that data filters can be applied to all active layers, either to the layer in a pairwise comparison or to all the active ones in a multiple genome comparison scenario.
Another innovative contribution of GECKO-MGV (see Figure 3) in the field of visualization of genome comparison data is the possibility of navigating through the evolutionary events (EE) history. Using the reverse order of the EE of interest, the user can study the blocks involved in the rearrangements detected step by step. Moving back or forward through the EEs history allows the user to focus on the blocks that might be of interest for deeper analysis. This visualization has been developed also using the Canvas API 30 combined with jQuery.
Server side
The backend or server implementation was developed using Django 31 as the backbone of the server software, which is a Python framework specially designed for Web applications. Django simplifies the development of certain web-application modules, allowing the developer to focus on specific components of the application.
Data post-processing services are mainly supported by Django, which enables entering input parameters, running processes, and displaying the results using a combination of the Django Forms Engine, 32 the Subprocess module, 33 and the Django Template Engine. 34 Each post-processing service is executed in parallel with the main thread so the user has a non-blocking experience and whose unique dependency limitation relies on the server capacity.
The use of Python, which is becoming increasingly popular in bioinformatics,35-37 also provided us access to a great variety of useful existing modules and the possibility to allow the user to develop his owns. In this way, to demonstrate the possibility of executing third-party services, an example of registering the Clustal Omega 38 Web service is available in the Supplementary Material.
Results
Two exercises have been carried out to demonstrate the capabilities of GECKO-MGV (step-by-step descriptions of these exercises are detailed in the Supplementary Material). In the first one, we will identify and extract a collection of repeated fragments, in a group of bacteria, that contain a specific annotation. Several services will be executed to extract the primary sequences belonging to these fragments, perform a multiple sequence alignment, and display the results interactively. For the second exercise, we will use the layers concept to visualize different chunks of DNA that are common between different mammalian chromosomes while appreciating different chromosomal mutations (translocations, deletion, insertion, or inversion).
First exercise: finding annotated repetitions
Transposases are enzymes that catalyze the movement of transposons, which are DNA sequences that can change its position within a genome. These enzymes can create or reverse mutations and alter the cells’ genetic identity and genome size. This phenomenon is known as transposition and it is important in creating a genetic diversity within species and adaptability to changing living conditions. The genes that encode transposases are the most abundant genes known and are widespread in the genomes of most organisms. 39 Due to the biological relevance of these enzymes, we have decided to compare different strains of the Mycoplasma hyopneumoniae with the GECKO Workflow through the GECKO-MGV interface and postprocess the results to narrow the identification of these genes.
In this post-process, length and similarity filters are applied to filter irrelevant data after loading the multiple pairwise comparisons. Afterward, we select a layer of interest and load the annotations associated with the reference genome of such comparison and proceed to activate the visualization of annotations. From there on, the user can zoom in and navigate to visualize the region of interest, which in this case are the regions annotated with transposase. Once found, the fragments that match our criteria can be selected and extracted. All of these steps are performed throughout the interactive and handy canvas display of GECKO-MGV (see Figure 4).
Canvas when selecting a group of repeated fragments from a multiple-comparison of 4 mycoplasma strains.
At this point, the repetitions of transposase genes have been selected. The next step is to upload them to the server as a new file and, consequently, run the Extract Sequences from CSV service to obtain the multifasta that belongs to the selection of these fragments. Thereupon, the MUSCLE service is executed to perform a multiple sequence alignment (MSA). The results can be seen by the user using an interactive view of the MSA from the File Manager (see Figure 5). From these results, the user can appreciate that the selected fragments correspond to very similar sequences that are scattered throughout different loci within the reference genome.

Multiple sequence alignment visualization from the File Manager of the selected transposase repetitions.
Second exercise: mammalian chromosome comparison
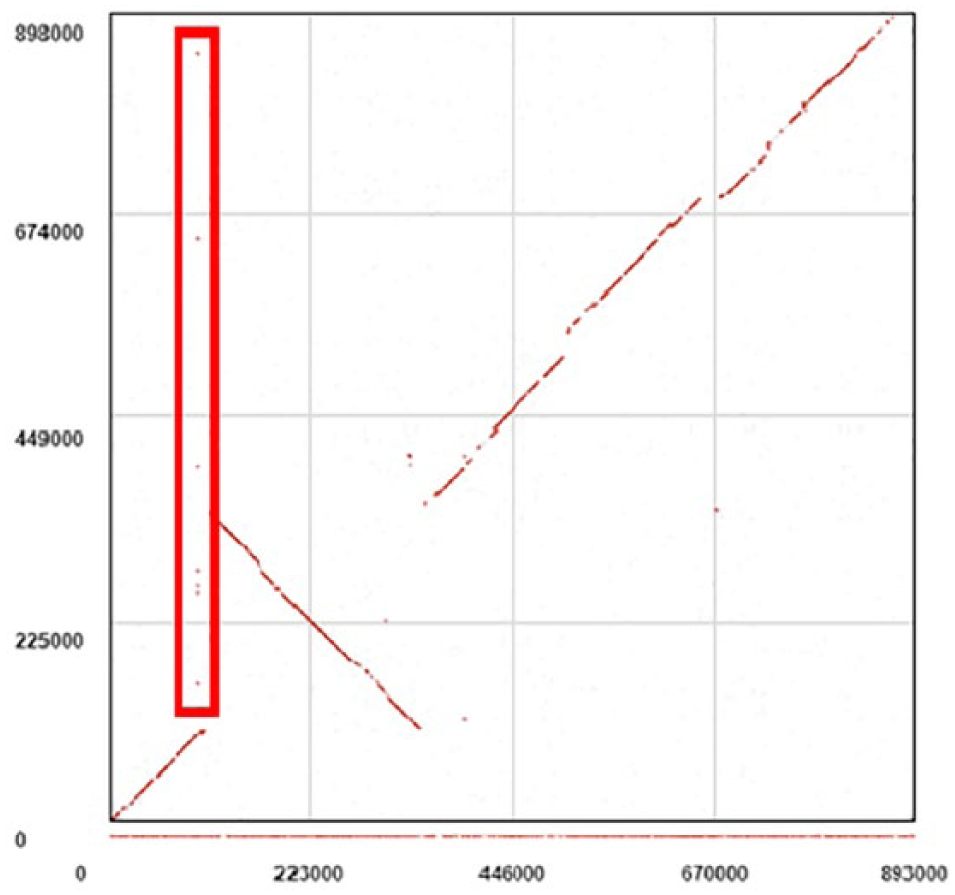
The GECKO workflow has been executed to compare the first chromosome of Homo sapiens against all of the chromosomes of Mus musculus to obtain multiple pairwise-comparison results in larger genomes. Visualizing the dotplot representation for each comparison individually, we observe that only a few chromosomes present a highly conserved signal (see Figure 6). It would be very interesting to see all of these signals together at the same time to apprehend the chromosomal mutations that have to take place to rearrange the M musculus chromosomes to observe their possible contribution to the first chromosome of H sapiens. To achieve this, we will load these multiple pairwise comparison into GECKO-MGV.

Canvas when selecting a group of repeated fragments from a multiple-comparison of 4 mycoplasma strains.
Each comparison result that contains a highly conserved signal of conserved DNA is loaded into the application, adding one layer for each pairwise comparison. We then proceed to activate the grid to have a better perception of where we are in the reference genome.
After all the comparisons have been loaded, we can observe that there are chunks of DNA for each comparison throughout the whole X axis, which belongs to the first chromosome of the H sapiens. By now, we can observe in the canvas that the first chromosome of H sapiens shares genomic regions between different chromosomes from the M musculus. Such regions have inherited independently into different chromosomes due to evolutionary events (see Figure 6).
These conserved regions can be selected to determine what type of chromosomal rearrangements have taken place. For instance, the signal that corresponds to the chromosome ORANGE of M musculus is mostly inverted when compared to the H sapiens first chromosome. Also, the chromosome DARK BLUE has a translocation and an inversion when compared to the H sapiens first chromosome. Moreover, the chromosome LIGHT BLUE presents a translocation within itself and a fragment between these chunks is now present in the chromosome GREEN of M musculus. It is important to recall that all of these interpretations are based on the selected reference genome, in this case the first chromosome of H sapiens.
Discussion and Conclusions
In the era of ubiquitous access and the diversity of devices, Web browsers have become the central access point to distributed resources. Web technologies are continuously evolving and offering a more consistent and wider range of options. Bioinformatics has traditionally used Web technologies such as Web-Services due to the complexity of some of its tasks. In the particular case of multiple pairwise genome comparison, customized user-friendly and easily usable tools for the biologists are required due to the complexity and volume of the analyzed data. The combination of the popularity of the Web technologies and the data complexity, together with our point of view of the future of the Web, has resulted in this Web-based Client-server application.
Visual representation for genome comparison is very useful by providing a quick overview regarding the similarity between sequences and allows the user to overview the evolutionary events produced without requiring extra computational methods. However, the use of complementary software becomes necessary in several cases due to the complexity of the analysis. The combination of different points of view along with the opportunity to post-process the data and use it as feedback gives GECKO-MGV a recursive nature for in-depth analysis.
GECKO-MGV results in an integrated tool, developed with state-of-the-art technologies in Web applications for in-depth genome comparison analysis, which goes from bacteria to large mammalian chromosomes. Its interface is completely responsive, interactive, user-friendly, and is compatible with the majority of Web browsers. Furthermore, for the first time in this type of applications, we are using the concept of layers. This concept allows users analyze each layer independently, or all of them as a single integrated dataset. Additional important features are the combination of multiple interconnected interactive views at the same time and the possibility to extend the analysis using proprietary and third-party services. GECKO-MGV has been designed in such a way that future visual representations or third-party services can be easily included.
We consider that Web technologies represent not just the present but also the future of applications, because of its accessibility and ubiquity. However, we are conscious of its limitations, such as the limited processing power in the client side, the management of huge amounts of data, and its visualization. These limitations motivate to start thinking about how these problems can be solved in the bioinformatics field.
Author Contributions
SDdP designed and implemented the software, analyzed the state of the art solutions, wrote the paper. PR-B developed the software, performed the experiments, wrote the paper. EP-W analyzed and interpreted the results, tested the software and helped with the final version, wrote the paper. OT conceived and designed the experiments, analyzed and interpreted the results.
Supplemental Material
SupplementaryMaterial_1_Manual_xyz126875e2b3406 – Supplemental material for Combining Strengths for Multi-genome Visual Analytics Comparison
Supplemental material, SupplementaryMaterial_1_Manual_xyz126875e2b3406 for Combining Strengths for Multi-genome Visual Analytics Comparison by Sergio Diaz-del-Pino, Pablo Rodriguez-Brazzarola, Esteban Perez-Wohlfeil and Oswaldo Trelles in Bioinformatics and Biology Insights
Supplemental Material
SupplementaryMaterial_2_GuidedExercises_xyz12687442e1fcb – Supplemental material for Combining Strengths for Multi-genome Visual Analytics Comparison
Supplemental material, SupplementaryMaterial_2_GuidedExercises_xyz12687442e1fcb for Combining Strengths for Multi-genome Visual Analytics Comparison by Sergio Diaz-del-Pino, Pablo Rodriguez-Brazzarola, Esteban Perez-Wohlfeil and Oswaldo Trelles in Bioinformatics and Biology Insights
Footnotes
Acknowledgements
We wish to thank the BITLAB Group and the application testers for all their support and comments which have significantly contributed to improve this work.
Funding:
The author(s) disclosed receipt of the following financial support for the research, authorship, and/or publication of this article: This work has been partially supported by the European project ELIXIR-EXCELERATE (grant no. 676559) and the Spanish national projects Plataforma de Recursos Biomoleculares y Bioinformáticos (ISCIII-PT13.0001.0012), the Computer Architecture Department of the University of Málaga, and the Instituto de Investigación Biomédica de Málaga (IBIMA).
Declaration of Conflicting Interests:
The author(s) declared no potential conflicts of interest with respect to the research, authorship, and/or publication of this article.
Copyright
Copyright © 2016 SAGE Publications Ltd, 1 Oliver’s Yard, 55 City Road, London, EC1Y 1SP, UK. All rights reserved.
Data Availability
GeckoMGV is available at https://pistacho.ac.uma.es/. The code (GNU GPL) is available at https://github.com/Bitlab-UMA. More information about the GeckoWorkflow can be found at ![]() .
.
Supplemental Material
Supplemental material for this article is available online.
Supplementary Material 1—a PDF file with the user guide of the application.
Supplementary Material 2—a PDF file with step-by-step guided exercises.
References
Supplementary Material
Please find the following supplemental material available below.
For Open Access articles published under a Creative Commons License, all supplemental material carries the same license as the article it is associated with.
For non-Open Access articles published, all supplemental material carries a non-exclusive license, and permission requests for re-use of supplemental material or any part of supplemental material shall be sent directly to the copyright owner as specified in the copyright notice associated with the article.