
Abstract
Human fecal specimens, serve as important materials, are widely used in the field of microbiome research, in which inconsistent results have been a pressing issue. The possible attribute factors have been proposed including the specimen status after preservation, extracted DNA quality, library preparation protocol, and sample DNA input. In this study, quality comparisons for shotgun metagenomics sequencing were performed between 2 DNA extraction methods for fresh and freeze-thaw samples, 2 library preparation protocols, and various sample inputs. The results indicate that Mag-Bind® Universal Metagenomics Kit (OM) outperformed DNeasy PowerSoil Kit (QP) with a higher DNA quantity. Controlling on library preparation protocol, OM detected on-average more genes than QP. For library construction comparison by controlling on the same DNA sample, KAPA Hyper Prep Kit (KH) outperformed the TruePrep DNA Library Prep Kit V2 (TP) with the higher number of detected genes number and Shannon index. No significant differences were found in taxonomy between 2 library preparation protocols using the fresh, freeze-thaw and mock community samples. No significant difference was observed between 250 and 50 ng DNA inputs for library preparation on both fresh and freeze-thaw samples. Through the preliminary study, a combined protocol is recommended for performing metagenomics studies, by using OM method plus KH protocol as well as suitable DNA quantity on either fresh or freeze-thaw samples. Our findings provide clues for potential variations from various DNA extraction methods, library protocols, and sample DNA inputs, which are critical for consistent and comprehensive profiling of the human gut microbiome.
Introduction
In 1998, the metagenome was named and termed by Handelsman et al, 1 and since then, researchers have made efforts on characterizing the metagenome profile of soil,2,3 water,4,5 human specimens,6,7 and others.8-10 As the non-invasive and valuable source of metagenomes, the fecal sample is considered as the major type for metagenomics study and selected as the study specimen by many international consortium such as Metagenomics of the Human Intestinal Tract consortium (MetaHit) and human microbiome project (HMP). Next-generation sequencing (NGS) is a major tool in profiling the metagenome. Sample DNA extraction and NGS library preparation are therefore critical for data quality control. Given an inconsistent finding in the field, some studies have indicated the importance on DNA extraction,11,12 to our knowledge, limited studies have specifically addressed the impact of library preparation methods on human fecal samples.13,14 In this study, Mag-Bind® Universal Metagenomics Kit (OM) and DNeasy PowerSoil Kit (QP) methods on different sample preservation statuses (freeze-thaw and fresh) were also compared. Furthermore, the methods of KAPA Hyper Prep Kit (KH) and TruePrep DNA Library Prep Kit V2 (TP) with different sample inputs were tested, the goal is to evaluate the optimal experimental protocols to get the more robust data quality for samples with different preservation status.
Materials and Methods
Informed consent
The study protocol was approved by BGI Institutional Review Board. (IRB No: 18074). All donors gave their written consent for nontherapeutic use of their donated fecal samples.
Sample collection and mock-community sample
Three fresh fecal samples were collected from 3 healthy individual donors, and the Genotek kit (Catalog # OMR-200, DNA Genotek, Ottawa, Canada) was used for sample collection. For samples collected in a remote area, they were stored and shipped at −20°C or lower. Temperature fluctuations were expected during the storage or freeze-thaw process. To compare the different preservation statuses for fresh fecal and freeze-thaw samples, an aliquot of sample Fresh C1 was stored at ambient temperatures and transferred to −20°C immediately, then extracted after 1-week storage period at −20°C. DNA extraction for all the fresh fecal samples was processed immediately after sample collection at ambient temperature. One mock community sample, composed of 3 gram-negative bacteria, 5 gram-positive bacteria, and 2 yeasts, was obtained from Zymo Research (ZymoBIOMICS™ Microbial Community Standards, Irvine, California, United States) (Table 1).
Sample information.

DNA isolation
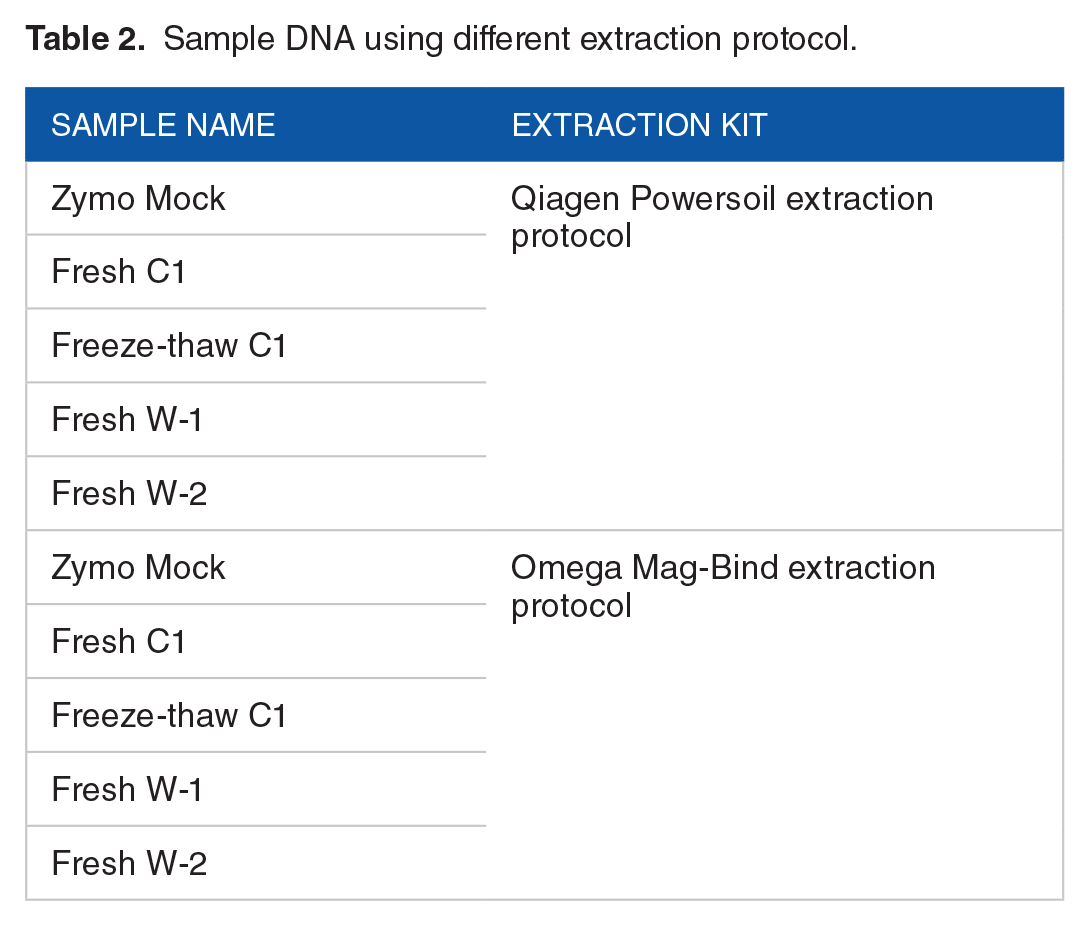
For DNA extraction, fecal and Zymo mock samples were performed using Mag-Bind® Universal Metagenomics Kit (Product# M5633-01, Omega Biotek) and DNeasy PowerSoil Kit (Catalog# 12888-100, Qiagen) (Table 2 and Figure 1A) according to manufacturer’s instructions. Qubit Fluorometric Quantitation (Thermo Fisher Scientific) and 0.8% agarose gel electrophoresis (AGE) were used for DNA quantitative and quality checking.
Sample DNA using different extraction protocol.
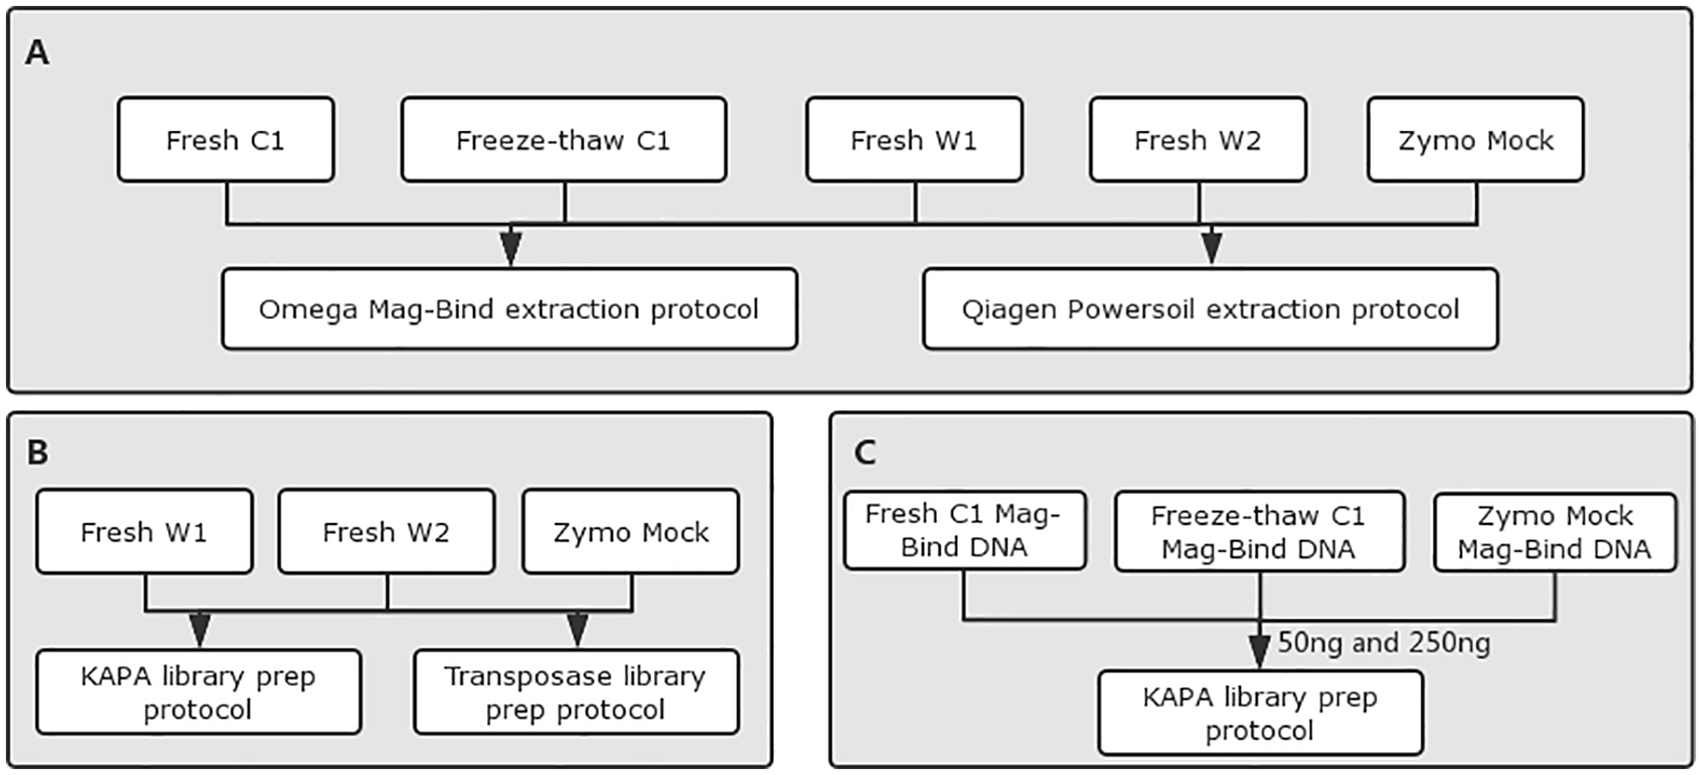
Experimental workflow. (A) Methods used for extraction of metagenomic DNA from human fecal samples. (B)-(C) Protocols used for metagenomic library preparation with different sample inputs.
Library preparation
To evaluate the impact of library preparation protocol on the microbiome community quantitation, KAPA and Transposase libraries were prepared following the manufacturer’s protocols of KAPA Hyper Prep Kit (catalog# KR0961, KAPA Biosystems) and TruePrep DNA Library Prep Kit V2 (catalog# TD502, Vazyme Biotech). Starting with 250 ng of DNA as sample DNA input, the paired-end (PE) libraries were constructed with the insert size of 250 and 350 bp using KH and TP protocol, respectively (Table 3 and Figure 1B). To assess the impact of sample input on the shotgun metagenomic profiling, sample starting with 50 and 250 ng of DNA input for library construction by using KAPA Hyper Prep Kit (Table 4 and Figure 1C).
Same sample with different library preparation protocols.

Same library preparation protocol with different sample inputs.

Abbreviation: PCR, polymerase chain reaction.
According to KAPA Hyper Prep Kit’s manufacture guideline, the corresponding PCR cycles has been applied to generate 1 µg of metagenomic library.
Sequencing method
High-throughput sequencing was performed by HiSeq 4000 system (Illumina) with pair-end reads of length 2 × 150 bp (Table 5).
Sample sequencing list.

Data analysis
High-quality reads were obtained through filtration of the reads containing 10% or more ambiguous bases (N base); the reads contain the adapter sequences (default: 15 bases overlapped by reads and adapter); the reads contain 50% or more low-quality (Q < 20) bases. Then, the reads were trimmed by mapping with the human genome to remove the human-based reads. The trimmed reads from each sample were aligned against the integrated catalog of reference genes (IGC) 15 by Bowtie 2.0. 16 MEGAN 17 was used to perform a taxonomy assignment analysis. After that, the relative abundance of each taxonomy level from the same taxonomy was summed, and the gross relative abundance was taken as the content of this taxonomy in a sample to generate the taxonomy relative abundance profile of the samples. Based on the species’ profile, we calculated the within-sample (alpha) diversity to estimate the species richness of a sample using the Shannon index, which was performed by the package in R software, 18 also, we performed the across-sample (Beta) diversity analysis 19 on samples by processing with different extraction methods, library protocols, sample inputs, and sample preservation methods. All samples were illustrated by the (principal component analysis) PCA graph that was implemented in the “ade4” package in R software. 20 Genes with similar abundance patterns usually have the same functional correlation; therefore, the clustering analysis of gene abundance patterns was performed by JavaTreeview software (Figure 2). 21
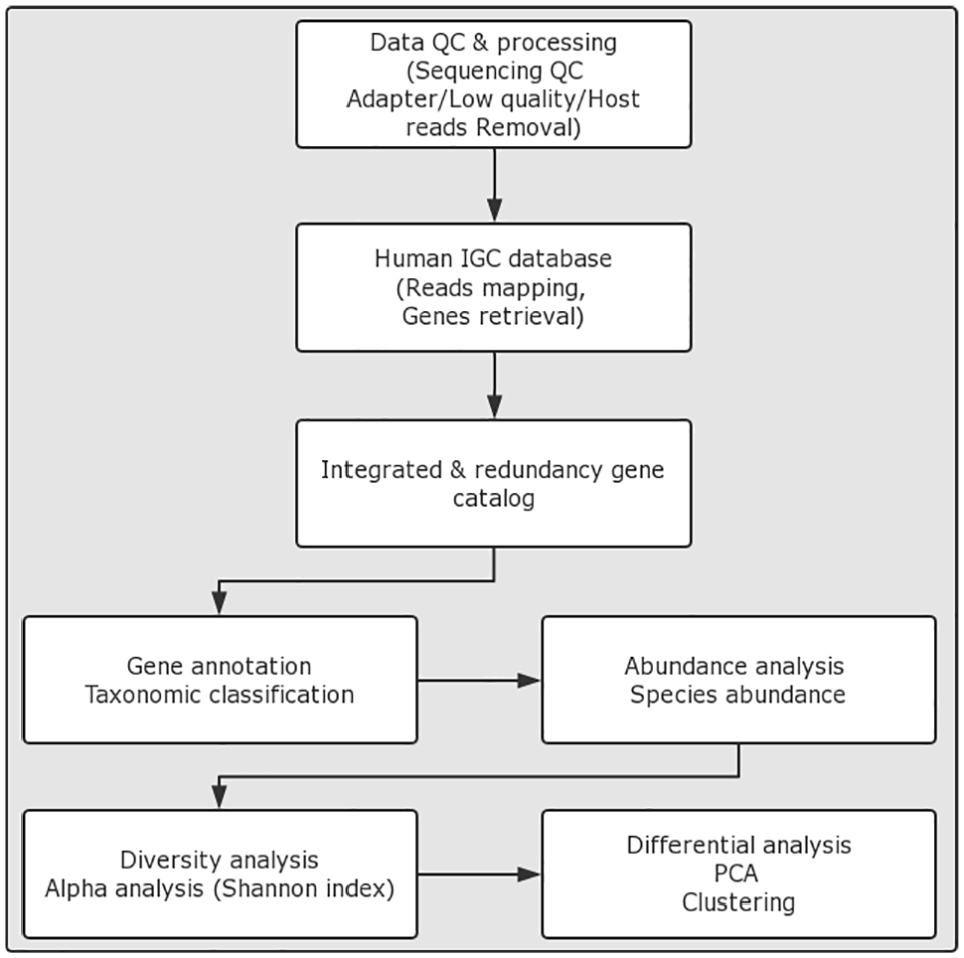
Data analysis pipeline. PCA indicates principal component analysis. IGC, integrated catalog of reference genes.
Results
DNA extraction quality results
When the 2 different DNA extraction methods (Table 2) were used with the freeze-thaw, fresh, and mock samples, the size distribution of all the DNA fragments were among 9–23 Kb, which revealed both methods can yield comparable and relatively high molecular weight of DNA (Figure 3). The DNA yield varied considerably among different samples. Generally, OM yielded a larger amount of DNA than QP. For the sample of C1, the sample with status of freeze-thaw can yield a lower amount of DNA than the fresh sample; hence, the impact of the freeze-thaw process is expected in terms of DNA extraction yield (Figure 4).

DNA size and distribution were obtained by 2 DNA extraction methods. Both extraction methods were applied on (A) Zymo Mock, fresh, freeze-thaw samples, and (B-C) 2 other fresh samples.

Efficacy of DNA extraction methods evaluated based on DNA yield.
Sequencing data quality
To determine how extraction methods and library protocols impact the microbial community quantitation, the libraries from each of the four DNA samples (3 human fecal samples and 1 mock sample) were generated. And to maintain unbiased comparison among different libraries, we trimmed the clean reads number with similar levels. After performing the sequencing by the Illumina Hiseq 4000 system, either QP or OM extraction methods were used, TP libraries were higher than KH in terms of raw reads to clean reads transformation rate; this can be due to the insert size of TP (350 bp on average) which is longer than KH (250 bp on average), and it increased the ratio of reads that contaminated by adapter when using 150 bp read length. However, KH libraries generally perform higher than TP in terms of detected gene numbers on fresh fecal and mock community samples. In addition, all the fecal samples’ IGC mapping rate was at a higher level (93%-98%), which indicates there is no significant host (human-derived) contamination issue. As expected, the mock community samples’ IGC mapping rate is relatively low (40%-48%), which is due to only 8 bacteria and 2 yeasts were designed (Tables 6 and 7). When comparing the high sample input (250 ng) with low sample input (50 ng), both libraries performed comparable outputs in terms of clean rate, IGC mapping rate, and detected gene number on fresh C1, freeze-thaw C1 fecal, or mock community sample (Table 8).
Sequencing data statistics results for fresh W1 and fresh W2.

Sequencing data statistics results for Zymo mock.

Sequencing data statistics results for different sample inputs.

Nucleotide sequence accession number
All the metagenomic sequence datasets are available on the Sequence Read Archive (SRA) database under the accession no. SRP149918 (https://www.ncbi.nlm.nih.gov/sra/SRP149918).
Taxonomy classification
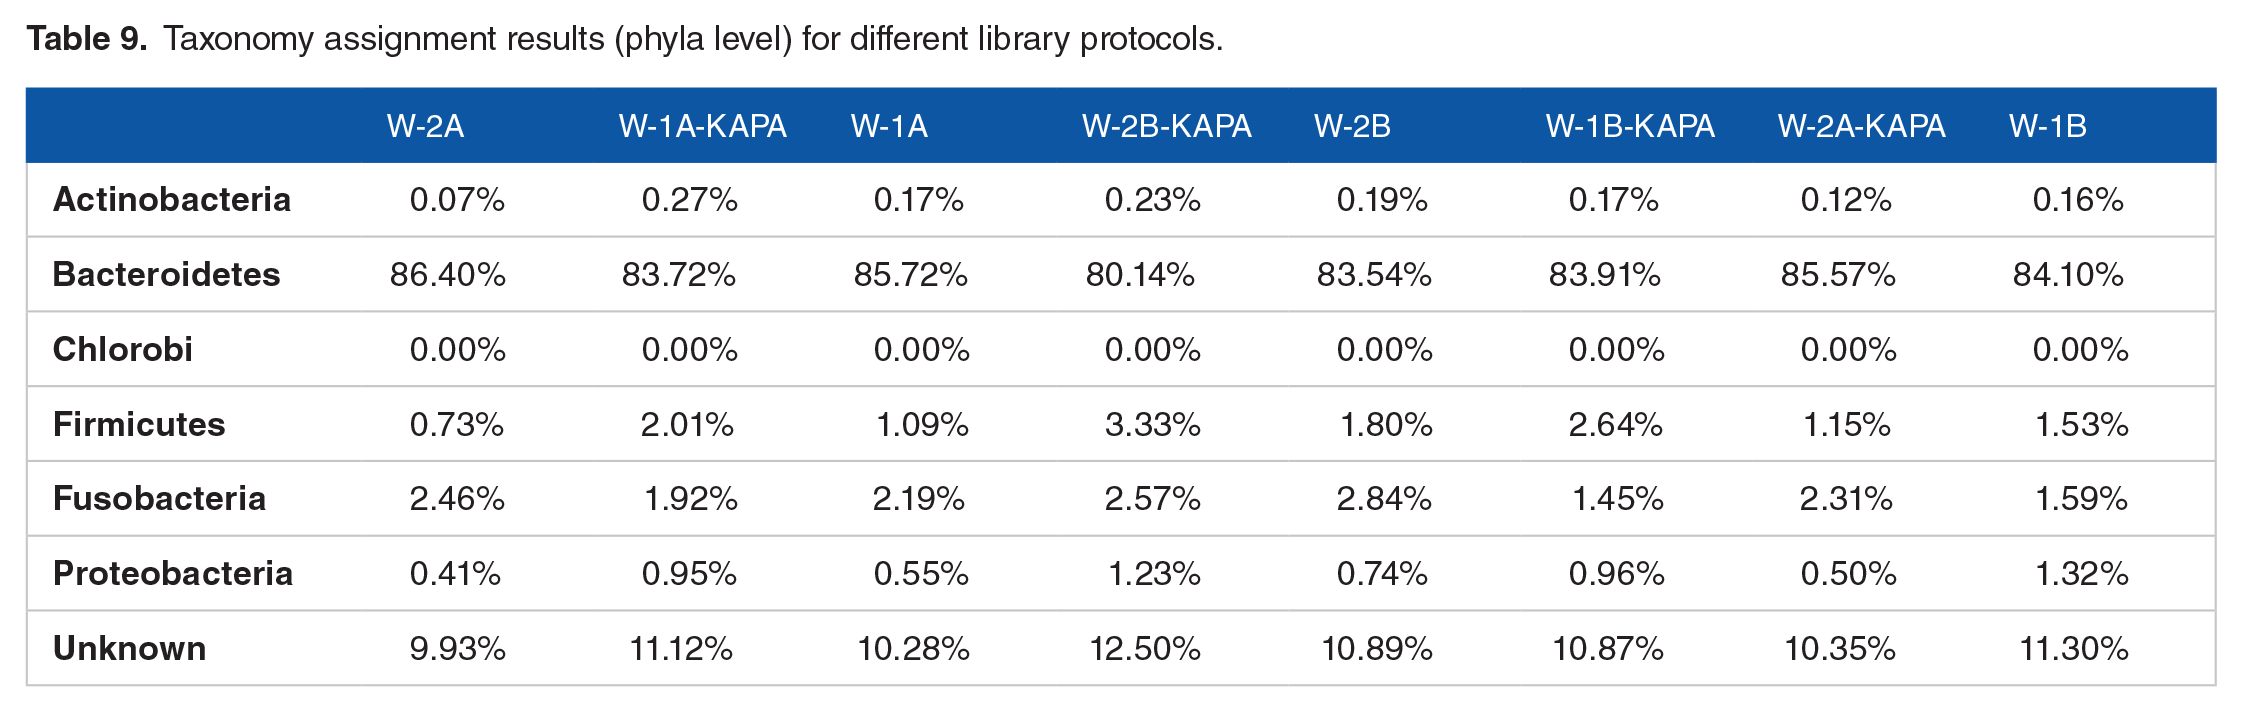
To investigate the impact of extraction methods and library preparation protocols on measurements of microbial community relative abundance, the taxonomy assignment was conducted for the fresh fecal samples. Either using QP or OM for the extraction and combining them with the KH or TP protocol, it appears that the biota of Fresh W1-QP-KH, Fresh W1-QP-TP, Fresh W1-OM-KH, and Fresh W1-OM-TP were compositionally similar. Besides, the same trend for fresh W2 was observed. At phylum level, the results of fresh W1 and W2 revealed predominance of the taxonomic abundance was Bacterioidetes (>80%), followed by unknown species (~10%), Fusobacteria (1%-3%), Firmicutes (0.7%-3%), and Proteobacteria (~1%) (Figure 5A and Table 9). Furthermore, the microbial distributions at genus level were Bacteroides (>78%), unknown species (>10%), Fusobacterium (2%-3%), and Clostridium (0.5%-1%) (Figure 5B).

Barplots of taxons relative abundance results for different library protocols: (A) phylum level and (B) genus level.
Taxonomy assignment results (phyla level) for different library protocols.
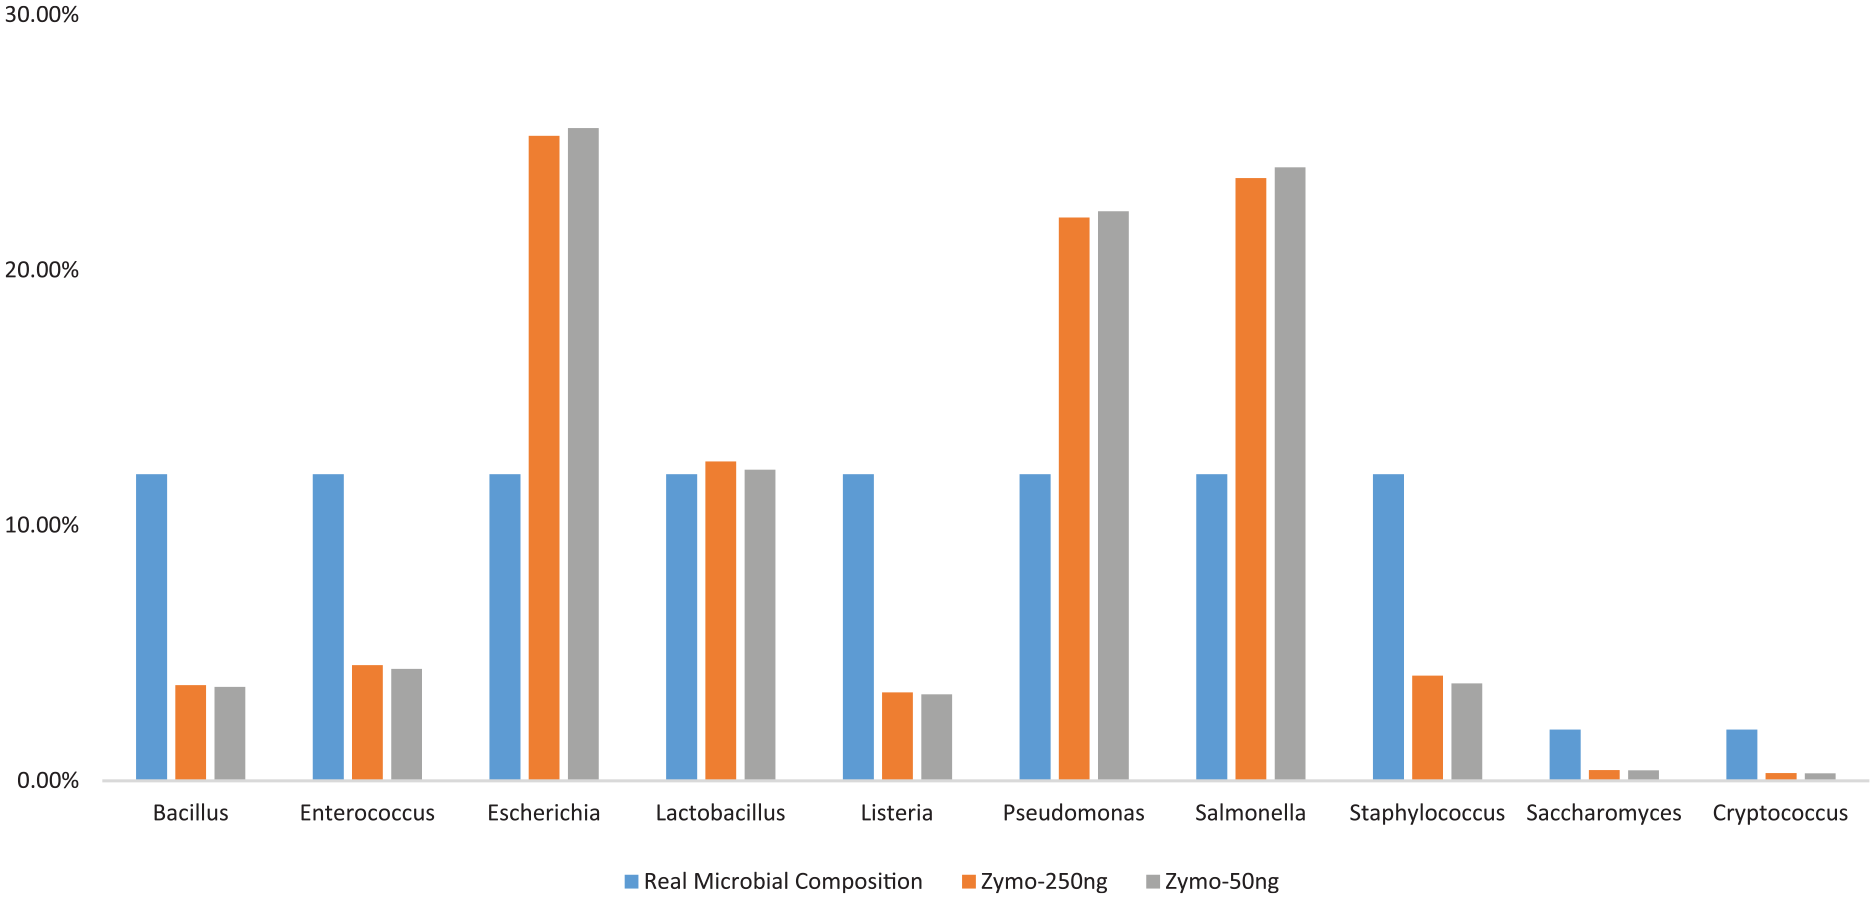
To further examine how extraction methods and library protocols affect the microbial abundance quantification, the fresh C1, freeze-thaw C1, and Zymo mock samples were selected to perform library preparation with different DNA inputs (50 ng vs 250 ng) by using the KH protocol. According to the phylum- or genus-based taxonomic classification, we observed that library with 250 ng sample input performed more consistency than the library with 50 ng sample input when using fresh C1 and freeze-thaw C1 (Figure 6A and B). The detected microbial community distribution rate demonstrated that the library of Zymo mock sample with 250 ng was closer to the defined microbial community compared to the Zymo mock sample with 50 ng, suggesting that the low-cycle polymerase chain reaction (PCR) amplification step did not result in any bias (Table 10 and Figure 7).

Barplots of taxons relative abundance results for different sample inputs study: (A) phylum category and (B) genus category.
Comparison with real microbial community distribution on different sample inputs.

Comparison with real microbial community distribution on different sample inputs.
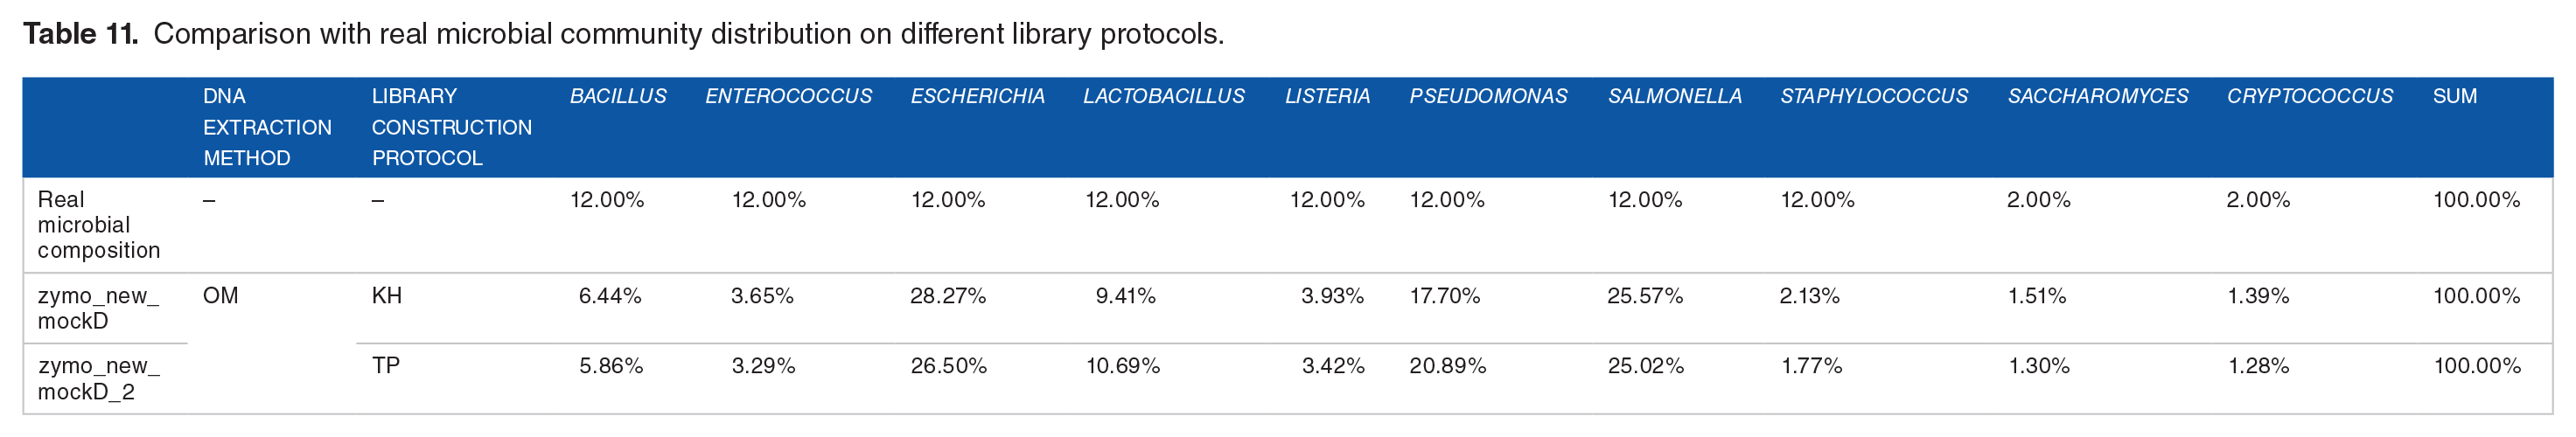
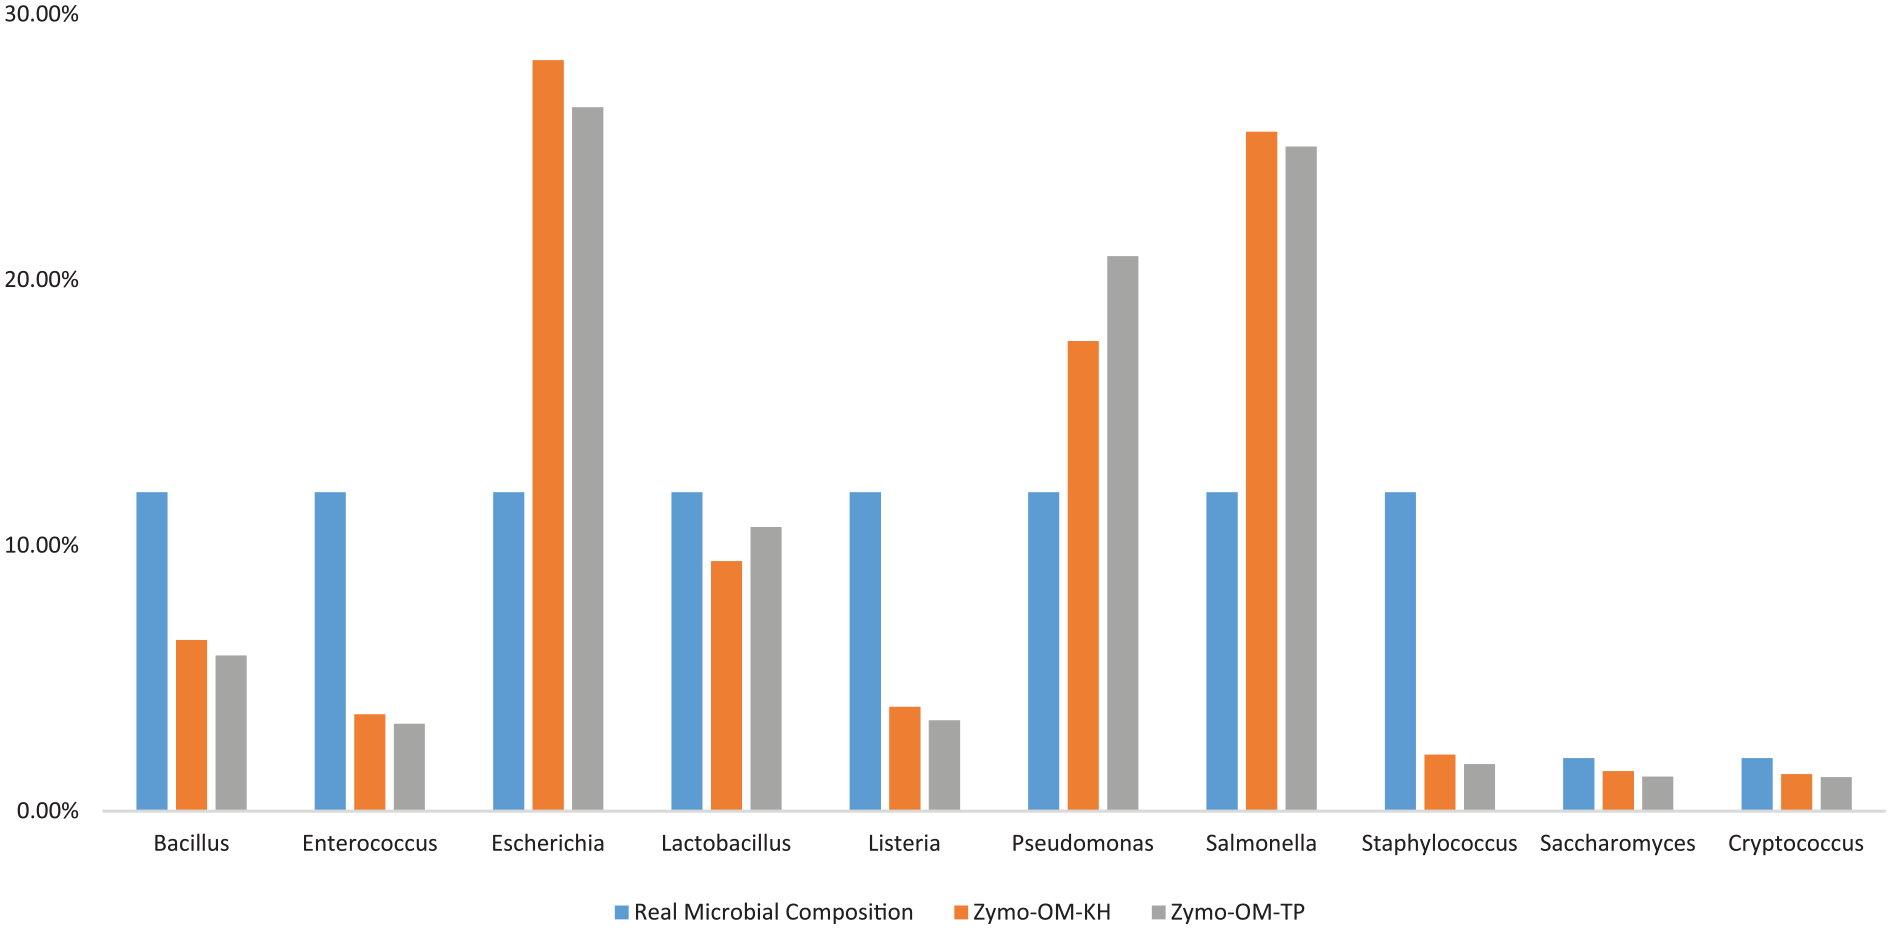
After performing the library construction using the TP and KH protocols on Zymo mock samples, we did not find that the KH protocol could perform more closely with the defined microbial species abundance comparing with TP protocol (Table 11 and Figure 8), which was confirmed by the correlation analysis (Figure 9).
Comparison with real microbial community distribution on different library protocols.
Comparison with real microbial community distribution on different library protocols.

Correlation analysis results among different library protocols on Zymo sample.
Microbial community shift of various DNA isolation and library protocols
To measure the within-sample diversity, we conducted the alpha diversity analysis by calculating the Shannon-index value, which reflects the species diversity of the community, and is affected by both species richness and species evenness. With the same species richness, the greater the species evenness, the higher the community diversity. We observed that using either OM or QP extraction methods, the KH protocol (~0.69 in average) outperformed the TP (~0.64 in average) for W1 and W2 (Table 12 and Figure 10), which indicates that the KH-based library can detect more diversity of species compared with the TP protocol.
Difference in alpha diversity for different library protocols.


Shannon index distribution on different library protocols.
To examine the changes in species diversity for the same sample after using different DNA extraction and library protocols, a beta diversity analysis was performed by measuring the Bray-Curtis distance metrics between each pair of samples. Regardless of using either QP or OM method, we found out that Fresh W2-OM-KH, Fresh W2-QP-TP, Fresh W2-QP-KH, and Fresh W1-QP-TP were clustered together, and Fresh W2-OM-TP, Fresh W1-OM-KH, Fresh W1-QP-KH, and Fresh W1-OM-TP were clustered into another group, which indicates that the potential library construction bias was caused by using TP protocol on Fresh W1 and Fresh W2 samples. On the contrary, samples of Fresh W1 and Fresh W2 can be differentiated by using the KH library protocol (Figure 11).

Bray-Curtis distance among samples using 2 library preparation protocols.
Principal component analysis
To reduce the complexity of the datasets and determine the main factors of observed value differences after comparing the different extraction methods and library protocols, the principal component analysis was performed (Figure 12). We have seen no overlap between the 2 groups (Fresh W1-OM-KH, Fresh W1-QP-KH, Fresh W2-OM-KH, and Fresh W2-QP-KH vs Fresh W1-OM-TP, Fresh W1-QP-TP, Fresh W2-OM-TP, and Fresh W2-QP-TP) by using the KH and TP library protocols, respectively; it suggests that the library protocol can impact the microbial community quantification, and it also indicates the low correlation between both library protocols. This inspired us to keep using a consistent library protocol that could be a good strategy to avoid the library protocol bias effect for the metagenomics study.

Principal component analysis on different library protocols based on relative microbial community abundance.
Differential analysis
To examine how preservation status, sample inputs, extraction method, and library protocol influence the correlations for the same sample, the clustering analysis of gene abundance patterns were performed. Given a best performance of the OM method and KH protocol, both were selected for further evaluation of different sample inputs on metagenomics quantitative studies. According to the differential analysis for the same samples with different sample inputs, Zymo mock samples were clustered into the same branch, and the fresh C and freeze-thaw C were clustered together as well (Figure 13). We have seen that there were very limited difference/distances that can be found for the sample C1 when using 50 and 250 ng of the sample input, which indicates that 50 ng can produce highly comparable results when comparing with 250 ng, the Pearson value was reached to 0.984 and 0.941 for Zymo mock-50 ng vs Zymo mock-250 ng, fresh C-50 ng vs fresh C-250 ng, respectively. Even for the freeze-thaw sample, the Pearson value is 0.974 for freeze-thaw-50 ng vs freeze-thaw-250 ng, no significant bias was observed (Figure 14). Considering the concern of freeze-thaw issue, 21 our results showed that the correlation between freeze-thaw-50 ng vs fresh C-50 ng and freeze-thaw-250 ng vs fresh C-250 ng were 0.868 and 0.954, respectively. This result gave us a clue that even the fecal sample with low biomass was processed in a freeze-thaw way, and we were still expected to obtain a highly comparable result compared with the fresh sample.

Hierarchical clustering among samples with different inputs.

Heatmap of Pearson correlation between samples with different inputs.
Discussion
Since the HMP in 2007, no standardized protocol has been recommended for human fecal sampling, sample handling, DNA extraction, DNA sequencing, and data analysis. Research effort has been made to set up the benchmark for microbiome study. Advancing technology has made various commercialized DNA extraction kits available. However, the complexity of fecal samples requires well-established protocols to reach an efficient DNA extraction with high quality for downstream applications. The Qiagen-based method becomes popular in the microbiome study field for various sample types.22-25 More recently, the Omega Mag-Bind Stool extraction protocol26,27 has drawn researchers’ attention; Mackenzie et al previously reported that the Qiagen DNeasy PowerSoil Kit is the most effective human fecal microbial DNA extraction method when compared with the HMP extraction method, QIAamp® DNA Stool Mini Kit, ZR Fecal DNA MiniPrep™, and 1 non-kit phenol: chloroform-based DNA isolation protocol. 28 According to previous studies, 29 bead beating method is more robust than non-bead-beating-based protocol. Therefore, 2 “bead-based” DNA extraction kits were evaluated using human fecal samples in this study. After processing extraction procedures followed the kit manufacturers’ protocols, DNA assessment results indicate that for either fresh fecal samples or commercial mock samples, the OM method can yield relatively more DNA when compared with the QP method.
After library preparation, using either KH protocol or TP protocol, the Shannon index indicates that OM method can produce more diversity than QP method for most of the testing samples, which suggests the importance of DNA isolation protocols when interpreting microbial community diversity measurements. A previous report demonstrated the introduction of significant bias based on the lysis method. 28 This result is consistent with their finding, which suggests a bead-related reagent-to-reagent variability and processing time of homogenization and lysis, because the robustness in step of homogenization and lysis can determine the amount of extracted DNA from difficult-to-lyse microorganisms. Furthermore, in terms of biomass yielding, the DNA isolated from fresh sample stored at Genotek kit is slightly higher than snap-frozen sample from the same donor according to our comparison result (Figure 4) although the quantities from both sample status were in microgram level. As for microbial community distribution, our study indicates both fresh samples collected by using Genotek kit and freezing method were highly consistent (Figure 6A and B), which supports the findings from other studies.29-31 From the logistics perspective, Genotek kit, which can be shipped at ambient temperature, is less restricted for cold-chain transportation compared to snap-frozen samples. Therefore, it makes sample self-collection possible, which is pivotal for carrying on the large epidemiological studies. For cost comparison, Genotek kit is more economical, 32 although the freezing method requires more resources such as sampling handler or biobanking center equipped with refrigerator or cold storage space at −20°C or even −80°C, as well as cold-chain management for frozen sample to avoid the repeated freeze-thaw issue, which is not suitable for self-collection-based study. The preliminary results provide potential evidence for researchers in their studies design especially in sample preservation method selection, which largely depends on research objective, simplicity of fecal sample collection procedures, and ease of transportation to the lab, particularly for large cohort studies. For the challenging samples with limited biomass such as skin or swap,7,33 freezing method could be optimal to stabilize the nucleic acid, but for fecal samples, commercial sample collection kit is more practical.
Our analysis indicates that each library preparation method has pros and cons. TP libraries generated larger insert size, low duplication rate, and a low number of low-quality reads compared to the KH method. In addition, KH libraries showed better performance with high gene detection numbers and high Shannon index (Tables 6, 12 and Figure 10) regardless of extraction protocols on fresh fecal samples. This may be due to the short-insert shotgun libraries that have the most efficient matches in the database as reported by Danhorn et al. 34 The use of Bray-Curtis distance and PCA of beta analysis revealed both TP and KH protocols can remarkably impact on the microbial communities. Regardless of extraction method, W1 and W2 can be differentiated by KH protocol. In contrast, these 2 human fresh fecal samples were clustered together by the TP method (Figure 11). Furthermore, no overlap was observed between 2 library protocols according to the PCA analysis; this finding indicates that the microbial communities can be significantly influenced by library preparation protocols, which is consistent with the observation reported by Bowers et al. 13
In addition, for the Zymo mock sample, both TP and KH protocols were highly correlated in terms of consistency between detected community profile and theoretical community profiling. However, this is not the case for fresh and snap-frozen fecal samples (Table 9 and Figure 5). One possible explanation could be the intermediate GC content (32%-60%) of microorganisms being included in Zymo mock sample. However, certain bacteria/fungi in human fecal sample with GC-poor (<30%) or GC-rich (>60%) were not discovered due to PCR bias during library preparation for GC-poor/rich microorganisms, as previously reported by Laursen et al. 35 Hence, a limitation is clear with this commercially available reference Zymo mock sample with a mixture of genomic DNA extracted from pure cultures of 8 bacterial and 2 fungal strains. Other simulated microbial community options need to be evaluated in the future as Jones reported. 14 To our knowledge, this was a first study testing the TP protocol in microbiome-based study so far except one application for library preparation in a single cell RNA Seq study, 36 which indicates that further optimization of the protocol in large-scale comparative studies is required based on the accumulated experience for KH protocol development.
As recommended by Jones et al, 14 for PCR-free library protocol, a high amount of DNA is required at the microgram level. However, it is less realistic for researchers to get a large volume of samples. Furthermore, researchers were also concerned with extremely low input, such as 1 ng of the protocol may introduce high PCR bias due to increased PCR cycles. 37 As such, it is necessary to test regular low input library protocol, such as 50 to 250 ng. By comparing different sample inputs using KH protocol on Fresh C1, Freeze-thaw C1, and Zymo Mock, no significant effect of low input level or high PCR cycles were observed on KH metagenomes. The taxonomy assignment analysis, correlation analysis, and cluster analysis consistently indicate that 50 ng can output highly comparable results with 250 ng. It provides evidence for the researchers in the microbial community for low input (50 ng) option while 250 ng is not achievable. The performance for lower DNA input merit future investigation especially for 10 to 20 ng DNA common in cancer studies. 37
This study also addressed the concern on freeze-thaw issue, and the preliminary comparison results revealed no significant difference between fresh and freeze-thaw samples in terms of microbial community distribution (Figures 6A, B, 13 and 14), which is supportive of the findings from Christine’s study, conducted on a diarrhea fecal sample. 38 In addition, in terms of microbial community stability under different temperature levels, Hang et al reported that high temperature (37°C) can cause the degradation of 16S rDNA from human oropharyngeal swabs sample compared to 4°C or lower temperature storage. 39 It is expected that the DNA sample could be degraded when storing at high temperature (37°C) or room temperature without enough inhibitors to DNases by using oropharyngeal swabs, which are enriched in human oral environment. This finding is contradictory to the findings from Doukhanine et al, 40 who claimed that Genotek kit can stabilize the microbiome profile at ambient temperature for almost 2 months by using their proprietary stabilizing liquid. Obviously, this finding merits further investigation in terms of the difference in alteration of human microbial community profile among different temperature statuses, such as high temperature, room temperature, or lower temperature, to provide guidance for accommodating sample collection requirements at different environmental status.
In addition, we realized that the sample size needs to be increased for further validation study; therefore, the large scale of study is recommended so that the finding could generalize to population-based researches, which usually involves thousands of subjects. For different types of complex diseases with the integration analysis of metagenomics and metatranscriptomics, this may provide new insights and more comprehensive information for DNA-based and RNA-based microbial community profiling.41-43 In addition, it is also important to establish a protocol on sample preservation 44 for RNA isolation45,46 and library preparation, which can also impact the metatranscription profiles47,48 because there has been no benchmarking of sample handling, RNA extraction, and library preparation methods for metatranscriptome sequencing by using established controls. Our study provides some evidence for future comprehensive design aiming at the optimized solution for benchmarking metatranscriptome.
Conclusions
Our findings reveal significant effects on DNA yield and metagenome composition derived from extraction methods and library preparation protocols. Of the 2 extraction protocols, OM protocol produced relatively higher quantity DNA on fresh and mock samples. In addition, KH protocol can perform more efficiently from the standpoint of detected gene number and Shannon index. According to our study, it turns out that the input level had no significant impact on metagenome composition. Our preliminary study showed comparable results to samples in different preservation status from the standpoint of metagenome composition. Finally, to ensure the metagenomics data consistency, using the same sample DNA extraction method, library preparation protocol, and sample preservation status for the single study is highly recommended. Also, it would be best if sample input can be on the same level.
Footnotes
Acknowledgements
We thank Deqiong Ma from Yale School of Medicine for assistance with review and grammar correction.
Funding:
The author(s) disclosed receipt of the following financial support for the research, authorship, and/or publication of this article: This research was funded by BGI Genomics.
Declaration of conflicting interests:
The author(s) declared no potential conflicts of interest with respect to the research, authorship, and/or publication of this article.
Author Contributions
Z.P. and K.K. conceived and directed the project. Z.P. routinely managed the project at BGI-Genomics. G.W. and X.Y. were responsible for the collection of fecal samples. Z.W., G.W., and M.T. designed the replicates and metagenomic library construction for the Hiseq platform. G.W. and A.J. contributed to sequencing experiments. X.Z., Z.W., and Z.P. designed the analyses. X.Z. performed the bioinformatic and statistical analyses. Z.P., X.Y., Z.W., and X.Z. participated in text revision and discussions. Z.P. wrote and revised the manuscript.
Ethics Approval and Consent to Participate
The study protocol was approved by BGI Institutional Review Board (IRB No: 18074). All donors gave their written consent for nontherapeutic use of their donated fecal samples.