
Abstract
Childhood obesity is a serious public health problem worldwide. Perturbations in the gut microbiota composition have been associated with the development of obesity in both children and adults. Probiotics, on the other hand, are proven to restore the composition of the gut microbiome which helps reduce the development of obesity. However, data on the effect of probiotics on gut microbiota and its association with childhood obesity is limited. This study aims to determine the effect of probiotics supplement intervention on gut microbiota profiles in obese and normal-weight children. A total of 37 children, 17 normal weight, and 20 overweight school children from a government school in Selangor were selected to participate in this study. Participants were further divided into intervention and control groups. The intervention groups received daily probiotic drinks while the control groups continued eating their typical diet. Fecal samples were collected from the participants for DNA extraction. The hypervariable V3 and V4 regions of 16S rRNA gene were amplified and sequenced using the Illumina MiSeq platform. No significant differences in alpha diversity were observed between normal weight and obese children in terms of the Shannon Index for evenness or species richness. However, a higher intervention effect on alpha diversity was observed among normal-weight participants compared to obese. The participants’ microbiome was found to fluctuate throughout the study. Analysis of the taxa at species level showed an increase in Bacteroides ovatus among the normal weight cohort. Genus-level comparison revealed a rise in genus Lachnospira and Ruminococcus in the overweight participants after intervention, compared to the normal-weight participants. The probiotics intervention causes an alteration in gut microbiota composition in both normal and overweight children. Though the association could not be defined statistically, this study has provided an improved understanding of the intervention effect of probiotics on gut microbiome dysbiosis in an underrepresented population.
Introduction
Overweight and obesity are global diseases affecting at least 1 in 3 adults and 1 in 5 children according to the Organization for Economic Co-operation and Development. 1 The prevalence of overweight children is approximately 22.5% and 7.9% in Singapore and Thailand, respectively. 2 In Malaysia, the National Health and Morbidity Survey reported an 11.9% incidence of obesity among children under 18 years old. The highest obesity rate was found in Perak (14.1%) and prevalence of obesity higher among boys compared to girls. Furthermore, rates of obesity were greater among urban children (12.1%) compared to those from the rural area (11.2%). Among Malaysian ethnic groups, Chinese has the highest obesity (13.0%), followed by Indians (12.6%) and Malays (11.8%). Children are overweight for a variety of reasons, such as unhealthy eating patterns, lack of physical activity, genetic factors, or a combination of these factors. 3 Childhood obesity facilitates alteration of the gut microbiome through various health factors such as insulin resistance and type 2 diabetes, hyperlipidemia, hypertension, renal and liver disease, as well as reproductive dysfunction. Modulation of the gut microbiota among obese humans showed that the gut microbiome of obese individuals had a decrease in the gram-positive bacterial phyla Firmicutes and Actinobacteria. 4
The gut microbiome is the most diverse human microbiome, consisting of thousands of bacterial species. The human gut microbiome is comprised largely of strict anaerobes and facultative anaerobes, which are generally discussed at the phylum level of taxonomic rank. To date, more than 50 bacterial phyla expressing approximately 3.3 million prokaryotic genes have been identified. However, prior work has shown, the gut microbiome is largely dominated by 3 phyla, Bacteroidetes (Porphyromonas, Prevotella), Firmicutes (Ruminococcus, Clostridium, and Eubacteria), and Actinobacteria (Bifidobacterium). 5 This gut microbiota interact with one another as well as with the host, impacting the host’s physiology and health. Among the significant roles played by the gut microbiota in humans are vitamin synthesis, digestion improvement, nutrient and mineral absorption, angiogenesis promotion, production of short-chain fatty acids (SCFAs), and nervous system function. The by-products of fermentation such as acetate, propionate, and butyrate are vital for the gastrointestinal tract (GIT), provide energy for epithelial cells, enhance the epithelial barrier integrity, and provide immunomodulation and protection against pathogens. 6 Recent studies have investigated the bacterial gene function and its potential role in human health and metabolism. 7 The alteration of the gut microbiota components or dysbiosis has also been shown to lead to various diseases such as inflammatory bowel disease, cardiovascular disease, and even cancer. 8
Alteration of the gut microbiome is initiated by various factors including diet, medications, stress, obesity, environment and comorbid diseases such as heart disease or diabetes. Current evidence supports a link between obesity and composition of the gut microbiota. In contrast, probiotic administration containing the genus Lactobacillus has led to significant differences in microbial community composition, a reduced Firmicutes: Bacteroides ratio as well as an increased abundance of Verrucomicrobia. 9
Probiotics have been proven to influence glucose and fat metabolism, reduce body weight, and improve insulin sensitivity. Hence, it has the potential of a dietary intervention to treat obesity. 10 The effects of probiotics are mostly established for the Lactobacillus and Bifidobacterium strains in Western cultures, but there is very limited information available from the Asia-Pacific region. 11 Due to the diverse epidemiological health system and socio-economic conditions, there is a growing need to explore the association between gut microbiota and obesity in this geographical region. This pilot study was conducted to identify the intervention effect of a probiotics drink on the alteration of gut microflora among normal and overweight school children from Selangor, Malaysia.
Methods
Study design
Study approval was obtained from the Ethics Committee for Research Involving Human Subjects Universiti Putra Malaysia (JKEUPM), Malaysia [FPSK_November (13) 03], Ministry of Education (MOE), Putrajaya [KP(BPPDP)603/5/JLD.16(154)] and Department of Education of Selangor, Shah Alam (JPNS.PPN 600-1/49 JLD.32(32)]. The study was a randomized and cross-over design with 2 phases. Each phase lasted 4 weeks with a 4-week wash-out period in between to prevent carry-over effects from the previous treatment. All the procedures were carried out following the Helsinki Declaration of 1975, revised in 2008. Consent was obtained from all the subjects who met the inclusion and exclusion criteria of the study.
Study population
This study included school children from a government school in Selangor. The subjects were recruited in 2 different groups, namely normal weight, and overweight. To meet inclusion criteria for the study a participant had to be Malaysian, a registered student, and aged 7 to 10 years old. Z-scores for BMI-for-age of −2.0 SD to +1.0 SD were designated as normal weight and more than +2 SD was designated as overweight. Exclusion criteria included vaccination within 1 month of the study start, antibiotic treatments 2 weeks before sample collection, and subjects currently taking probiotics supplements. A total of thirty-seven (37) subjects comprised of seventeen normal weight and 20 overweight children were enrolled in the study, with thirty-five (35) completing the study. One normal weight participant and 1 overweight participant were unable to collect all samples and were thus excluded from analyses. Population characteristics and demographics of the remaining study participants are further detailed in Table 1. Phase groups were well-balanced between normal and overweight children, except unequal variance in weight between normal and overweight participant groups (F-test for variance, Group 1: P = 0.006, Group 2: P = 0.046).
Population characteristics table within each intervention phase group. P-values were obtained by tests described in the table, looking for distinctions between normal weight and overweight children within each phase group.

P-values less than 0.05 were considered significant and are shown in boldface. The only significant characteristic appears to be the amount of variance in weight between normal weight and overweight children in both phases.
Probiotics drink
The probiotic drinks were bottles of Lactobacillus fermented milk (LcS) containing glucose, fructose, maltitol, and skimmed milk powder. The components of each 80 ml bottle were energy, 46 kcal; protein, 0.9 g; fats, 0 g; carbohydrates, 10.6 g; sugar, 7.6 g; and dietary fiber, 0.2 g, and approximately 3.0 × 10¹⁰ colony-forming units (CFU) of LcS.
Study protocol
Subjects were separated into 2 groups, normal weight, and overweight. They were further divided into intervention and control groups. During the first 4 weeks, the phase 1 intervention group received LcS probiotic drinks for daily consumption while the control groups continued their typical diet. This was followed by 4 weeks of wash-out period. After, we conducted a cross-over, where subjects who were not provided the probiotic drinks in phase 1 were given LcS probiotic drinks and vice-versa. The intervention period continued for another 4 weeks and is referred to as phase 2. Throughout the intervention study, subjects were required to consume a common diet as other Malaysian children and continue their routine physical activities. 12
Fecal sample collection and DNA extraction
Fecal samples were collected from the subjects at week 0, week 5, week 10, and week 15. The flow of the study design indicating the study duration, probiotic consumption, and sample collection can be seen in Figure 1. Approximately 1 g feces were collected from the subjects at each time point using a sterile fecal collection tube and stored at −80°C for further processing. Approximately 200 mg of the fecal samples were mixed with 1 ml InhibitEX Buffer in a 2 ml microcentrifuge tube and vortexed thoroughly to homogenize the sample. DNA was extracted using QIAamp® Fast DNA Stool Mini kit per the manufacturer’s instructions. 13 The DNA was eluted using 200 uL elution buffer (0.1 mM EDTA, 10 mM Tris-HCl, 0.1% sodium azide, pH 8.0) and was stored at −20°C prior to sequencing. The concentration and purity of the extracted DNA were determined using Nanodrop 1000 v3.7.1 (Thermo Fisher Scientific, Massachusetts, U.S).
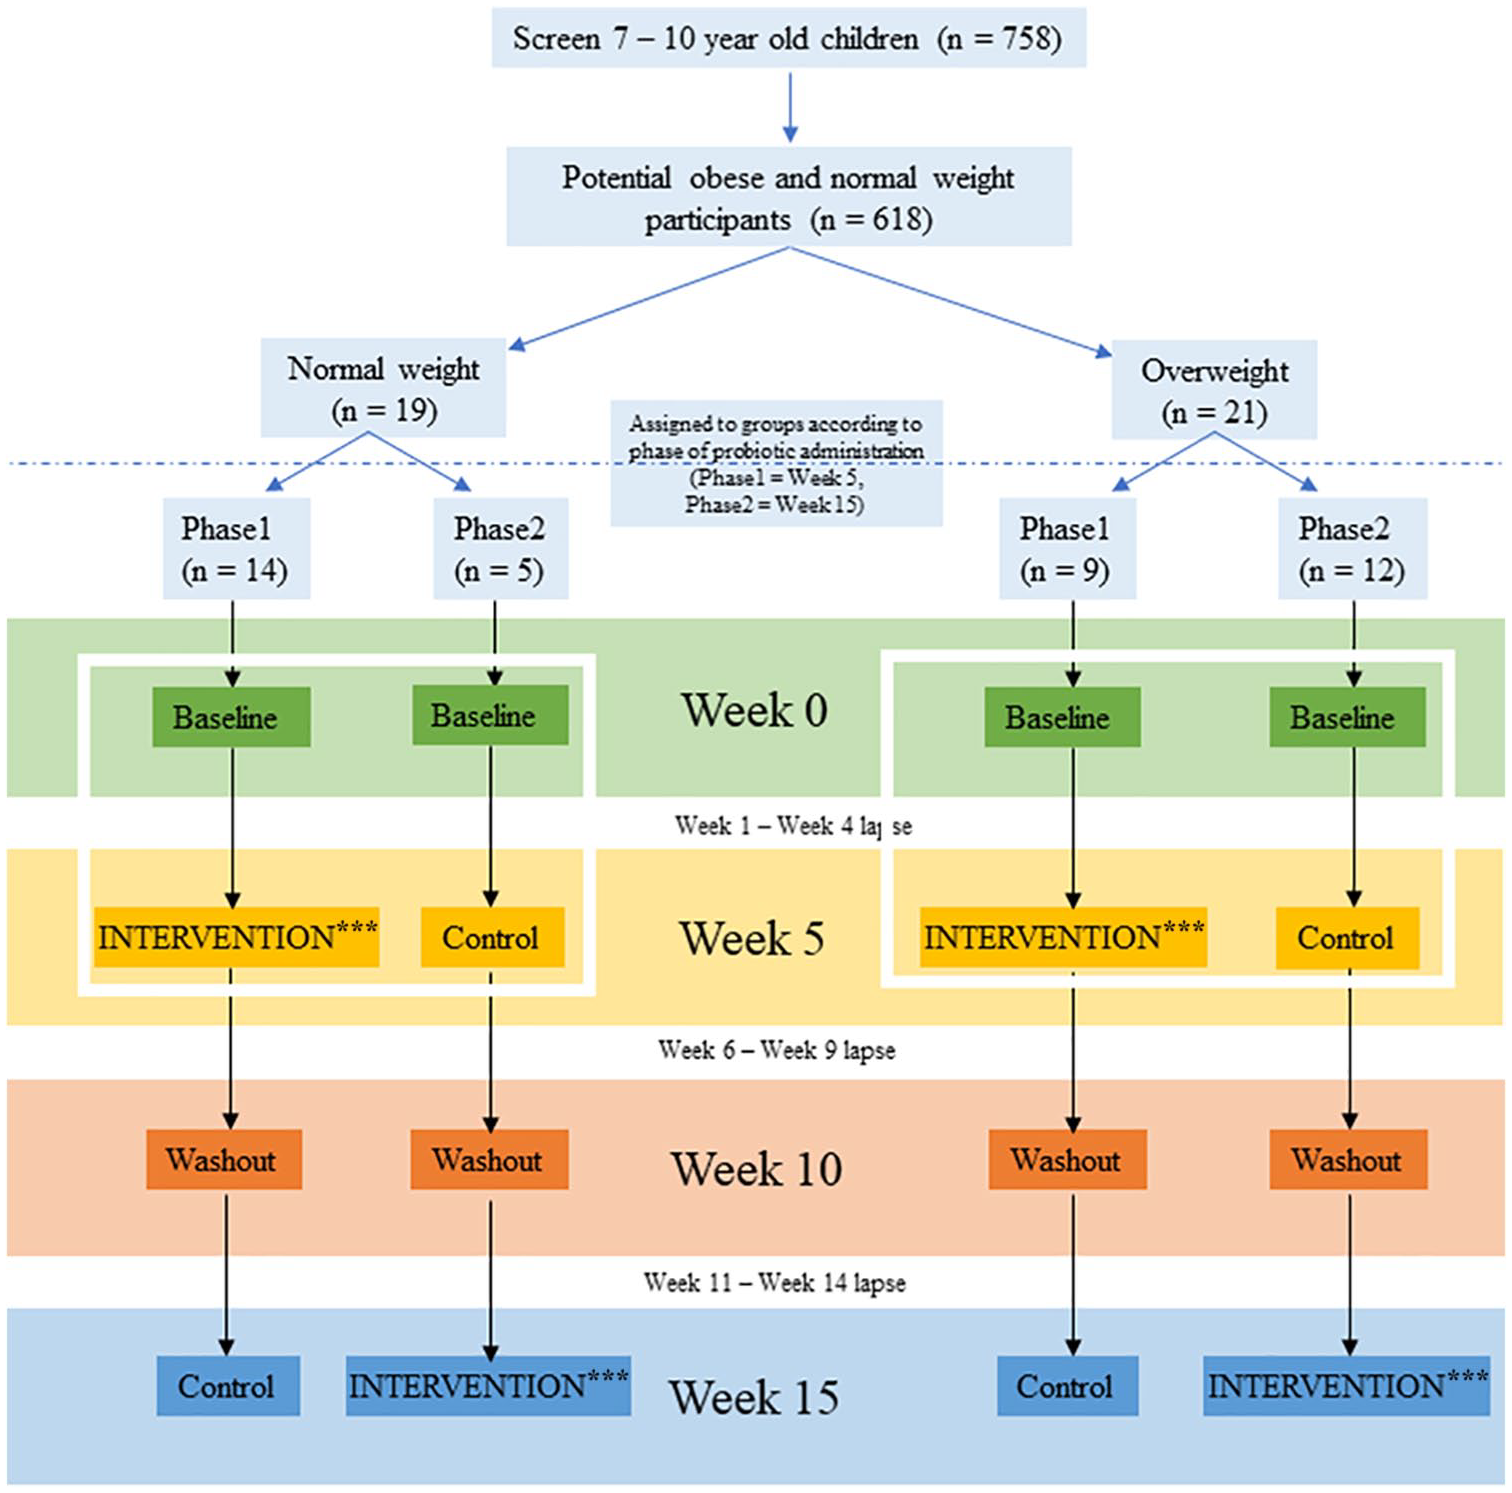
Cross-over study design. In the first 4 weeks, the phase 1 intervention groups received LcS probiotic drinks for daily consumption while the control groups continued their typical diet. This was followed by 4 weeks of wash-out period. Later, there was a cross-over, where subjects who were not provided the probiotic drinks before were given LcS probiotic drinks and vice-versa. The intervention period continued for another 4 weeks and subjects participating in this later probiotics intervention are referred to as “phase 2.”
DNA amplification and sequencing
The V3-V4 region of 16S rRNA gene was amplified using forward primer (5’–TCGTCGGCAGCGTCAGATGTGTATAAGAGACAGCCTACGGGNGGCWGCAG–3’) and reverse primer (5’–GTCTCGTGGGCTCGGAGATGTGTATAAGAGACAGGACTACHVGGGTATCTAATCC–3’). These primers contain partial Illumina Nextera adapter. The pooled libraries were then quantified, denatured and sequenced on Illumina MiSeq platform.14,15
Sequence data analysis and OTU table construction
Raw FASTQ files were quality controlled using the pipeline SHI7. 16 Nextera sequencing adapters were removed and all sequences trimmed until a threshold average quality score of >35 was achieved. Sequences not meeting these criteria were omitted. We performed Operational Taxonomic Unit (OTU) picking on the remaining samples with the exhaustive optimal alignment software BURST against the GreenGenes (version 13_8) database clustered at 97% identity. 17 In total, 88.8% of quality-controlled reads were assigned to an OTU for downstream analyses. The resulting OTU and taxonomy tables were then filtered using the statistical software R to remove singletons and OTUs of extremely low confidence (<0.01% average sample relative abundance). Before performing differential taxon abundance analyses, OTU and taxonomy tables were rarefied to a depth of 4018 reads and 4068 reads, respectively, as well as transformed using a centered log-ratio (CLR) transform, thus eliminating the need for a reference value in the creation of normalized, per-sample relative abundance tables. Custom analyses in R were created for computing diversity measures, conducting statistical tests, and generating figures using the vegan, ape, phyloseq, and ggplot2 packages.18-21 In statistical tests, all associations producing an FDR-adjusted P-value < 0.05 were considered significant.
Results
Probiotic intervention effect on alpha diversity
Alpha diversity, within sample diversity, was quantified using the Shannon diversity index, incorporating both OTU richness and evenness. A higher Shannon index is indicative of greater species diversity within a sample. To specifically identify the probiotic intervention impact on alpha diversity, intervention impact was defined as the change in Shannon diversity index per individual during their intervention period, subtracting the prior-to-intervention sample Shannon index value from the post-intervention sample value. An unpaired t-test revealed no significant difference between weight statuses in terms of this intervention impact (Figure 2). However, a greater percentage of normal weight individuals exhibited a positive intervention effect (68.75%) compared to overweight individuals (57.89%), implying children in the normal weight category more commonly experienced greater alpha diversity following a probiotics intervention.
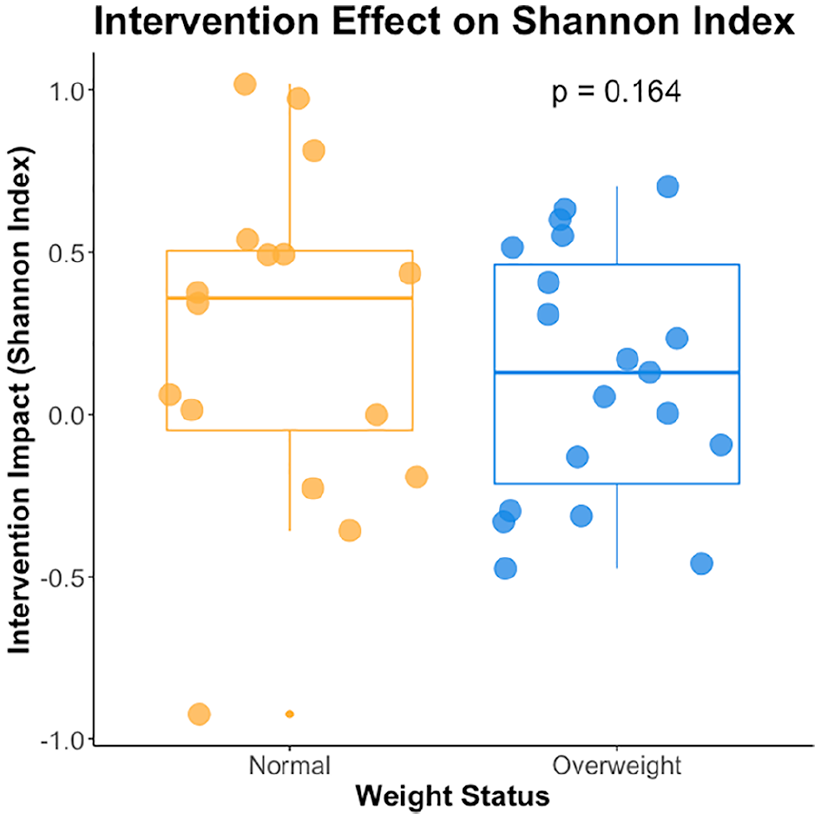
The intervention effect on alpha diversity measured using Shannon diversity Index plot for normal weight (orange) and overweight (blue) children. A higher Shannon Index implies greater alpha diversity, both in terms of OTU richness and evenness. The median is represented by the line inside the box, while the lowest and the highest values within the 1.5 interquartile range (IQR) are represented by the whiskers. The individual sample values including outliers are shown as points over the boxes. An unpaired t-test showed no significant difference in intervention effect between weight status groups (P = 0.164).
Probiotic intervention effect on beta diversity
We evaluated differences between bacterial communities using weighted UniFrac distance, incorporating phylogenetic relatedness, of all present OTUs after rarefaction. We stratified beta diversity analyses by phase groups, where phase 1 received the probiotic intervention prior to the week 5 sample and phase 2 conducted their intervention phase prior to week 15. Within each phase, we evaluated the impact of the week category, to see if there was a temporal effect on microbial composition. Interestingly, we found a significant temporal effect in phase 1 (Mann–Whitney U test, P < 0.05) but not phase 2. This is indicative of a shift induced by intervention and prolonged in the weeks following, as the significant impact of time is only seen in the group with the earlier intervention. In order to determine an explicit intervention impact, we further separated analyses into 2 sets of samples regardless of phase, before an intervention period and immediately after the intervention period. Without the baseline reference groups, significance of the intervention impact on microbial profile was lost. To visualize these analyses, we conducted Principal Coordinates Analysis (PCoA) on each phase, illustrating the 95% confidence interval of each set of samples with ellipses (Figure 3A).

Principal coordinates analysis (PCoA) using weighted UniFrac distances across all present OTUs within each phase and then combining phases but showing only the samples taken immediately before and after the probiotics intervention in each phase (A). Only phase 1 showed a significant relationship with weeks (PERMANOVA, P < 0.05). Using the same subsets of samples, a constrained RDA is shown below each PCoA plot, annotated with arrows to indicate the direction of significant variables in the RDA ordination space. Points in all figures represent samples, where more similar samples appear closer together.
To further investigate the impact of our probiotics intervention as well as weight status, we conducted redundancy analysis (RDA) on the CLR -transformed OTU tables using the RDA function in the R vegan package. The RDA stratified by phase once again and constrained for weight and probiotics intervention as well as other suspected confounding variables such as age, gender, and week of sample collection. After comparing these constraints to an unconstrained RDA, we were able to determine the adjusted R-squared and proportion of variance explained by each variable in the constrained RDA for phase 1 (Table 2A) and phase 2 (Table 2B), respectively. Significance of each variable in determining RDA distance was evaluated using the env.fit function in the vegan package in R. Remaining consistent with our findings with weighted UniFrac and PCoA, we found an intervention effect was only significant within the first phase (PERMANOVA, P-value < 0.05). Using the same subset of samples from looking for weighted UniFrac intervention effects within both phases, we found significance in terms of constrained RDA variation (PERMANOVA, P = 0.01). This could be because the constraints in RDA restricted the variation explained on each axis to severely less than PCoA, as represented by the percentages of variance listed alongside each axis (Figure 3B). So, the intervention effects appear to have significantly impacted only a small proportion of what we know as the microbial profile of our samples.
Permutational Analysis of Variance (PERMANOVA) on RDA constraints in phase 1 (A). and phase 2 (B) populations. “Prop. Var. Explained” is a percentage of unconstrained RDA variance explained by each variable.
A

B
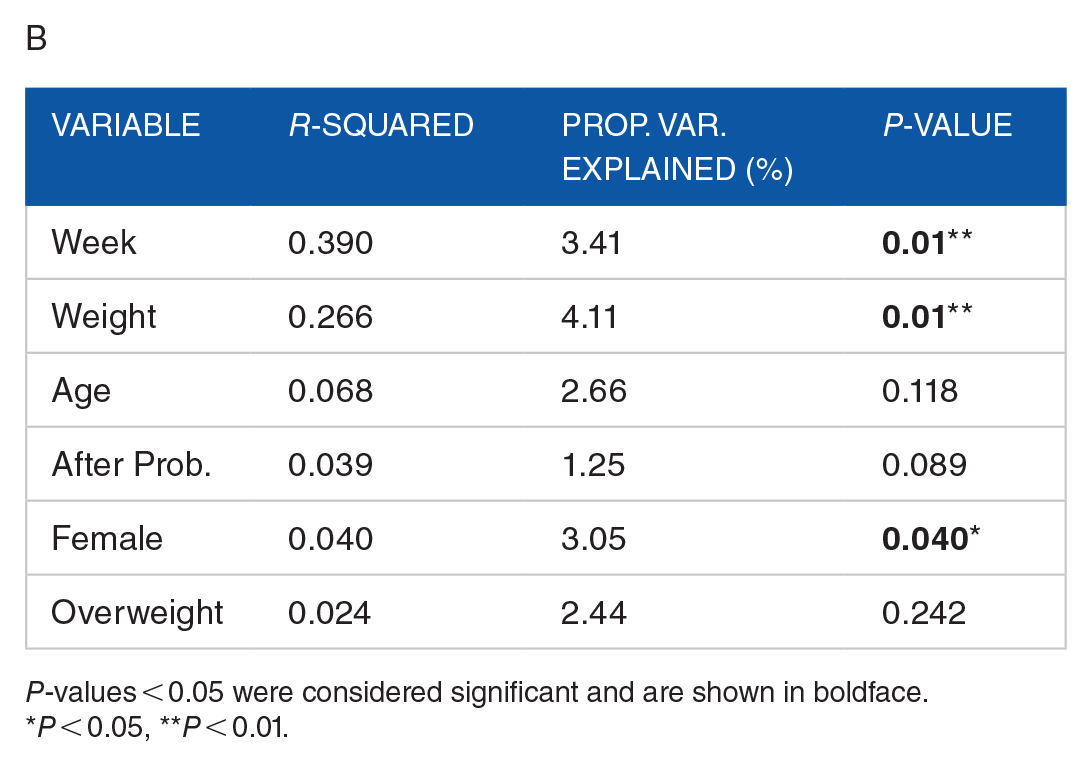
P-values < 0.05 were considered significant and are shown in boldface.
P < 0.05, **P < 0.01.
The probiotics intervention impact is further illustrated by looking at shifts within subjects. Stratifying by weight status, we plotted the samples before and after probiotics intervention per subject, connecting samples from the same subject by coloring them alike and drawing an arrow indicating before to after effect (Figure 4). The high variance across individuals regardless of phase and weight status implies probiotics intervention effects may be strongly confounded with high subject-to-subject variance and low sample size in this pilot study.
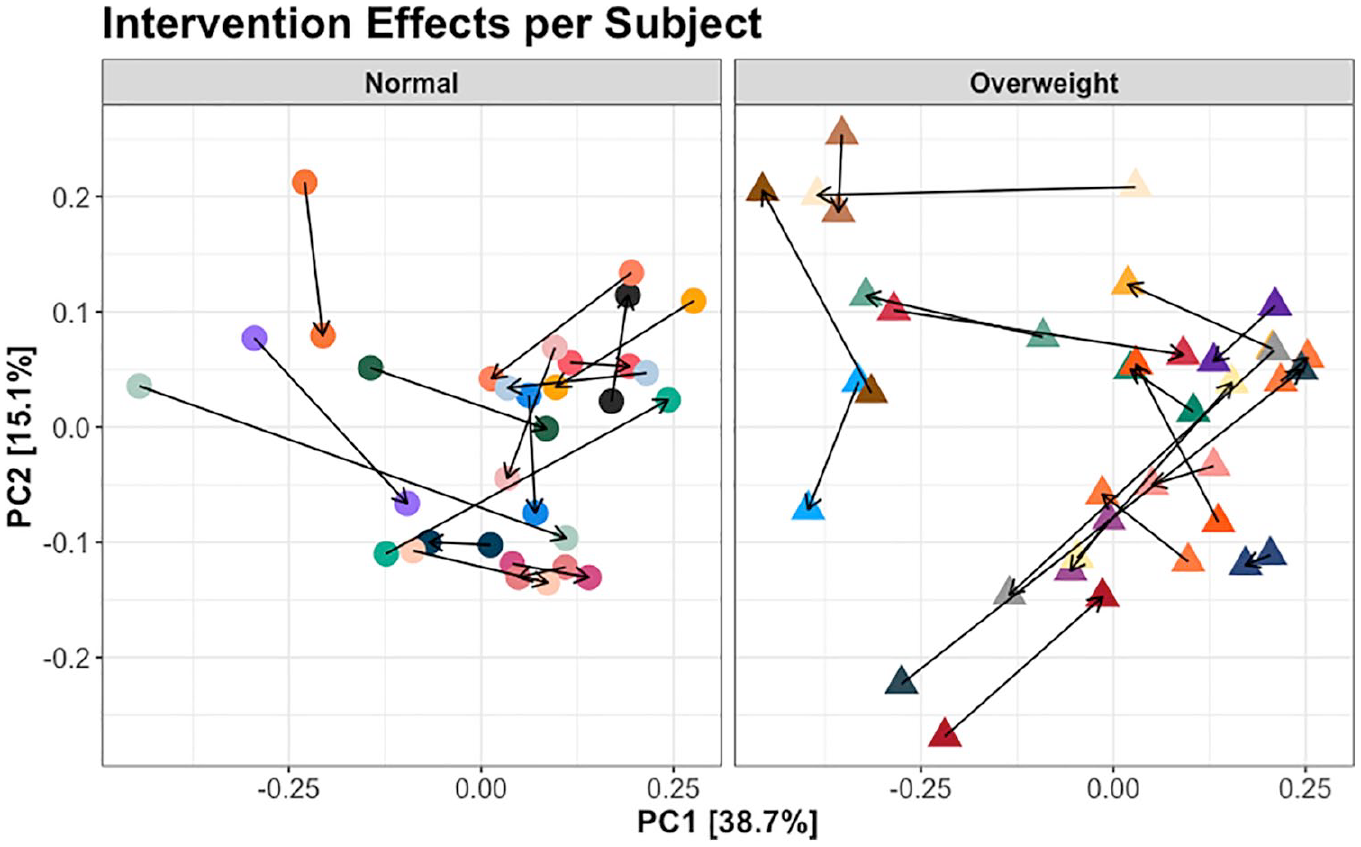
Principal coordinates analysis (PCoA) using weighted UniFrac distance displaying all individuals, stratified by weight status. Only samples immediately prior to and after the probiotic drink intervention are displayed, connected by an arrow indicating the direction of movement from before intervention to after intervention.
Relative abundance of the most prevalent bacteria at varying taxonomic ranks
Genus-level taxonomic profiling of normal and overweight subjects revealed varied changes in bacterial relative abundance with probiotic intervention (Figure 5). Normalized for relative abundance taxonomic tables were collapsed to various taxonomic ranks, namely phylum, family, genus, and species. Each taxonomic rank table was evaluated per taxon for association with the probiotic intervention using a Mann–Whitney U test (P-values < 0.05 considered significant). Significant taxon shifts observed across all samples as well as after stratifying by normal and overweight weight status were retained for generation of a bar plot describing the number of significantly impacted taxa after probiotics intervention (Figure 6).
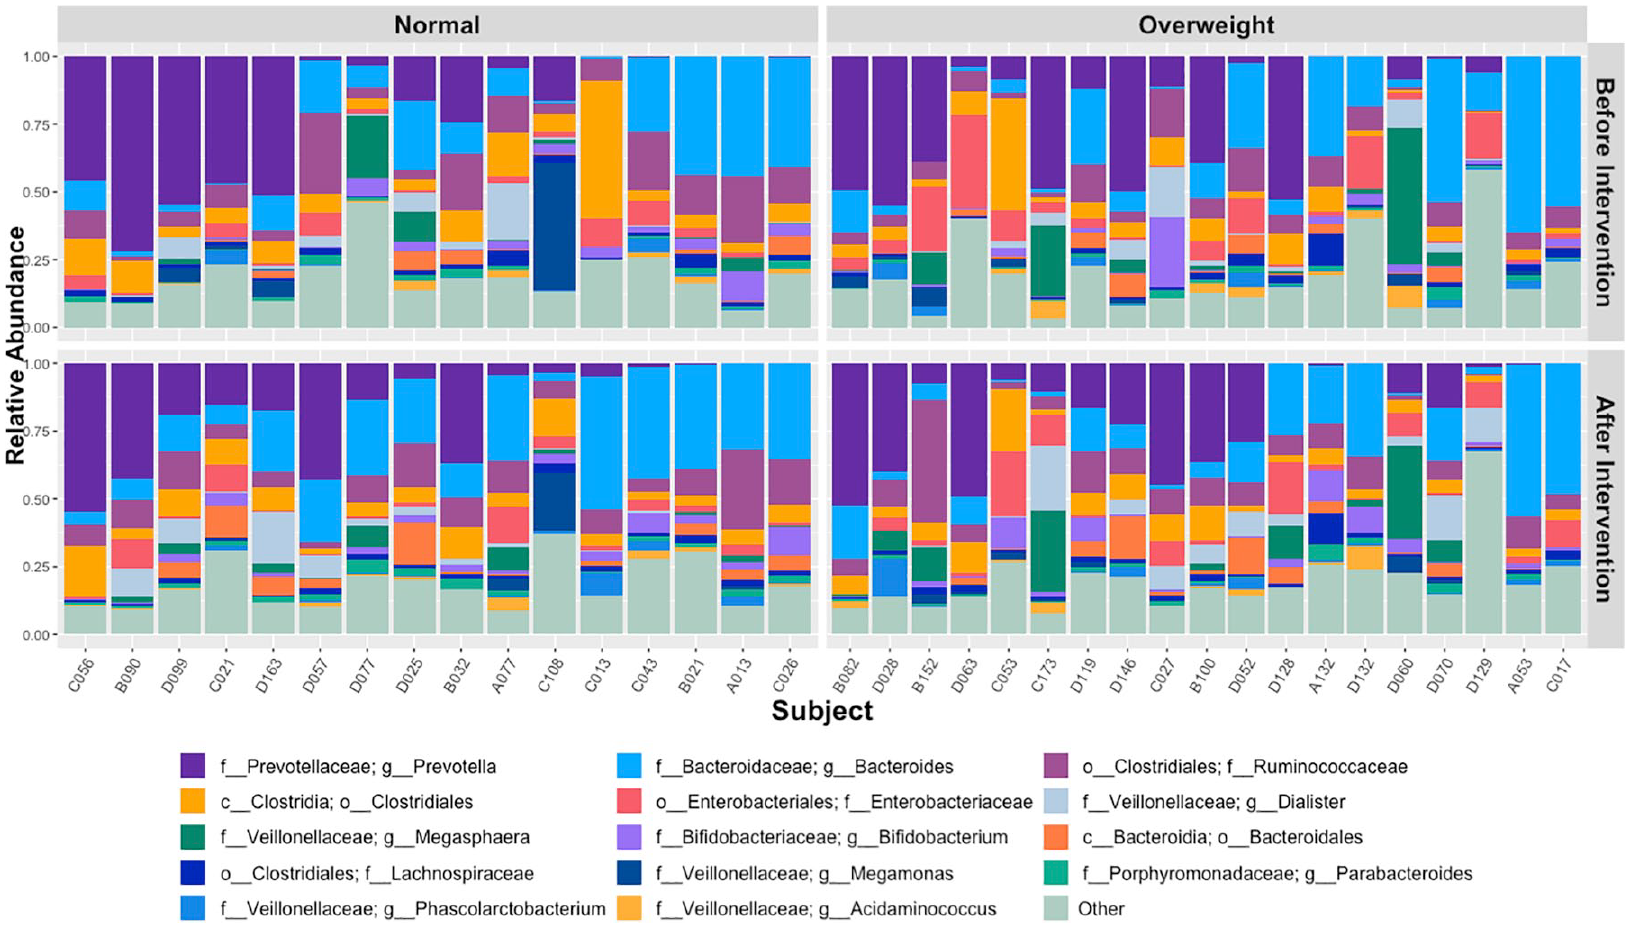
Changes in the relative abundance of taxa at the genus level before intervention and after intervention, per subject. Only the first 14 most abundant genera overall are named, others are summed up into an “Other” category.
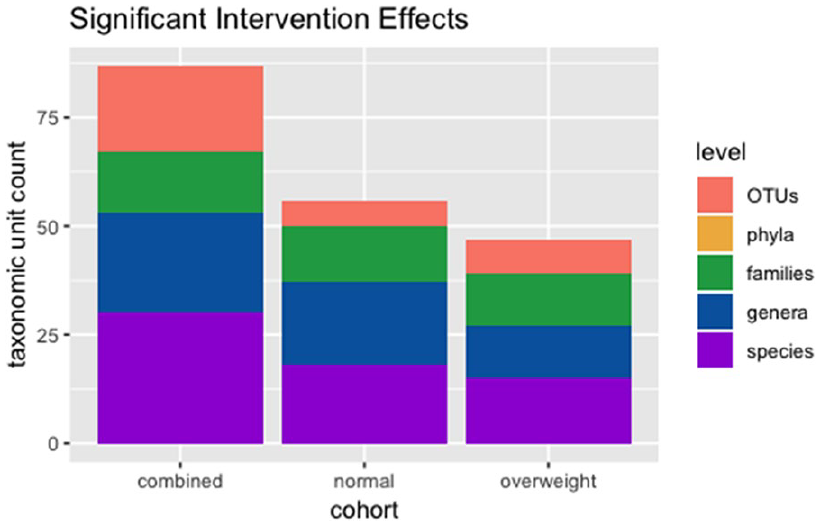
A bar chart indicating the number of taxa at varying taxonomic levels found to be significantly impacted by the probiotics intervention, regardless of weight status or another confounding variable. Significance was evaluated by a Mann–Whitney U test per taxon, with P-values < 0.05 considered significant.
Among the taxa significantly impacted by the intervention period, we decided to look closer at the difference in this impact between normal and overweight individuals. For instance, at the family level, overweight subjects were significantly depleted of Bacteroidaceae while normal subjects experienced a significant increase in Bacteroides after probiotics intervention (Figure 7A). A closer inspection of the species Bacteroides ovatus, an anaerobic gram-negative bacteria from the phylum Bacteroidetes, revealed a similar significant discrepancy between normal and overweight subjects (Figure 7B), likely contributing to the distinction seen in the Bacteroidaceae family. The Lachnospira genus was also found to be significantly impacted by intervention, but there was no significant relationship to weight status in this change (Figure 7C).

A closer look at taxa significantly impacted by intervention phases. In these plots, purple indicates a positive impact, orange indicates a negative impact. The family Bacteroidaceae (A) showed a significant difference between normal weight and overweight children in terms of intervention impact on the taxon (Mann–Whitney U test, P = 0.031). Within the Bacteroidaceae family is the Bacteroides ovatus species (B), which showed a similar significant distinction between weight statuses (Mann–Whitney U test, P = 0.017). However, not all taxa significantly impacted by the intervention were necessarily distinct in their intervention impact between weight statuses, as shown by the Lachnospira genus (Mann–Whitney U test, P = 0.12).
Phylogenetic diversity among normal and overweight children microbiomes
The heatmap (Figure 8) demonstrates the increase or decrease of all microbes specified at the phylum level in individuals after the probiotics intervention. Among all the phyla found, none showed a significant difference after intervention. The distinction between normal and overweight individuals is minimal, phylum-specific differences between the weight statuses were not found. So, we generated another heatmap describing taxa at the genus level after the probiotics intervention (Figure 9). Only genera showing a significant change (P < 0.05) across all individuals during intervention are displayed, hierarchically clustered according to their correlation with the intervention. Positively correlated genera with intervention are shown in blue, largely from the Bacteroidetes (Bacteroides, Alistipes, Odoribacter) and Firmicutes (Oscillospira, Lachnospira) phyla despite the lack of significance in intervention found in those phyla overall. Meanwhile, genera in the Proteobacteria (Acinetobacter, Pseudomonas, Proteus) phylum appeared to significantly decrease with the probiotics intervention.

Heatmap demonstrating the increase or decrease of microbes at the phylum level in individuals during the probiotics intervention phase. Blue indicates an increase in that phylum while red indicates a decrease in relative abundance.

Heatmap demonstrating the increase or decrease of microbes at the genus level in individuals during the probiotics intervention phase. Blue indicates an increase in that phylum while red indicates a decrease in relative abundance.
Discussion
Obesity has grown as an emerging public health problem worldwide affecting more than 24% children and adolescents. 22 Studies have demonstrated there are at least 18 co-morbidities that are attributed to overweight status and obesity including type 2 diabetes mellitus, cardiovascular diseases, Alzheimer’s disease, and cancer.23,24 Recent studies indicate that probiotics species play significant roles in sustaining the gut microbiota ecosystem in humans and help prevent obesity. Various studies investigated the association between obesity and the composition of the gut microbiota. This study was our first attempt to understand the impact of probiotics consumption on the gut microbiome diversity in normal and overweight children from Malaysia, a previously underrepresented group in microbiome literature.
Our results show that probiotic consumption (intervention) has led to different microbial alterations among normal-weight children compared to overweight children. Many studies have reported a lower alpha diversity in obese compared to normal-weight humans, but we found probiotics intervention did not significantly impact alpha diversity in 1 weight status group over the other.25-27 Rather, our pilot study found distinctions between weight statuses were primarily concentrated in overall microbial composition, where the probiotic drink had differing impacts on the child’s specific gut microbes depending on weight status.
Beta diversity analyses revealed the intervention may have caused perturbations in all the participants’ microbiomes. PCoA analysis per individual suggests that the populations’ microbiomes varied throughout the study, but significant impacts of intervention were sustained in the phase 1 group drinking the probiotic earlier in the study according to both weighted UniFrac measures and RDA. Constrained RDA revealed a significant impact of weight status on a smaller proportion of variance than described in weighted UniFrac and PCoA, but implies there are weight status distinctions among less influential taxa. The results are consistent with a study reported by Lin et al (2015) where a significantly distinct beta diversity was observed in obese individuals compared to that of normal weight. 28 Conversely, there are studies reporting an unchanged beta diversity between similar groups, so there is more work to be done with larger studies in a variety of geographic populations.29,30
Considering the relatively small proportion of variance in gut bacterial composition explained in our constrained RDA, we could presume that the effects on alpha and beta diversities differ according to various confounding factors not included in our analysis such as diet, physical activity, and geographical location of the participants’ homes. 31 We believe inconsistencies in literature and our findings may be results of the complex relationships between environmental, genetic, diet or clinical factors.32,33 We also believe our population size and study design limited our exploration of overall bacterial composition, as the sample sizes were too small to overcome individual bias in many instances of analysis.
Analysis of the bacterial community at the species level found that the proportions of Bacteroides ovatus, an anaerobic, gram-negative bacteria from the Bacteroides genus commonly found in the gut was markedly increased in normal-weight children but depleted in overweight children after the probiotics intervention. This is in agreement with other similar studies that reported an increase in bacterial species from the phylum Bacteroidetes in lean individuals. There was an increase in the bacterial species such as Bacteroides thetaiotaomicron and Bacteroides faecichinchillae from Bacteroides phylum and Blautia wexlerae, Clostridium bolteae, and Flavonifractor plautii species from the Firmicutes phylum among lean individuals. On the other hand, obese individuals had a larger composition on bacterial species belonging to the Firmicutes phylum such as Blautia hydrogenotorophica, Coprococcus catus, Eubacterium ventriosum, Ruminococcus bromii, and Ruminococcus obeum.3,34-37 These findings support the association of obesity with bacterial species from the Firmicutes and Bacteroidetes phyla. Future studies should focus on directly targeting theses phyla to differentiate weight status.
Finally, at genus level comparisons, Lachnospira and Ruminococcus were found to increase among overweight participants compared to normal weight participants. These findings, however, contradict previous studies. Previous studies have demonstrated that Ruminococcaceae and Lachnospiraceae are associated with SCFAs production and these genera were found to be depleted in overweight individuals compared to lean individuals.38,39
Our findings imply microbial dysbiosis is not a discriminative feature to distinguish overweight and normal-weight individuals. Rather, our results imply microbial composition can be successfully altered in either weight status with probiotics, but these alterations may be distinct between overweight and normal-weight children at various taxonomic ranks. The major limitations of our pilot study are the short intervention period and population size. A longer period of intervention could help us more precisely identify the effects of probiotics on the Malaysian child gut microbiome. Confounding factors such as physical activity and diet could also be better reported to identify their impact on probiotics and gut microbiota in both normal and overweight children. 40
Overall, our probiotics intervention was found to have numerous impacts across the participants regardless of weight status or intervention period, implying that the microbiome can be altered with probiotics with a significant chance of success. Yet, there is limited evidence supporting a distinct microbiome composition in overweight children as compared to normal-weight children following probiotics. This pilot study provides a framework for future research to study the effect of probiotics intervention on the gut microbiota profile.
Footnotes
Acknowledgements
This study was funded by the Exploratory Research Grant Scheme (ERGS) from the Ministry of Higher Education (MOHE), Malaysia [ERGS/1/2013/SKK10/UPM/02/2]. We gratefully acknowledge Associate Professor Dr. Dan Knights from the Department of Computer Science and Engineering and the Biotechnology Institute, University of Minnesota for logistical support.
Funding:
The author(s) disclosed receipt of the following financial support for the research, authorship, and/or publication of this article: We would like to acknowledge the Ministry of Higher Education (MOHE) of Malaysia, for granting us the Exploratory Research Grant Scheme (ERGS) (ERGS/1-2013/5527168) to support this study also this study was funded by the Exploratory Research Grant Scheme (ERGS) from the Ministry of Higher Education (MOHE), Malaysia [ERGS/1/2013/SKK10/UPM/02/2].
Declaration of conflicting interests:
The author(s) declared no potential conflicts of interest with respect to the research, authorship, and/or publication of this article.
Author Contributions
SAN, NJ, SLH, and AMH conceptualizated the data. JBC, CAL, SK, and BNMY wrote, reviewed and edited the manuscript. JBC, SLH, CAL, and SAN designed the data analysis.