
Abstract
Background:
EMID1 and EMID2 (also known as type XXVI collagen) are extracellular matrix (ECM) proteins that belong to the EDEN gene superfamily. Both proteins feature EMI domains, implicating them in protein-protein interactions and ECM remodeling. Despite structural similarities EMID1 and EMID2 have distinct functions with EMID1 primarily expressed in epithelial cells and EMID2 in mesenchymal cells. Previous studies have shown that while EMID1 could promote metastasis EMID2 might inhibit tumor growth and dissemination.
Objectives:
Little is known about the specific functions and mechanisms of EMID1 and EMID2 in tumor development. Therefore, this study aims to explore the biomarker potential of EMID 1 and EMID2 in cancer.
Design:
Retrospective study including a cross-sectional and a prognostic cohort to evaluate the biomarker potential of EMID1 and EMID2 in cancer.
Methods:
We developed 2 competitive ELISAs targeting the N-terminal of EMID1 and EMID2. We compared EMID1 and EMID2 levels in serum from patients with different types of cancer (n = 216) to levels in healthy controls (n = 33). Thereafter, we measured EMID1 and EMID2 levels in a second cohort of patients with metastatic colorectal cancer (mCRC; n = 212) in stage IV treated with chemotherapy in combination with bevacizumab.
Results:
The developed EMID1 and EMID2 ELISAs were specific, sensitive and robust. We did not find significant differences in EMID1 and EMID2 levels between patients with cancer and healthy controls, indicating limited diagnostic utility in cancer. However, in patients with mCRC, high EMID2 levels were associated with shorter PFS (241 days) compared to low levels (298 days) independently of other risk factors (HR = 1.57, 95% CI 1.04-2.36, P = .031). Kaplan-Meier survival analysis showed no association between low or high levels of EMID1 or EMID2 and overall survival (OS).
Conclusion:
This study highlights EMID2 as prognostic biomarker in patients with mCRC, where higher levels correlated with more aggressive disease and shorter PFS. Future research should focus on elucidating the mechanisms underlying EMID2 degradation and its implications in cancer progression. Although EMID1 did not show diagnostic or prognostic value in this study, its biomarker potential in other types of cancer or benign diseases warrants further investigation.
Introduction
Cancer remains a significant global health challenge, with early detection and accurate monitoring being pivotal for improving patient outcomes. 1 Traditional diagnostic approaches often rely on invasive procedures and imaging techniques, which can be costly, uncomfortable and associated with potential risk to patients. In recent years, there has been growing interest in the development of non-invasive cancer biomarkers that can provide reliable diagnostic and prognostic information through minimally invasive means. 2 Extracellular matrix (ECM) components, particularly collagen fragments, have emerged as promising candidates for such biomarkers.3 -17 Collagens, the most abundant proteins in the ECM, undergoes dynamic remodeling processes during tumorigenesis, leading to the release of specific fragments into the bloodstream. 18 Measurement of these ECM fragments holds great potential for non-invasive detection and monitoring of various cancer types, offering the possibility of earlier detection, improved risk stratification and personalized treatment approaches. 19
Over the years, extensive research has identified 28 different collagen types, each exhibiting structural and functional properties. Among these, emilin multimerin domain-containing protein 2 (EMID2/Emu2; classified as type XXVI collagen) stands out. EMID2 remains poorly understood, does not neatly fit into any established collagen subfamily, presenting unique challenges for classification and functional characterization. 20 The EMID2 gene is part of the EDEN (Emi Domain Endowed) gene superfamily, which includes genes featuring a shared EMI (Elastin Microfibril Interfacer) domain that is believed to serve as module for protein-protein interactions.21,22 Within the EDEN gene superfamily, EMID2 alongside EMID1 collectively forms the EMU family. 21 Both proteins share similar structural features, an N-terminal signal peptide followed by the EMI domain, an interrupted collagen domain and a conserved C-terminal domain whose function remains unidentified. 23 Despite these similarities only EMID2 is considered a collagen, and the 2 proteins exhibit distinct expression patterns in organs undergoing epithelial-mesenchymal interactions. Whereas EMID1 is predominantly found in epithelial cells, EMID2 is primarily expressed in mesenchymal cells. They are secreted glycoproteins bound to the ECM and can form homo- and heterotrimers through disulfide bonding. Furthermore, their diverse expression profiles during mouse embryogenesis suggest multifunctionality, potentially involving interaction with various ECM components to integrate molecular functions. 23 While EMID1 expression is primarily confined to kidney development, EMID2 exhibits increased expression levels in the testis and ovaries, suggesting a potential role for EMID2 in developmental processes. 24 In cancer, EMID1 mRNA levels were upregulated in osteoblastic bone metastases from patients with prostate cancer compared to osteolytic ones. Immunohistochemistry (IHC) experiments showed no significant difference in cytoplasmatic expression between the 2 types, however, nuclear expression was typically higher in osteoblastic samples. 25 In another study, EMID1 was found downregulated in advanced stage III ovarian granulosa cell tumors compared to early-stage ones (stage I). 26 Regarding the role of EMID2 in cancer, researchers suggest that EMID2 overexpression inhibits tumor growth and metastasis in lung and pancreatic cancer by disrupting TGF-β maturation and cancer associated fibroblast (CAF) activation, resulting in reduced ECM stiffness and expression of nuclear YAP in cancer cells.27,28 Further, bioinformatic analysis have shown that EMID2 expression was upregulated and associated with poor prognosis and increased cell infiltration in patients with thyroid carcinoma (THCA). 29 Nevertheless, the roles of EMID1 and EMID2 remain largely unexplored, particularly in relation to cancer.
Based on observations that collagen fragments occur in circulation of patients with cancer we hypothesized that EMID1 and EMID2 could also be detected in the circulation of cancer patients and may have non-invasive biomarker potential. To investigate this, we developed 2 competitive enzyme-linked immunosorbent assays (ELISAs) targeting the N-terminal of EMID1 and EMID2. We validated both assays technically and assessed their use as diagnostic and prognostic biomarkers in cohorts of patients with different cancer types.
Materials and Methods
EMID1 and EMID2 Assay Development
The peptides 23WSIGAAPFSG33 (EMID1; UniprotKB: Q96A84) and 21TGFLYPFSAA31 (EMID2; UniProtKB: Q96A83) selected as antibody targets were purchased from Genscript (Piscataway, NJ, USA). Figure 1 shows a schematic illustration of EMID1 and EMID2 proteins. The peptides used for immunization (EMID1: WSIGAAPFSG-GGC-KLH and EMID2: TGFLYPFSAA-GGC-KLH) were synthesized by covalently cross-linking the target peptide to the Keyhole Limpet Hemocyanin (KLH) carrier protein via Sulfo-SMCC (sulfosuccinimidyl 4-(N-maleimidomethyl) cyclohexane-1-carboxylate; Thermo Scientific, USA, cat. no. 22322). Glycine and cysteine residues were appended at the N-terminal end to ensure proper attachment to the carrier protein. Antibodies were elicited through subcutaneous immunization of 6-week-old Balb/C mice with 200 µL of emulsified antigen containing 100 µg of the immunogen mixed with Sigma Adjuvant System (Sigma cat. no. S6322) Specol (Invitrogen cat. no. 7,925,000). Immunizations were conducted with intervals of 2 weeks until consistent serum titers were achieved. The mouse exhibiting the highest titer and specific immune response was rested for 4 weeks before receiving a booster dose of 100 µg immunogenic peptide in 100 µL 0.9% NaCl solution intravenously. Hybridoma cells were generated by fusing spleen cells with SP2/0 myeloma cells following established procedures. 30 The resulting hybridoma cells were then cultured in 96-well microtiter plates, and standard limited dilution was employed to ensure monoclonal growth. The monoclonal antibodies were purified with protein-G-columns as per the manufacturer’s guidelines (GE Healthcare Life Sciences, Little Chalfont, UK, cat. no. 17-0404-01). The optimal antibody clone for each biomarker was selected based on an initial competitive ELISA assessing specificity toward the target peptide and lack of reactivity toward variations of the peptide sequence. These variations included an elongated peptide with an additional amino acid at the N-terminal, a truncated peptide with the removal of the first N-terminal amino acid, a non-sense peptide and a non-sense biotinylated coating peptide. Additionally, a biotinylated selection peptide served as a coating peptide (Table 1).
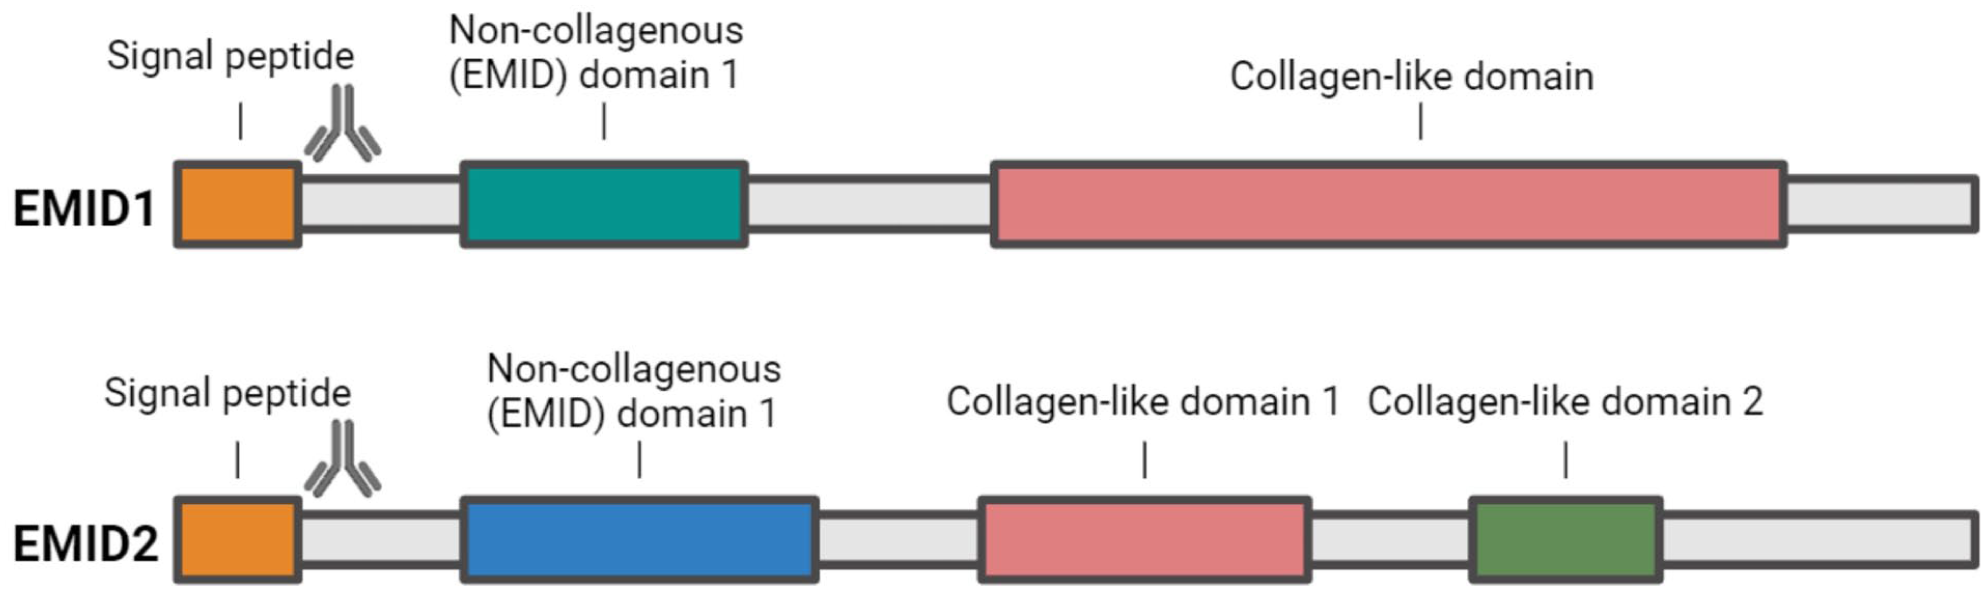
Schematic representation of the primary structure of EMID1 and EMID2, highlighting their functional domains.
Synthetic Peptides Used for Development and Validation of the EMID1 and EMID2 ELISA Assays.

Technical Evaluation of EMID1 and EMID2 ELISA
The technical performance of EMID1 and EMID2 ELISA assays underwent various validation tests including determination of the lower limit of measurement range (LLMR), upper limit of measurement range (ULMR), inter- and intra-assay variation, dilution recovery, spiking recovery, analyte stability (freeze/thaw and storage) and examination of potential interference from substances commonly found in serum and that could interfere with antibody binding such as lipids, biotin and hemoglobin. EMID1 antibody specificity was evaluated by the inhibition of signal by 2 different standard peptides, a 10 amino acid version (WSIGAAPFSG) and a 30 amino acid version (WSIGAAPFSGRRNWCSYVVTRTISCHVQNG) as well as an elongated (AWSIGAAPFSG) and a truncated peptide (SIGAAPFSG). Similarly, for EMID2 we used a 10 amino acid peptide (TGFLYPFSAA), a 30 amino acid peptide (TGFLYPFSAAALQQHGYPEPGAGSPGSGYA), and elongated peptide (ATGFLYPFSAA), a truncated peptide (GFLYPFSAA) as well as the selection peptide from EMID1 (WSIGAAPFSG) as non-sense peptide.
The analytical measurement range spanned from the lower limit of measurement range (LLMR) to the upper limit of measurement range (ULMR), which was estimated based on 10 separate runs, focusing on the linear portion of the standard curve. Inter- and intra-assay variation were assessed through 10 independent runs conducted on different days using 5 quality control samples. In each run samples were measured in duplicates and included 3 serum samples and 2 samples containing standard peptide spiked into buffer. Intra-assay variation was determined as the mean CV% (coefficient of variance) within plates, while inter-assay variation was calculated as the mean CV% across samples from the 10 individual runs. Linearity (MRD), evaluated through dilution recovery, was determined using twofold serial dilutions of 4 human serum samples and expressed as the percentage recovery of the undiluted samples. Assay accuracy was evaluated through spiking recovery by spiking either the EMID1 or the EMID2 standard peptide into 3 human serum samples with known concentrations. Spiking recovery was determined by comparing the measured levels of EMID1 and EMID2 to their expected concentrations. Analyte stability was assessed by subjecting 3 serum samples to repeated freeze/thaw cycles and by incubating the samples at different temperatures and different incubation times. Freeze/thaw recovery was calculated relative to the EMID1 and EMID2 levels of a non-stressed sample. Additionally, EMID1 and EMID2 levels were measured after 4, 24 and 48 hours of storing the samples at 4°C, 20°C and 37°C. Recovery percentages were calculated using non-stressed samples stored at −20°C as the reference. Interference was determined by spiking low and high concentrations of hemoglobin (2.5/5 mg/mL), lipids (1.5/5 mg/mL) and biotin (5/100 ng/mL) into a serum sample with a known concentration. Recovery percentages were calculated relative to the EMID1 and EMID2 levels of a non-spiked serum sample.
EMID1 and EMID2 ELISA Protocols
The competitive EMID1 and EMID2 ELISAs were conducted following optimization of the antibody/coater ratio, incubation parameters (buffer, incubation time and temperature). In a 96-well streptavidin-coated microtiter plate, 100 uL of biotinylated peptide (EMID1: 1.25 ng/mL, EMID2: 29 ng/mL) dissolved in assay buffer (EMID1 and EMID2: 50 mM PBS-BTB 8 g NaCl/L, pH 7.4) was added and incubated for 30 minutes at 20°C in darkness with shaking (300 rpm). After 5 rounds of washing (1.25 M Tris, 2.5 M NaCl, 5% (v/v) Tween20, pH 7.2), 20 µL of standard peptide or serum sample (diluted 1:2 in assay buffer) was added to appropriate wells, followed by the addition of 100 µL HRP-conjugated antibody for EMID1 (30 ng/mL) or EMID2 (81 ng/mL) dissolved in assay buffer. The plate was incubated for 20 hours at 4°C (EMID1) or 3 hours at 4°C (EMID2) in darkness with shaking (300 rpm). After 5 washes, 100 uL of Tetramethylbezidine (TMB) was added to the EMID1 plate and incubated in darkness for 15 minutes at 20°C with shaking (300 rpm). The reaction was stopped by adding 100 μL of 1% sulfuric acid (H2SO4), and the EMID1 plate was analyzed in a VersaMax ELISA microplate reader at 450 nM with 650 nM as reference. For the EMID2 plate, 100 uL of Roche’s BM chemiluminescence ELISA substrate (POD) was added and incubated in darkness for 3 minutes at 20°C and the plate was read immediately after with SpectraMax i3x ELISA microplate reader. A standard curve was plotted using a 4-parametric and 5-parametric logistic curve fit model for EMID1 and EMID2 assays respectively, and data were analyzed using GraphPad Prism version 10.2.2.
Patient Samples
The first cohort consisted of serum samples obtained from 216 patients diagnosed with cancer. This cohort included 11 different groups, each comprising patients diagnosed with different types of cancer including bladder (20), breast (20), colorectal (20), head and neck (20), stomach (18), kidney (20), lung (19), ovarian (20), pancreatic (19), prostate cancer (20) and melanoma (20). Additionally, 33 age-matched healthy controls were included. Serum samples from cancer patients were sourced from Proteogenex (Los Angeles, CA, USA), while those from healthy controls were obtained from BioIVT (Westbury, NY, USA). All samples were stored at −80 °C until analysis. A detailed overview of the cohort characteristics is provided in Table 2. The vendors ensured that sample collection adhered to ethical guidelines, with approval obtained from the Institutional Review Board or Independent Ethical Committee and informed consent obtained from all patients. Specifically, approval was granted by the Russian Oncological Research Centre n.a. Blokhin RAMS (PG-ONC 2003/1) and the Western Institutional Review Board, Inc. (WIRB® Protocol #20161665). All procedures were conducted in accordance with the principles outlined in the Helsinki Declaration.
Demographics of the Proteogenex Cohort.
The second cohort included baseline serum samples from 212 patients diagnosed with metastatic colorectal cancer (mCRC) and were included in the biomarker study CREBB “ColoRectal cancer – Evaluation of Biomarkers in Bevacizumab treatment” conducted between 2011 and 2016 across 3 Danish and 4 Swedish hospitals. The study encompassed patients initiating palliative treatment with standard chemotherapy and bevacizumab, regardless of the treatment line. Serum samples were collected at baseline before the commencement of bevacizumab combined with chemotherapy.
Nordic Bioscience received anonymized serum samples along with associated clinical data. Healthy controls (28) were obtained from BioIVT (Westbury, NY, USA). Table 3 provides an overview of the cohort’s characteristics.
Demographics of the CREBB Cohort.

Statistical Analysis
In the first cohort EMID1 and EMID2 levels comparisons among groups were examined using the Kruskal–Wallis test followed by pairwise comparisons to the control group using Dunn’s test. In the second cohort unpaired t-test was performed to compare EMID1 and EMID2 levels between patients with mCRC and healthy controls. Survival analyses for both progression-free survival (PFS) and overall survival (OS) were conducted using the Kaplan-Meier method. Patients were stratified into high and low EMID1 or EMID2 groups based on a cut-off value determined from a Receiver Operating Characteristic (ROC) curve analysis. The ROC analysis utilized EMID2 and EMID1 levels to predict disease progression and OS, with the outcome variable coded as 0 if the disease did not progress or if the patient was alive at time of follow-up and 1 if the disease progressed or the patient died. The optimal cut-off for EMID1 and EMID2 was selected using the maximum Youden’s index, which maximizes the sum of sensitivity and specificity.
For PFS, the time was calculated from the date of diagnosis to the date of disease progression or the last follow-up if progression had not occurred. For OS, the time was calculated from the date of diagnosis to the date of death or the last follow-up if the patient was still alive. The differences in PFS and OS between the 2 EMID1 and EMID2 level groups were assessed using the log-rank test. Hazard ratios (HRs) and their 95% confidence intervals (CIs) were estimated using Cox proportional hazards regression models to quantify the association between EMID2 levels and PFS following adjustments for age, sex, total drug count, location of primary tumor, synchronous metastases, performance status, primary tumor removal, number of metastatic sites and baseline PRO-C3 levels. Significance was defined with P-values less than .05 as follows: *P < .05; **P < .01; ***P < .001; ****P < .0001.
Graph design and statistical analyses were performed with GraphPad Prism (version 10.2.2 for Windows, GraphPad Software, San Diego, California USA, www.graphpad.com), R version 4.3.1 (R Core Team (2023), R Foundation for Statistical Computing, Vienna, Austria, https://www.R-project.org) and MedCalc® Statistical Software version 22.003 (MedCalc Software Ltd, Ostend, Belgium; https://www.medcalc.org; 2023).
Reporting Guidelines
The reporting of this observational biomarker study conforms to the STROBE (Strengthening the Reporting of Observational Studies in Epidemiology) statement. 31 The completed checklist is provided as Supplemental File 1.
Results
Specificity of EMID1 and EMID2 ELISA Assays
To confirm the specificity of EMID1 and EMID2 antibodies toward their target sequence, their reactivity was assessed against standard, elongated and truncated peptides for the EMID1 antibody and against standard, elongated, truncated and non-sense (standard from EMID1) peptides for the EMID2 antibody (Table 1). Both selection peptides inhibited the signal in a dose-dependent manner. For the EMID1 antibody, there was no reactivity toward elongated peptide, however, the antibody recognized not only the selection but also the truncated peptide. The EMID2 antibody recognized both the elongated and the truncated versions of the peptide but did not bind to the non-sense peptide, suggesting that the EMID2 antibody is not neoepitope specific but sequence specific (Figure 2).
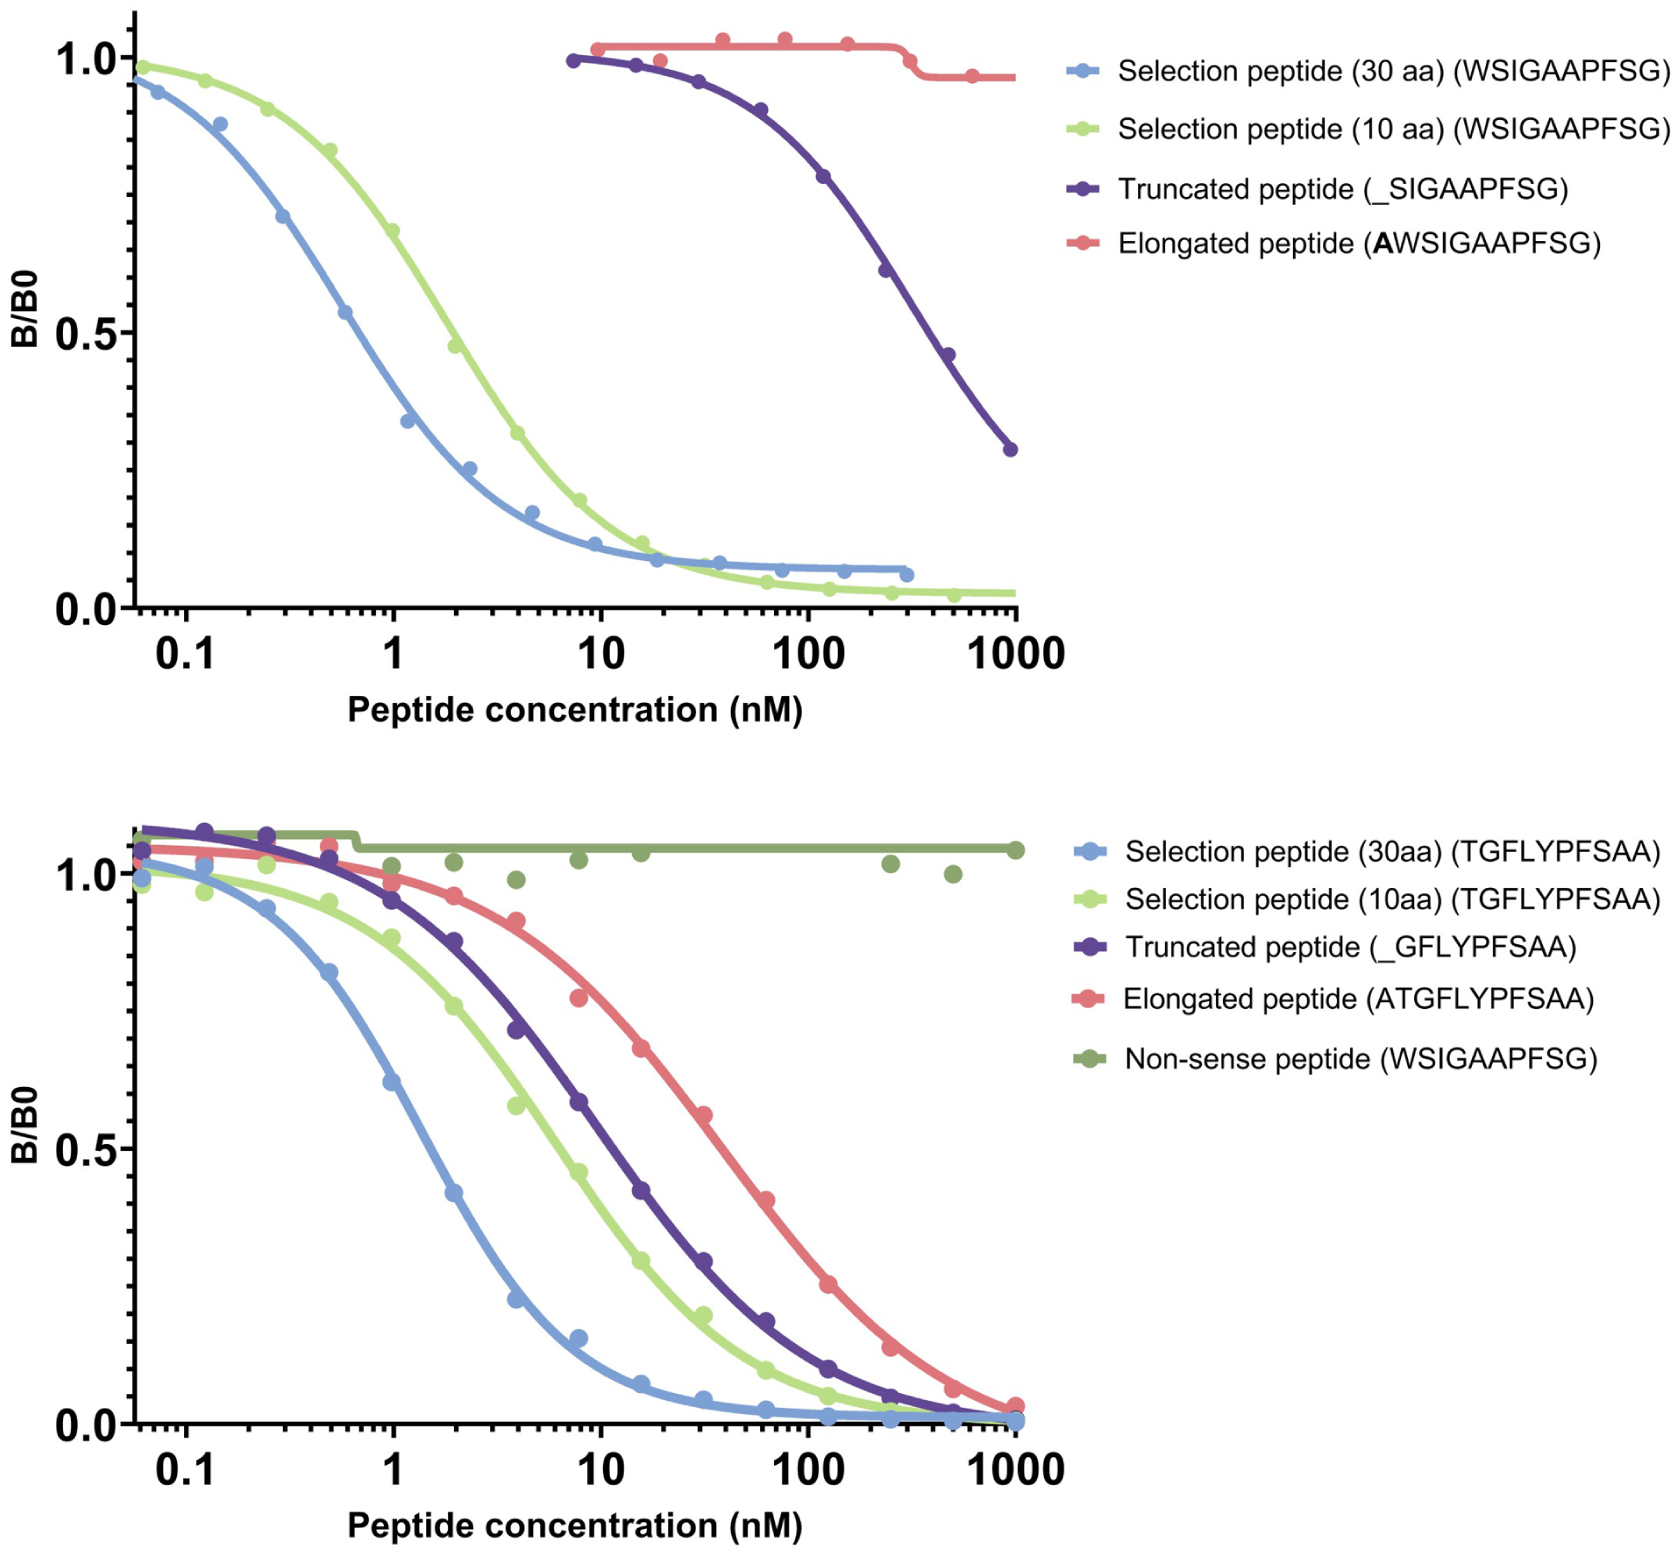
EMID1 (upper) and EMID2 (lower) ELISA specificity. Inhibition curve for the standard peptides, elongated peptides, truncated peptides and non-sense peptide. Peptides were serially diluted twofold to assess their ability to compete for antibody binding. The signal (B) is presented as a fraction of the background absorbance (B0), which corresponds to the assay buffer, plotted against the peptide concentration on a logarithmic scale.
EMID1 and EMID2 Technical Evaluation
The technical specifications of the EMID1 and EMID2 ELISA assays are outlined in Table 4. The measurement range (LLMR-ULMR) was determined as 2.29 to 150.35 nM for EMID1 and 0.86 to 15.32 nM for EMID2. Intra and inter-assay variation was 8.1% and 14.4% for EMID1, and 7.2% and 8.5% for EMID2. Dilution recovery from human serum was accepted from undiluted to 1:4 dilution for EMID1 (MRD = 1) and from 1:2 to 1:8 dilution for EMID2 (MRD = 2). The mean spiking recovery was 111.6% for EMID1 and 89.5% for EMID2. Analyte stability was assessed under freeze/thaw cycles and different storage conditions. The EMID1 showed full recovery after 5 cycles whereas EMID2 had good recovery up to 4 cycles. Regarding EMID1, the analyte was recovered after storage of human serum at 20°C and 37°C for 24 hours and for EMID2, the analyte was stable up to 48 hours at 20°C. For EMID1, interference tests resulted in accepted recovery rates (80%-120%) for hemoglobin and lipids but interference with biotin was observed with concentrations above 40 ng/mL in sample. Regarding EMID2, interference tests resulted in accepted recovery rates for the 3 analytes tested.
Technical Validation of EMID1 and EMID2.

Clinical Evaluation of EMID1 and EMID2 in Patients with Different Types of Solid Cancer
Our results indicated no significant difference in the levels of EMID1 and EMID2 between the cancer patients and the healthy controls (Figure 3). Consequently, neither EMID1 nor EMID2 appears to possess diagnostic value for distinguishing cancer patients from healthy individuals. These findings suggest that the utility of EMID1 and EMID2 as biomarkers may lie elsewhere, perhaps in other aspects of cancer progression or treatment response, rather than in initial diagnosis.

Quantification of EMID1 (upper) and EMID2 (lower) levels in serum from patients with bladder (20), breast (20), colorectal (20), head and neck (20), kidney (20), lung (19), ovarian (20), pancreatic (19), prostate (20), stomach cancer (18) and melanoma (20), as well as 33 age-matched healthy controls. EMID1 and EMID2 levels are shown as Tukey-style boxplots. Samples with measurements below LLMR were assigned the LLMR value determined during assay validation. Differences in EMID1 and EMID2 levels among groups were analyzed using Kruskal-Wallis test corrected for multiple comparisons using Dunn’s test.
EMID2 as Prognostic Biomarker in Patients with mCRC
To investigate the prognostic potential of EMID1 and EMID2 we measured the biomarkers in a cohort of patients with mCRC (Table 3). We observed higher levels of EMID2 in cancer patients with advanced disease compared to the healthy controls (P < .05), while the levels of EMID1 were similar between the 2 groups (Figure 4). Thereafter, we evaluated the prognostic value of EMID1 and EMID2 independently from each other. Patients were divided into groups based on biomarker levels: low EMID1 or EMID2 and high EMID1 or EMID2 using the cut offs determined by the ROC analysis. Kaplan-Meier survival analysis showed no association between EMID1 or EMID2 levels and overall survival (OS; Supplemental Figure 1). However, patients with high EMID2 levels had a shorter progression-free survival (PFS) with a median of 241 days of compared to those with low levels of the biomarker with a median of 298 days (log rank, P = .01, whereas EMID1 levels did not associate with the prognosis of patients with mCRC (Figure 5).

EMID2 levels (right) were significantly elevated in patients with mCRC (n = 212) compared to healthy controls (n = 28). The comparison was conducted with an unpaired – t-test.

Kaplan-Meier plots showing that high EMID2 levels (right) are associated with shorter PFS in patients with mCRC.
To assess whether the association of EMID2 levels with PFS is independent of clinical co-variates, a multivariate Cox analysis was performed adjusting for: age, sex, total number of drugs, synchronous metastatic disease (Sync), location of the tumor, primary tumor resection (OP), performance status (PS), number of metastatic sites and type III collagen pro-peptides (PRO-C3) levels in serum at baseline. Even after accounting for the different co-variates, high levels of EMID2 were still predictive of shorter PFS and increased risk of disease progression or recurrence (HR = 1.65, 95% CI 1.04-2.6, P = .032; Supplemental Table 1).
Discussion
This study is the first to investigate the use of serum levels of EMID1 and EMID2 as non-invasive biomarkers in cancer. To achieve this, we developed and evaluated 2 ELISAs (EMID1 and EMID2) each of them targeting the N-terminal of the proteins respectively. Both assays demonstrated high sensitivity, detecting nanomolar concentrations of EMID1 and EMID2 in serum, as well as high specificity and accuracy within the complex matrix of serum samples. Moreover, the stability the analytes and reagents indicate assays’ robustness. Once technically validated, EMID1 and EMID2 were measured in 2 different cohorts of patients with cancer to investigate their biological relevance and biomarker potential in cancer.
Firstly, EMID1 and EMID2 diagnostic potential was assessed in a cohort of patients with different types of solid cancer and compared their serum levels with age-matched healthy donors. EMID1 and EMID2 could be detected in healthy individuals and in cancer patients, however, neither EMID1 nor EMID2 seemed to have diagnostic potential, as the different groups of patients showed similar levels of the biomarkers compared to healthy controls. A limitation of this study is the relatively small number of healthy controls compared to the number of patients, which may introduce sampling bias and affect the robustness of diagnostic comparisons. Furthermore, this study was designed as an exploratory analysis within a discovery cohort rather than establishing diagnostic performance. Therefore, the diagnostic findings should be interpreted with caution and require validation in larger, well-matched cohorts.
Next, we measured EMID1 and EMID2 in serum from a cohort of patients collected at baseline with mCRC treated with chemotherapy and bevacizumab. EMID2 levels were significantly elevated in patients with mCRC compared to healthy controls whereas EMID1 levels were not. Notably, no association was observed between EMID2 levels and OS. This may be explained by the influence of post-progression treatments which can substantially affect OS outcomes, as well as by disease heterogeneity within the cohort. It is also possible that circulating EMID2 primarily reflects early disease progression dynamics rather than long-term survival. Nevertheless, high levels of EMID2 were significantly associated with shorter PFS. Although the observed effect size is modest, it remained significant after adjustment for multiple clinical covariates, supporting its potential biological and clinical relevance in patients with mCRC. It could also potentially be used for risk stratification, allowing for more personalized treatment plans where patients with elevated biomarker levels may require more intensive or alternative therapeutic strategies. Additionally, EMID2 levels can be monitored over time to evaluate treatment efficacy, with fluctuations in its levels providing insights into the patient’s response to therapy. Furthermore, EMID2 could be used to select appropriate candidates for clinical trials, especially those testing new treatments that might benefit patients with high biomarker levels.
While the biological function of both EMID1 and EMID2 is unclear, there are studies suggesting that other proteins of the EDEN superfamily that includes EMID1 and EMID2, might play a role in cancer invasion and proliferation and hence also associate with tumor progression (and relapse). For example, experiments with mice where EMILIN1 was knocked out showed increased lymphangiogenesis in the tumor and in the sentinel lymph nodes, suggesting that EMILIN1 could prevent tumor growth by inhibiting lymphatic vessel formation and metastasis. 32 In normal conditions, EMILIN1 exhibits adhesion and migration properties through the interaction of its gC1q domain with α4/α9β1 integrins.33,34 During cancer, neutrophil elastase (NE) released in the TME cleaves EMILIN1 impairing its interaction with integrins and therefore inhibiting its anti-proliferative role.35,36
Recently, EMID2 has been proposed as anti-cancer treatment and has been associated with increased OS in patients with several types of cancer. In vivo, overexpression of EMID2 in lung carcinoma, led to the formation of more rounded tumor mass, indicating that cancer cells were less invasive. Moreover, tumors treated with EMID2 resulted in lower TGF-β active isoform and therefore reduced CAF activation. 27 Interestingly, in EMILIN1 and EMILIN3 the EMI domain inhibits TGF-β signaling, while in EMILIN2 the EMU domain modulates the Wnt signaling pathway which regulates crucial processes such as cell differentiation, proliferation and migration.37 -41 In contrast, according to some gene expression analysis in prostate and bladder cancer EMID1 could play a role in metastasis development.25,42 Another study indicates that EMID1 could promote cell proliferation and invasion independent of metastasis through the intracellular growth signaling pathway, while deposition of EMID1 below tumor cells and in the basement membrane (BM) disrupted their adhesion and caused the cells to detach from the ECM. 43 In contrast, prior research in lung cancer showed that patients with high expression of EMID1 had longer OS and immune infiltration whereas low expression was linked to advanced stage and metastasis. 44 Nevertheless, the precise molecular mechanisms underlying EMID1 function in relation to cancer have yet to be elucidated. Our results showed that EMID1 and EMID2 are not cancer diagnostic biomarkers, but high levels of circulating EMID2 in patients with mCRC were associated with shorter PFS. Importantly, the EMID2 ELISA is not neoepitope specific and could detect both intact and EMID2 fragments, thereby reflecting total circulating EMID2 levels rather than a specific proteolytic fragment. Nevertheless, given that EMID2 is an ECM protein, it is possible that circulating EMID2 primarily originates from proteolytic processing and release from the ECM rather than from freely circulating intact protein, and as it occurs with EMILIN1, the anti-invasive role of EMID2 may depend on it remaining intact. Upon cleavage, EMID2 could lose its functional integrity, therefore diminishing its anti-tumor properties. Nevertheless, we have not yet identified the specific proteases responsible for EMID2 cleavage, nor have we confirmed whether the observed fragments reflect an increase in total EMID2 expression or enhanced cleavage. Proteomic and neoepitope specific assay are required to elucidate the mechanisms behind EMID2 fragmentation and its functional consequences in cancer progression. We speculate that the anti-invasive role of EMID2 is dependent on its structural integrity, but our study did not investigate the functional impact of intact versus cleaved EMID2. Functional assays and structural analysis are necessary to substantiate this hypothesis, determining the biological activity of different EMID2 fragments. Finally, we also need to determine if, similar to EMILIN1 and EMILIN3, the EMU domain is the regulatory part that controls these processes. Moreover, the use of data-driven cut-off based on ROC analysis represents a limitation, and future studies should evaluate EMID2 as a continuous variable and validate predefined cut-offs in independent cohorts.
Conclusion
This study represents the first attempt to measure EMID1 and EMID2 levels in circulation using competitive ELISAs, marking a significant advancement in biomarker detection for these ECM proteins. We found no significant differences in the levels of EMID1 and EMID2 between cancer patients and healthy controls, indicating limited diagnostic utility. However, our analysis revealed that elevated circulating EMID2 is associated with shorter PFS in patients with mCRC. Future research should focus on elucidating the mechanisms underlying EMID2 fragmentation and its impact on cancer progression, as well as exploring the clinical utility of EMID2 measurement in guiding treatment decisions and monitoring disease progression in mCRC patients. In contrast, EMID1 did not show significant diagnostic or prognostic value in this study. However, the utility of EMID1 as a biomarker should not be dismissed prematurely. Further investigation is warranted to explore its potential roles in other aspects of cancer biology or in different cancer types, where it might still offer valuable insights.
Supplemental Material
sj-docx-1-bmi-10.1177_11772719261436895 – Supplemental material for Circulating EMID2 as a Prognostic Biomarker of Poor Outcomes in Patients with Metastatic Colorectal Cancer
Supplemental material, sj-docx-1-bmi-10.1177_11772719261436895 for Circulating EMID2 as a Prognostic Biomarker of Poor Outcomes in Patients with Metastatic Colorectal Cancer by Marina Crespo-Bravo, Sine R. Syversen, Jeppe Thorlacius-Ussing, Mogens K. Boisen, Maria Liljefors, Julia S. Johansen, Morten A. Karsdal and Nicholas Willumsen in Biomarker Insights
Footnotes
Acknowledgements
We would like to extend our gratitude to Astrid Z. Johansen from the Department of Oncology at Copenhagen University Hospital-Herlev and Gentofte Hospital for her valuable contribution to clinical data registration in the CREBB database.
Ethical Considerations
The study adhered to the guidelines outlined by the Danish Regional Committee on Health Research Ethics. Approval for the CREBB protocol was granted by the Danish Regional Committee on Health Research Ethics (Approval ID: H-3-2010-121) and the Data Protection Agency (Approval ID: 2007-58-0015/HEH.750.24-44).
Consent to Participate
All participants provided written informed consent in accordance with the principles of the Declaration of Helsinki.
Consent for Publication
Not applicable.
Author Contributions
Conceptualization: M.C.B. and J.T.-U. ; Data curation: M.C.B. S.R.S. ; Formal analysis: M.C.B. S.R.S.; Funding acquisition: M.A.K. and J.S.J.; Investigation: M.C.B., J.T-U., S.R.S., J.S.J.; Methodology: M.C.B., S.R.S., J.T.-U.; Project administration: N.W.I; Resources: M.K.B., M.L., J.S.J; Supervision: M.A.K. and N.W.I., Visualization: M.C.B.; Writing - original draft: M.C.B.; Writing – review and editing: S.R.S., J.T.-U., M.K.B., M.L., J.S.J, N.W.I, M.A.K. .
Funding
The authors disclosed receipt of the following financial support for the research, authorship, and/or publication of this article: The study was partly funded by the Danish Research Foundation.
Declaration of Conflicting Interests
The authors declared the following potential conflicts of interest with respect to the research, authorship, and/or publication of this article: M.A.K., N.W.I and M.C.B. are employed at Nordic Bioscience. S.R.S., J.T.-U., M.K.B., M.L. and J.S.J. have no conflict to declare. M.A.K., N.W.I own stock in Nordic Bioscience.
Data Availability Statement
The datasets generated and/or analyzed during the current study are available from the corresponding author on reasonable request, subject to institutional and ethical approvals.
Supplemental Material
Supplemental material for this article is available online.