
Abstract
Background:
Demographic, health history, and lifestyle factors have been associated with prognosis of colorectal cancer (CRC), but mechanisms underlying these associations remain poorly understood. A compelling mechanism involves changes in expression of tumor markers that influence treatment outcomes, such as secreted protein acidic and rich in cysteine (SPARC), lower levels of which have previously been associated with poorer CRC prognosis.
Objective:
We explored the association of factors that have been previously associated with CRC prognosis with expression of SPARC in tumor tissues.
Design:
We conducted a prospective evaluation of 50 participants of a longitudinal cohort study that went on to develop CRC.
Methods:
Tumor and normal tissue cores were taken from formalin-fixed paraffin-embedded (FFPE) blocks of incident CRC cases and were used to create tissue microarrays (TMAs). Slides created from the TMAs were stained with SPARC antibodies and analyzed to calculate H-scores for both epithelial and non-epithelial components of tumor and normal tissues. H-scores were ln-transformed and analyzed in association with demographic, lifestyle, and health history factors assessed before cancer diagnosis using linear regression models.
Results:
In CRC tumor epithelium, smoking was associated with a 0.53-fold lower level of SPARC expression (P = .054). Higher income was associated with a 1.33-fold greater level of SPARC expression in tumor non-epithelial tissue (P = .041). Higher cancer stage was associated with a 0.74-fold lower level of non-epithelial tumor SPARC expression (P = .040). In the epithelial component of normal colorectal tissues, higher fruit consumption was associated with a 2.74-fold greater SPARC H-score (P = .002).
Conclusions:
The associations we observed for smoking, income, and cancer stage with SPARC in tumor tissue are consistent with previously established associations of these factors with CRC prognosis. Larger studies with prognostic data are needed, but our results suggest that differences in SPARC expression may contribute to previously observed impacts of various factors on CRC prognosis.
Introduction
Various demographic, lifestyle, and health history factors have been associated with colorectal cancer (CRC) risk and mortality.1 -6 Multiple mechanisms have been proposed to underlie the impacts of these factors on CRC prognosis. For example, sex differences in prognosis have been attributed to the influence of sex hormones on the immune system. 7 The positive impacts of exercise on cancer prognosis have been attributed to improved immune function, as well as decreases in insulin and insulin-like growth factors. 6 Compelling mechanisms that have received comparatively little research attention involve changes in expression of tumor markers that influence treatment outcomes.8 -10
Secreted protein, acidic and rich in cysteine (SPARC) belongs to a family of matricellular proteins that modulate cell-matrix interactions and functions like wound repair, cell migration, and differentiation.9,10 SPARC expression has been studied in many types of cancers including CRC.9 -11 Evidence suggests that SPARC has an inhibitory role in colorectal tumor formation and metastasis.9,10,12
Increased SPARC expression in CRC tumors has been correlated with better disease survival and overall prognosis among CRC patients. 10 CRC patients with negative SPARC expression, weak positive SPARC expression, and strong positive SPARC expression were found to have 5-year survival rates of 57%, 71%, and 93%, respectively. 10 To date, no studies have evaluated associations of SPARC expression in tumor tissues with factors linked to CRC prognosis. To address this gap in knowledge, we used data and specimens from a longitudinal population-based cohort study to evaluate pre-diagnostically assessed demographic, health history, and lifestyle factors in association with SPARC expression levels in CRC tumor tissues.
Methods
Study Population
The British Columbia Generations Project (BCGP) is a prospective cohort study of 29 796 participants recruited from across British Columbia (BC). 13 Participants were between the ages of 35 and 69 at the time of recruitment which occurred between 2009 and 2016. At time of recruitment, participants completed a questionnaire capturing detailed demographic, lifestyle, personal medical history, and family medical history data.
Colorectal Cancer Case Ascertainment
Incident CRC cases were identified through annual linkage with the BC Cancer Registry. The BC Cancer Registry is a population-based registry to which pathology reports identifying new cancer diagnoses in BC are submitted from hospitals and regional pathology services. Ascertainment of cancers is virtually complete, capturing over 95% of all cancer cases diagnosed in BC. 14 As of 2020, 115 CRC cases were diagnosed among BCGP participants (ICD-O-3 site codes: C180-C199, C209; morphology codes: 80003, 80703, 81403, 82103, 82113, 82403, 82463, 82613, 82633, 84803, 84903).
Tumor Samples
The BCGP established a database of information from the pathology reports of incident cancer cases diagnosed among BCGP participants that can be used to aid in retrieval of tumor samples held at pathology laboratories. 15 Because biopsy samples would provide insufficient tissue for our study, we restricted to those CRC cases for whom resection pathology reports were identified. Of the 115 incident CRC cases diagnosed in BCGP, resection pathology reports were identified for 69 cases. Because neoadjuvant therapies may impact SPARC expression levels, we excluded 8 cases of stage III or greater rectal tumors since they are typically treated before resection, leaving a total of 61 eligible cases.
We applied to central pathology laboratories in each of 6 provincial health authorities (Fraser Health, Vancouver Coastal Health, Providence Health Care, Vancouver Island Health, Interior Health, and Northern Health) to access materials for the 61 eligible cases. From each central laboratory, we requested hematoxylin and eosin (H&E) slides previously created from the CRC resection samples. Slides for 7 of the 61 cases could not be located or were unavailable because of use by another study.
Slides for 54 cases were reviewed to identify the ideal formalin-fixed-paraffin-embedded (FFPE) blocks from which to create tissue microarrays (TMAs). Upon review of the blocks, 5 cases were deemed to have insufficient tumor tissue and 7 cases had insufficient normal tissue, leaving a total of 49 and 47 cases with tumor and normal tissue, respectively, for the study. A flowchart illustrating inclusion/exclusion criteria for the study is provided in Figure 1.
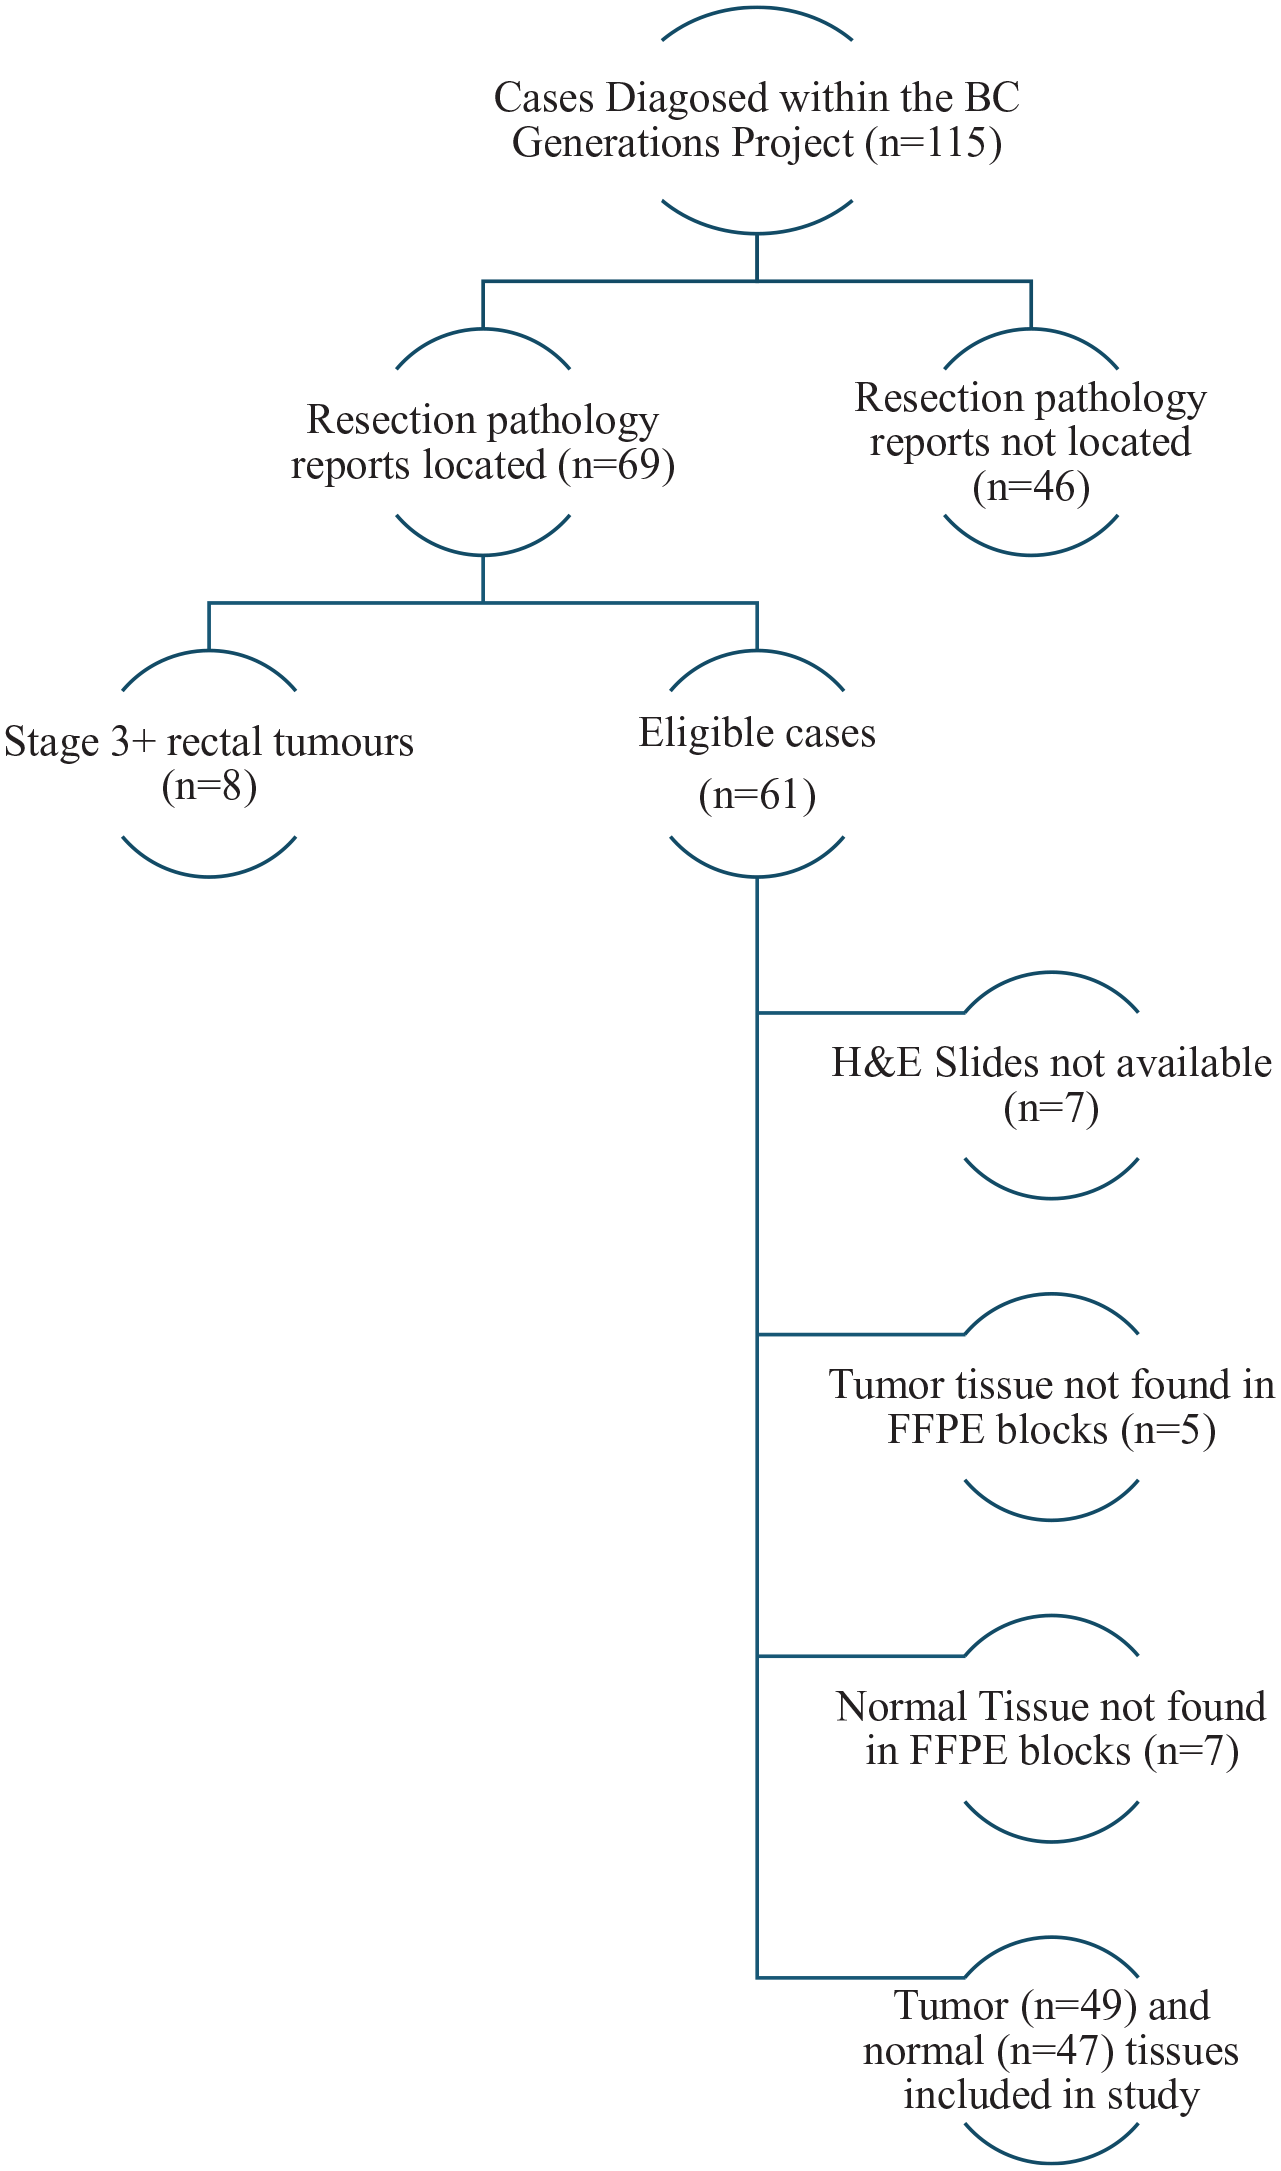
Inclusion/exclusion criteria for colorectal cancer cases.
Tissue Microarrays
The Biobanking and Biospecimen Research Services (BBRS) Lab at BC Cancer’s Deeley Research Centre created TMAs from the 49 tumor and 47 normal tissue samples. For TMA creation, two 0.6 mm cores from each of normal and tumor tissues were taken from the donor blocks for each case from morphologically representative areas and embedded into paraffin recipient blocks using a Beecher manual tissue arrayer. 16 TMA blocks were then sectioned using a Rotary Mictrotome (Microm HM355S) for the creation of slides. The TMA slides were dried at room temperature overnight and then stored at 4°C until ready for staining.
Immunohistochemistry
A rabbit monoclonal antibody to human SPARC antigen (SPARC D10F10; RRID:AB10860770) was obtained from Cell Signaling Technology (catalog number #8725) and used to stain the TMA slides on a Biocare Intellipath FLX autostainer. The slides were imaged using a Vectra 3 multispectral imaging system (Akoya Biosciences), and the resulting images were analyzed with inForm image analysis software. The software spectrally separated colors of the stain and classified tissues as epithelial versus non-epithelial (non-epithelial includes stroma and vascular tissues) to account for the differential expression of SPARC.
The peak optical density in a control tissue image was measured and separated into quadrants (0, 1, 2, or 3) using 3 algorithms with varying thresholds for stain intensity to account for differential expression between cells. The algorithms were generated by the inForm software using a training set of 10 images, and thresholds were slightly adjusted based on manual scoring by a pathologist of a small subset of the images. Algorithm 1 had the lowest threshold for stain intensity whereas algorithm 3 had the highest threshold for stain intensity. Images were then compared to ensure proper representation of staining within the tissue, and algorithms were adjusted based on scoring.
The frequency of cells with each value of stain intensity was multiplied by the stain intensity, and the products were summed to calculate H-score, which can range from 0 (100% of cells with stain intensity value of 0) to 300 (100% of cells with stain intensity value of 3). For each tissue type (epithelial and non-epithelial), H-scores were averaged across all 3 algorithms and between the 2 tissue cores for each participant.
Tumor Stage and Grade
Pathology reports were reviewed to ascertain tumor stage and grade. Information to assess stage and grade was available for 46 and 49 cases, respectively. Because we only had access to surgical pathology reports, we were only able to ascertain a minimum value for stage; additional reports may have revealed lymph node metastases which would have changed final staging. Tumor stage was dichotomized as low (pathologic stage of 0-2) versus high (pathologic stage of 3 or higher). Tumor grade was also dichotomized as low (well to moderate differentiation) versus high (poor to no differentiation).
Demographic, Health, and Lifestyle Data
At time of recruitment, participants completed a detailed questionnaire that ascertained demographic factors (biological sex, age, ethnicity, before tax annual household income from all sources, and highest level of education), health history (history of CRC among biological mother and father), personal history of routine CRC screening (fecal immunochemical test, colonoscopy, or sigmoidoscopy), and lifestyle factors [sleep duration including naps (hours/day), daily fruit consumption (servings/day excluding fruit juice; 1 serving is 125 mL of fresh, frozen or canned fruit), daily vegetable consumption (servings/day; one serving is 125 mL of fresh, frozen, canned or cooked leafy vegetables), alcohol consumption (standard drinks/week; 1 standard drink is 1 glass of wine, 1 bottle or can or glass of beer, 1 straight or mixed drink with 45 mL of liquor), smoking history (ever smoked 100 cigarettes), and physical activity (minutes/week of global physical activity in metabolic equivalent)]. For some participants, measurements of height and weight, for the calculation body mass index (BMI), were available from in-person assessments conducted at time of recruitment. For those without in-person measurements, height and weight data from the questionnaire were used to calculate BMI.
For the assessment of physical activity, participants completed either the long or short versions of the International Physical Activity Questionnaire (IPAQ), from which total minutes/week of global physical activity in metabolic equivalent (MET) was calculated. Because the long version assesses physical activity across 6 separate domains (occupational, transport, yard, household, leisure, and sitting) whereas the short version only generally assesses time spent walking and in moderate and vigorous intensity physical activity, 17 measures of physical activity from the 2 forms tend to show poor agreement. 18 For the 21 430 BCGP participants that completed the short version of IPAQ and separately for the 7821 BCGP participants that completed the long version of IPAQ, we calculated the median minutes/week of global physical activity in MET. The median minutes/week of global physical activity in MET for participants that completed the short and long versions was 2280 and 3016 MET-minutes/week, respectively. Physical activity levels were then dichotomized according to the median level in each group and then pooled to create a single variable (<median vs ⩾median).
Imputation of Missing Demographic, Health, and Lifestyle Data
Multiple imputation by chained equations (MICE; R version 4.3.0.) was performed on data from the entire BCGP cohort to impute missing self-reported demographic, health, and lifestyle data. Five iterations of MICE were completed with the imputed data from each of the iterations seeding the missing values for each subsequent iteration, converging on final imputed values for each of the variables. Age at diagnosis, biological sex, income, and education level were included in the predictor matrix. Given the limited number of CRC cases, we did not impute missing cancer stage data; there were no missing grade data.
Statistical Methods
We calculated descriptive statistics for the epithelium and non-epithelium H-score measures in tumor and normal tissues. The distributions of the H-scores were generally right-skewed (ie, standard deviation ⩾ mean), so the measures were ln-transformed for regression analyses.
Using R version 4.3.0, linear regression models were used to examine ln-transformed H-scores (dependent variables) in association with each dichotomized demographic, health history, and lifestyle factor (independent variables). Independent variables included: age at diagnosis (⩽64 years vs >64 years), biological sex, tumor stage (low vs high), tumor grade (low vs high), colorectal cancer screening history (never/ever), BMI (<25 kg/m2 vs ⩾25 kg/m2), household income (⩽$75,000/year vs >$75,000/year), education level (lower than a bachelor’s degree vs at least a bachelor’s degree), sleep duration (⩾7 hours/night vs <7 hours/night), fruit consumption (<2 servings/day vs ⩾2 servings/day), vegetable consumption (<3 servings/day vs ⩾3 servings/day), alcohol consumption (<once/week vs. ⩾once/week), smoking (ever/never smoked 100 cigarettes), and physical activity (<median vs ⩾median). Independent factors were dichotomized based on sample distribution to ensure adequate numbers in each category. Given the small number of non-White participants and participants reporting a positive family history of CRC, these 2 factors were not evaluated in association with SPARC expression. Instead, sensitivity analyses were conducted whereby non-White participants and participants reporting a positive family history of CRC were excluded to observe impacts on parameter estimates of interest.
β-Values and associated 95% confidence intervals (CI) from the regression models were exponentiated, generating estimates of the ratio of H-scores between the 2 categories of each independent factor. For any associations that were statistically significant (P ⩽ .05), we examined for potential confounding by the other demographic, health history, and lifestyle factors. Specifically, these factors were added to the models 1 at a time and retained if they altered the parameter estimates of interest by ⩾10%.
Results
Of the 16 demographic, lifestyle, and health history variables considered in the study (Table 1), 2% to 18% of the values were missing prior to imputation. The mean (standard deviation; SD) age of participants at cancer diagnosis was 62.9 (7.3) years. Most participants had BMIs of 25 kg/m2 or greater (69.4%) at time of recruitment. Most participants were White (93.9%), had lower grade tumors (87.8%), reported no family history of CRC (81.6%), and reported undergoing routine screening for CRC at least once (67.3%). In addition, most participants reported sleeping at least 7 hours per night (69.4%) and eating ⩽2 servings of fruit/day (69.4%).
Post-imputation demographic, lifestyle, and health history factor distributions among study participants (n = 49).

Medians differed based on type of physical activity assessment completed.
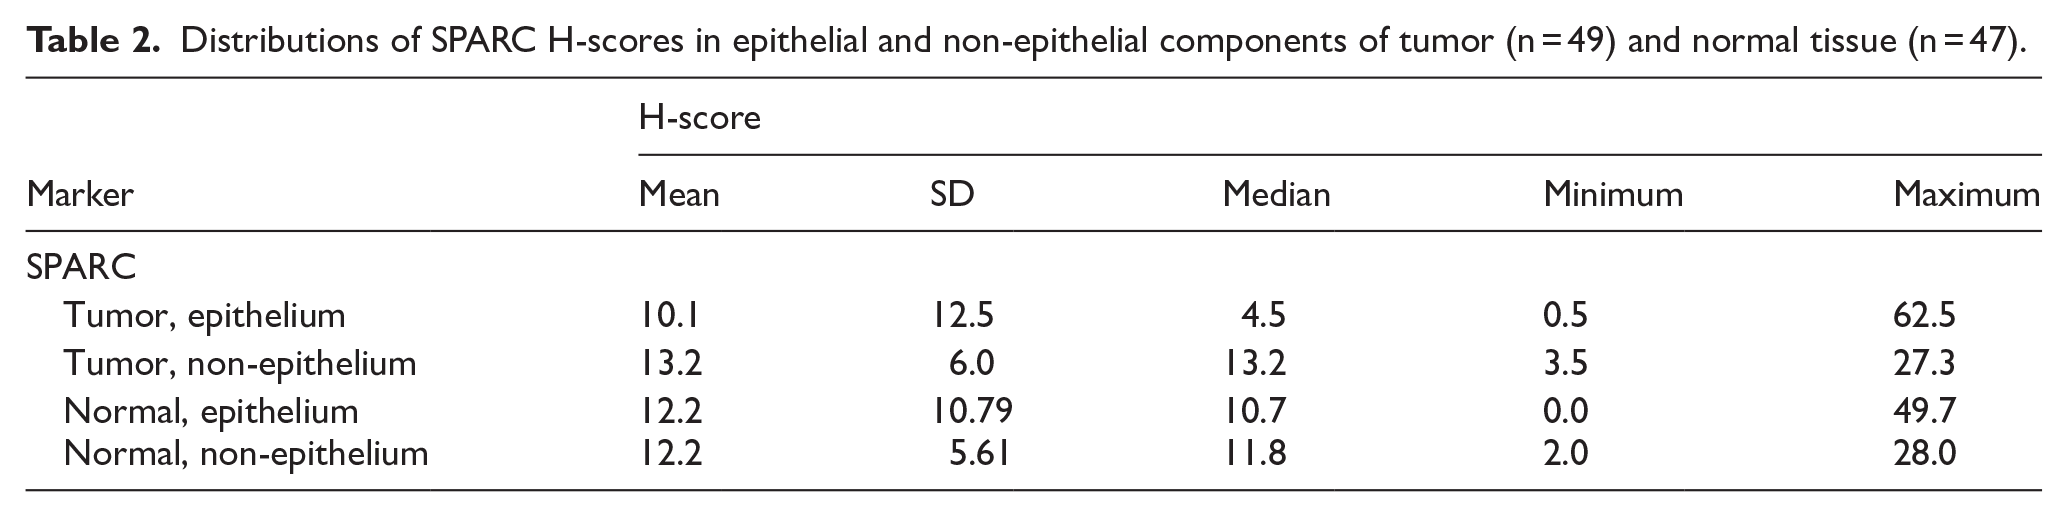
Distributions of SPARC H-scores before natural log transformation in tumor and normal tissues are summarized in Table 2. Median levels were generally similar between epithelial and non-epithelial tissues, except for SPARC in tumor tissue where levels were higher in non-epithelial as compared to epithelial tissue (13.2 vs 4.5).
Distributions of SPARC H-scores in epithelial and non-epithelial components of tumor (n = 49) and normal tissue (n = 47).
SPARC H-scores in the epithelial component of CRC tumors among smokers were 0.53 of the scores observed in non-smokers, and this association was statistically significant (Table 3; 95% CI: 0.28, 1.00; P = .054). Though not statistically significant, SPARC H-scores in the non-epithelial component of CRC tumors among smokers were 0.88 of those observed among non-smokers (95% CI: 0.67, 1.16; P = .381). Similarly, SPARC H-scores in the non-epithelial component of CRC normal tissue were 0.83 of those observed among non-smokers (95% CI: 0.61, 1.13; P = .238). A similar association was not observed in the epithelial component of normal tissue.
Associations of demographic, lifestyle, and health history factors with SPARC H-scores in tumor epithelial and non-epithelial tissues.

Includes 46 participants with non-missing data.
Medians differed based on type of physical activity assessment completed.
Among individuals with incomes greater than $74,999/year, SPARC H-scores in the non-epithelial component of CRC tumors were a statistically significant 1.33-fold greater than H-scores among those who earned $74 999/year or less (95% CI: 1.02, 1.73; P = .041). Similar effects were not observed in tumor epithelial tissue or normal tissues.
Among cases with higher stage tumors, SPARC H-scores in the non-epithelial component of their CRC tumors were 0.74 of the levels observed among cases with lower stage tumors, and this association was statistically significant (95% CI: 0.56, 0.98; P = .040). Though not statistically significant, a similar effect was observed in the epithelial component of tumors; SPARC H-scores among cases with higher stage tumors were 0.74 of those observed among cases with lower stage tumors (95% CI: 0.38, 1.43; P = .373). Similar effects were not observed among normal tissues.
In the epithelial component of normal colorectal tissues, higher fruit consumption was associated with a statistically significant 2.74-fold greater SPARC H-score (95% CI: 1.49, 5.06; P = .002). In the non-epithelial component of normal tissues, higher fruit consumption was associated with a non-statistically significant 1.22-fold greater SPARC H-score (Table 4; 95% CI: 0.88, 1.70; P = .246). Similar associations were not observed in tumor tissues. No evidence of confounding was observed with any of the statistically significant findings. Exclusion of individuals of non-White ethnicity and those with a family history of CRC did not have notable impacts on point estimates from any of the statistically significant findings (results not shown).
Associations of demographic, lifestyle, and health history factors with SPARC H-scores in normal epithelial and non-epithelial tissue.
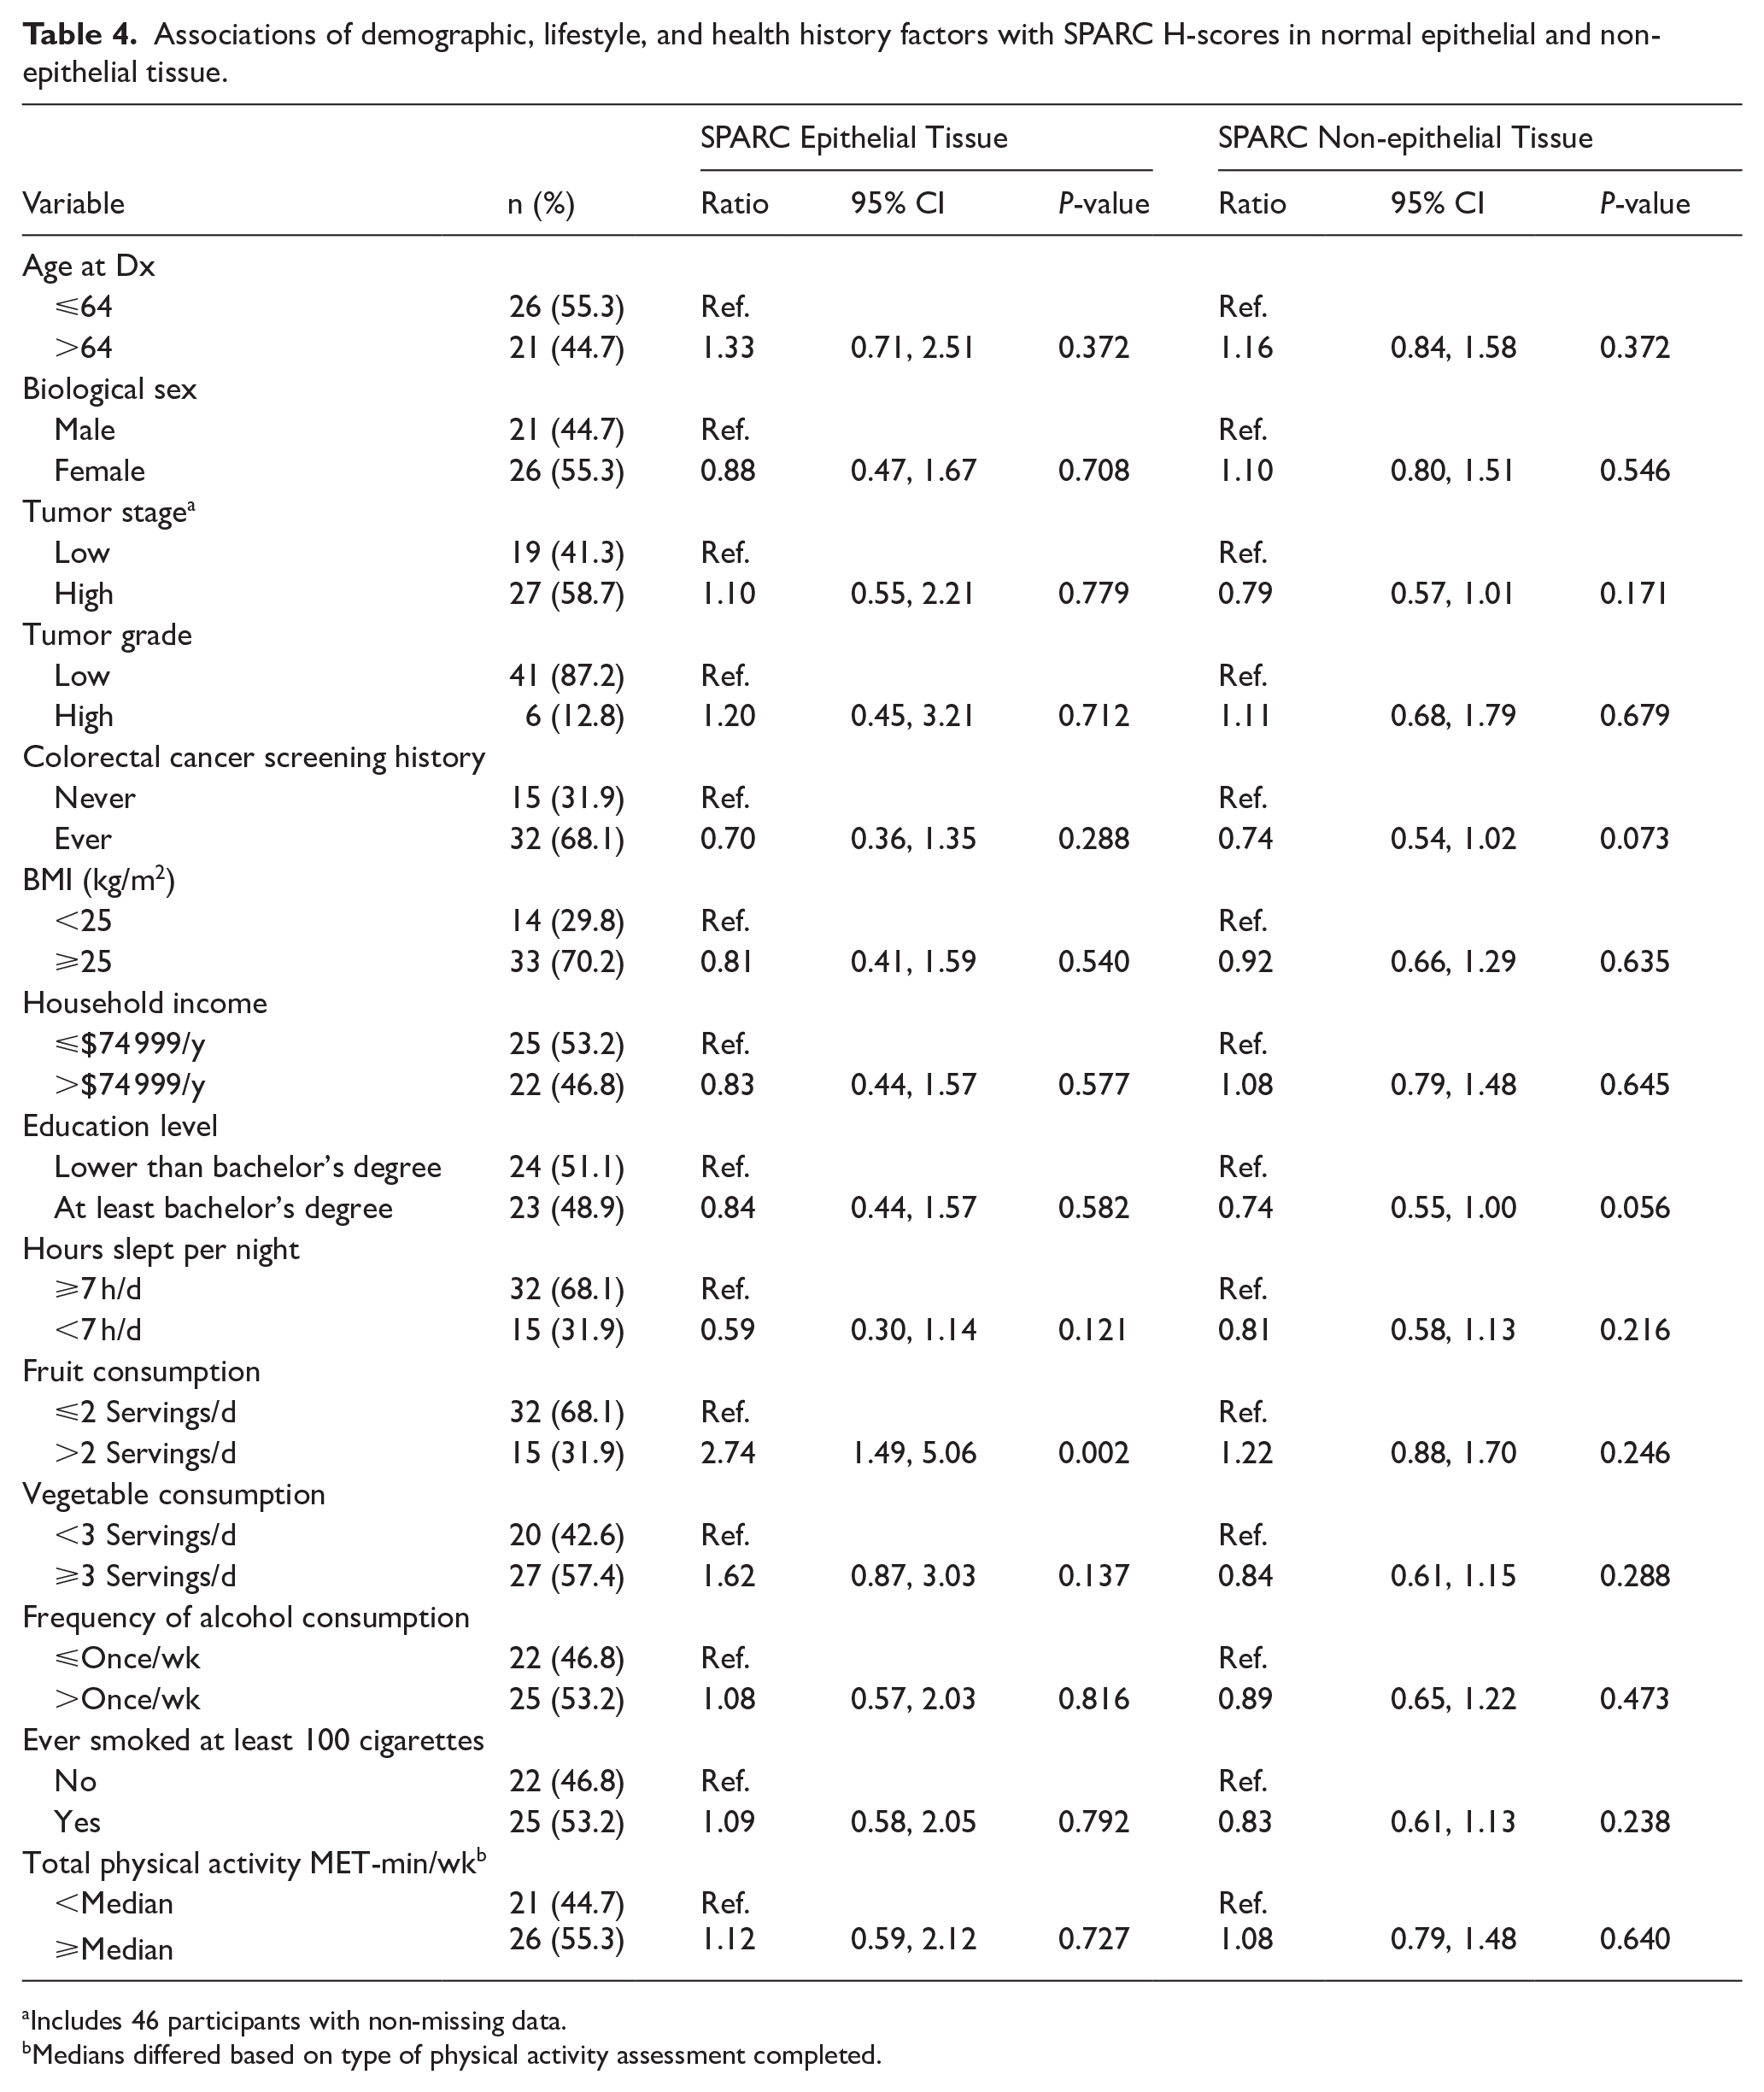
Includes 46 participants with non-missing data.
Medians differed based on type of physical activity assessment completed.
Discussion
We identified multiple factors that were statistically significantly associated with measures of SPARC expression in the epithelial and/or non-epithelial components of CRC tumor and normal tissues, including smoking, household income, tumor stage, and higher fruit consumption. SPARC has been observed as a tumor suppressor in multiple cancers, including CRCs 19 ; lower SPARC expressing tumors have been correlated with lower survival rates.10,11 This is attributed to various anti-tumor properties of SPARC, including impeding cell proliferation inhibition, anti-angiogenesis, pro-apoptosis, and cell cycle arrest. 20
Our finding of a reduced level of SPARC expression in CRC tumors among smokers as compared to non-smokers suggests that this is a possible mechanism by which smoking has been associated with poorer survival rates among CRC patients.21 -25 Though the association of SPARC H-score with smoking was only statistically significant in tumor epithelial tissue, the direction of effect in non-epithelial tumor tissue was generally consistent with what was observed in tumor epithelial tissue. The mechanism by which smoking would impact SPARC expression is unclear. Methylation of the promoter region of the SPARC gene has been shown to decrease SPARC expression levels, 26 and smoking has well-established impacts on DNA methylation patterns. 27 Our observation of increased SPARC expression in CRC tumors of those with higher household incomes is consistent with previously observed findings that lower socioeconomic status is associated with poorer CRC prognosis.28,29 It may be that household income acted as proxy for a lifestyle factor with impacts on SPARC expression. For example, red meat consumption, a factor not captured in our study, has previously been linked to lower levels of SPARC expression in colon tissue, 30 and higher income has been linked with lower levels of meat consumption. 31
We observed reduced SPARC expression in CRC tumors among those with higher stage cancers, which is consistent with the poorer prognosis of higher stage CRC cancers.1,2 In a study using colon adenocarcinoma and the corresponding non-diseased colon of 114 cases to investigate the prognostic significance of SPARC, no significant association between SPARC protein expression and the TNM staging was observed. 11 However, the study observed higher SPARC expression in mesenchymal and stromal cells of lower grade tumors. 11 No significant associations with grade were observed in our study.
Aerobic exercise has been shown to induce SPARC expression in previous studies.32 -34 Though not statistically significant, we observed elevated SPARC expression in association with physical activity in both tumor and normal epithelial and non-epithelial tissues. In normal tissue, we observed higher SPARC H-scores in association with increased fruit consumption. While previous studies have found fruit consumption to be associated with better CRC prognosis, 35 we did not observe a similar association between SPARC and fruit consumption in tumor tissues, suggesting that SPARC expression may not be a mechanism by which fruit consumption is associated with prognosis.
To our knowledge, our study is the first to investigate SPARC expression in CRC tissues in association with pre-diagnostically assessed demographic, health history, and lifestyle factors. A major strength of this study was the availability of detailed pre-diagnostic data on a variety of demographic, health history, and lifestyle factors. The other major strength was the availability of the BCGP pathology database, a unique resource among population-based cohorts in Canada that facilitated access to tumor pathology samples for the creation of TMAs.
Given the small number of cases, we were limited to dichotomizing the independent variables. A significant number of cases were excluded from the study (57%). Most cases were excluded due to unavailability of resection samples which is likely attributable to presence of advanced disease which precluded surgical resection. Since excluded cases were likely to be those with more advanced disease, our results may not be valid across all CRC cases. Very few non-White participants were included in the study, reflecting the fact that the majority of BCGP participants are of European descent. This limits the generalizability of our findings to non-European populations.
Conclusion
Our findings suggest that SPARC expression may underlie previously reported impacts of some demographic, health history, and lifestyle factors on CRC prognosis. Future larger scale studies with prognostic data should evaluate the mediating effects of SPARC and other compelling markers on disease prognosis.
Footnotes
Ethical Considerations
Ethics approval for this project was obtained through the BC Cancer/University of British Columbia Research Ethics Board (H21-02500).
Consent to Participate
Written informed consent for research and publication was obtained from all participants.
Author Contributions
Conceptualization, U.Z., J.P., I.T., S.Y., P.W., R.A.M., and P.B.; Methodology, U.Z., J.P., I.T., P.W., R.A.M., and P.B.; Formal Analysis, U.Z., J.P. and P.B.; Data Curation, U.Z., J.P., S.B., K.M., P.W., and P.B.; Writing—Original Draft Preparation, U.Z. and P.B.; Writing—Review and Editing, U.Z., J.P., I.T., S.Y., S.B., K.M., P.W., R.A.M., and P.B.; Supervision, P.B.; Funding Acquisition, P.B. All authors have read and agreed to the published version of the manuscript.
Funding
The author(s) disclosed receipt of the following financial support for the research, authorship, and/or publication of this article: The data and bio samples used in this research were made available by the BC Generations Project. This study was supported by the BC Cancer Tumor Tissue Repository, Victoria, BC, a member of the Canadian Tissue Repository Network.
Declaration of Conflicting Interests
The author(s) declared no potential conflicts of interest with respect to the research, authorship, and/or publication of this article.