
Abstract
Despite infection and sepsis being a major public health challenge, early detection and timely management are often hindered by several factors. These includes the similarity of clinical presentations between infectious and non-infectious conditisons, as well as limitations of current diagnostic methods such as lengthy turnaround times and low sensitivity. Consequently, there is increasing interest in identifying biomarkers that can quickly and accurately differentiate bacterial sepsis from other inflammatory processes, whether infectious or non-infectious. Procalcitonin has emerged as one of the most extensively studied and utilized biomarkers in managing infection and sepsis, especially within the framework of antibiotic stewardship. This review aims to examine the role of Procalcitonin in guiding antibiotic stewardship. It explores the production and release of procalcitonin and its relevance in the context of infection and sepsis. The discussion focus on the clinical and economic impacts of using procalcitonin to guide the initiation and discontinuation of antibiotics in managing these conditions.
Introduction
The gold standard for managing infection and sepsis is pathogen identification followed by targeted antibiotic treatment. However, this approach is often impractical due to the long turnaround times (1) and low sensitivity (2) of microbial cultures. 1 Consequently, the current guidelines recommend the immediate administration of broad-spectrum antimicrobials, 2 before identifying the causative agent. This practice can lead to inappropriate antimicrobial use and increased risk of resistance development, 3 potential opportunistic infections, 4 and a significant economic burden. 5
Given these ongoing challenges, there has been a substantial focus in research on identifying alternative biomarkers that can accurately and rapidly differentiate bacterial sepsis from other infectious and non-infectious inflammatory conditions. 6 These biomarkers can be broadly classified into pathogen-specific and host-response biomarkers. Pathogen-specific biomarkers, which are often antigens of specific pathogens, are detected using techniques such as enzyme immunoassay, fluorescence immunoassay or immunochromatographic methods, each with varying degrees of sensitivity and specificity. 7
Host-response biomarkers are typically associated with the body’s initial immune response to infection and have shown both prognostic and diagnostic value. 8 An ideal biomarker should possess the ability to accurately diagnose conditions, predict disease outcomes, and effectively guide antibiotic therapy.9,10 Procalcitonin (PCT) is one of the most widely studied and utilized biomarker in the management of infection and sepsis. 9 Several randomized controlled trials and meta-analyses have extensively evaluated PCT in the context of antibiotic stewardship.11-13 While the majority of these studies highlight the importance of PCT in guiding antibiotic use, a few have not found sufficient evidence to support its efficacy. This review aims to explore the opportunities and challenges associated with the use of PCT in guiding antibiotic therapy. It will mainly cover the clinical and economic impact of PCT-guided antibiotic stewardship. Additionally, a preliminary overview will be provided on PCT production, kinetics, analysis, and related interferences.
Procalcitonin
Procalcitonin is a 116 amino acid protein with a MW of 14.5 kDa and serve as a precursor to the hormone calcitonin (CT), which plays a role in calcium homeostasis.14,15 It is encoded by the CALC-1 gene located on the short arm of chromosome 11. Pre-procalcitonin (pre-PCT) undergoes a series of proteolytic cleavage to form PCT, which subsequently processed into calcitonin. The expression of CALC-1 gene is typically restricted to neuroendocrine cells, primarily the C cells of the thyroid gland. 16 In healthy individuals, PCT production is tissue-specific and undergoes post-translational processing to produce small peptides and mature CT. 14 Elevated calcium levels and other stimuli, such as glucocorticoids, glucagon, gastrin or β-adrenergic stimulation activate thyroid C-cells to produce CT, whereas, somatostatin and vitamin D inhibit its production. 17
Almost all of the PCT produced in the thyroid C-cells is converted to CT, resulting in PCT levels in healthy individuals being below the detectable limits (18). If PCT does enter the circulation, it has a half-life of 25 to 30 hours, after which it is cleared, as there is no enzyme specifically responsible for breaking down the circulating PCT. 17
Under normal physiological conditions, PCT is formed in the thyroid C-cells and converted to CT, which helps regulate calcium homeostasis. However, during microbial infection and inflammation, non-neuroendocrine tissues including, adipocytes, liver, kidney, and lungs, also contribute to PCT synthesis. 18 In inflammatory states, not only does the thyroid produce PCT at levels exceeding the capacity of converting enzymes, but additional production from various tissues can increase PCT concentration by 100 to 1000-fold.
During bacterial infection, PCT production increases in response to the release of microbial components like lipopolysaccharides or other toxic metabolites, as well inflammatory cytokines such as interleukin 1β (IL-1β), IL-6 and tumor necrosis factor alpha (TNF-α). 19 This phenomenon was demonstrated in primates injected with lipopolysaccharide, where PCT mRNA was expressed in various cell types, resulting in elevated PCT levels since most cells could not convert PCT to calcitonin. 20 Elevated PCT concentration during severe bacterial infection in patients who had undergone total thyroidectomy further suggested that PCT is secreted by various extrathyroidal tissues throughout the body. 21 Conversely, cytokines produced during viral infections, such as interferon gamma (IFN-γ), suppresses CALC-1 gene expression, leading to low PCT production. 9 This characteristic makes PCT particularly useful for differentiating between viral and bacterial infections (Figure 1).
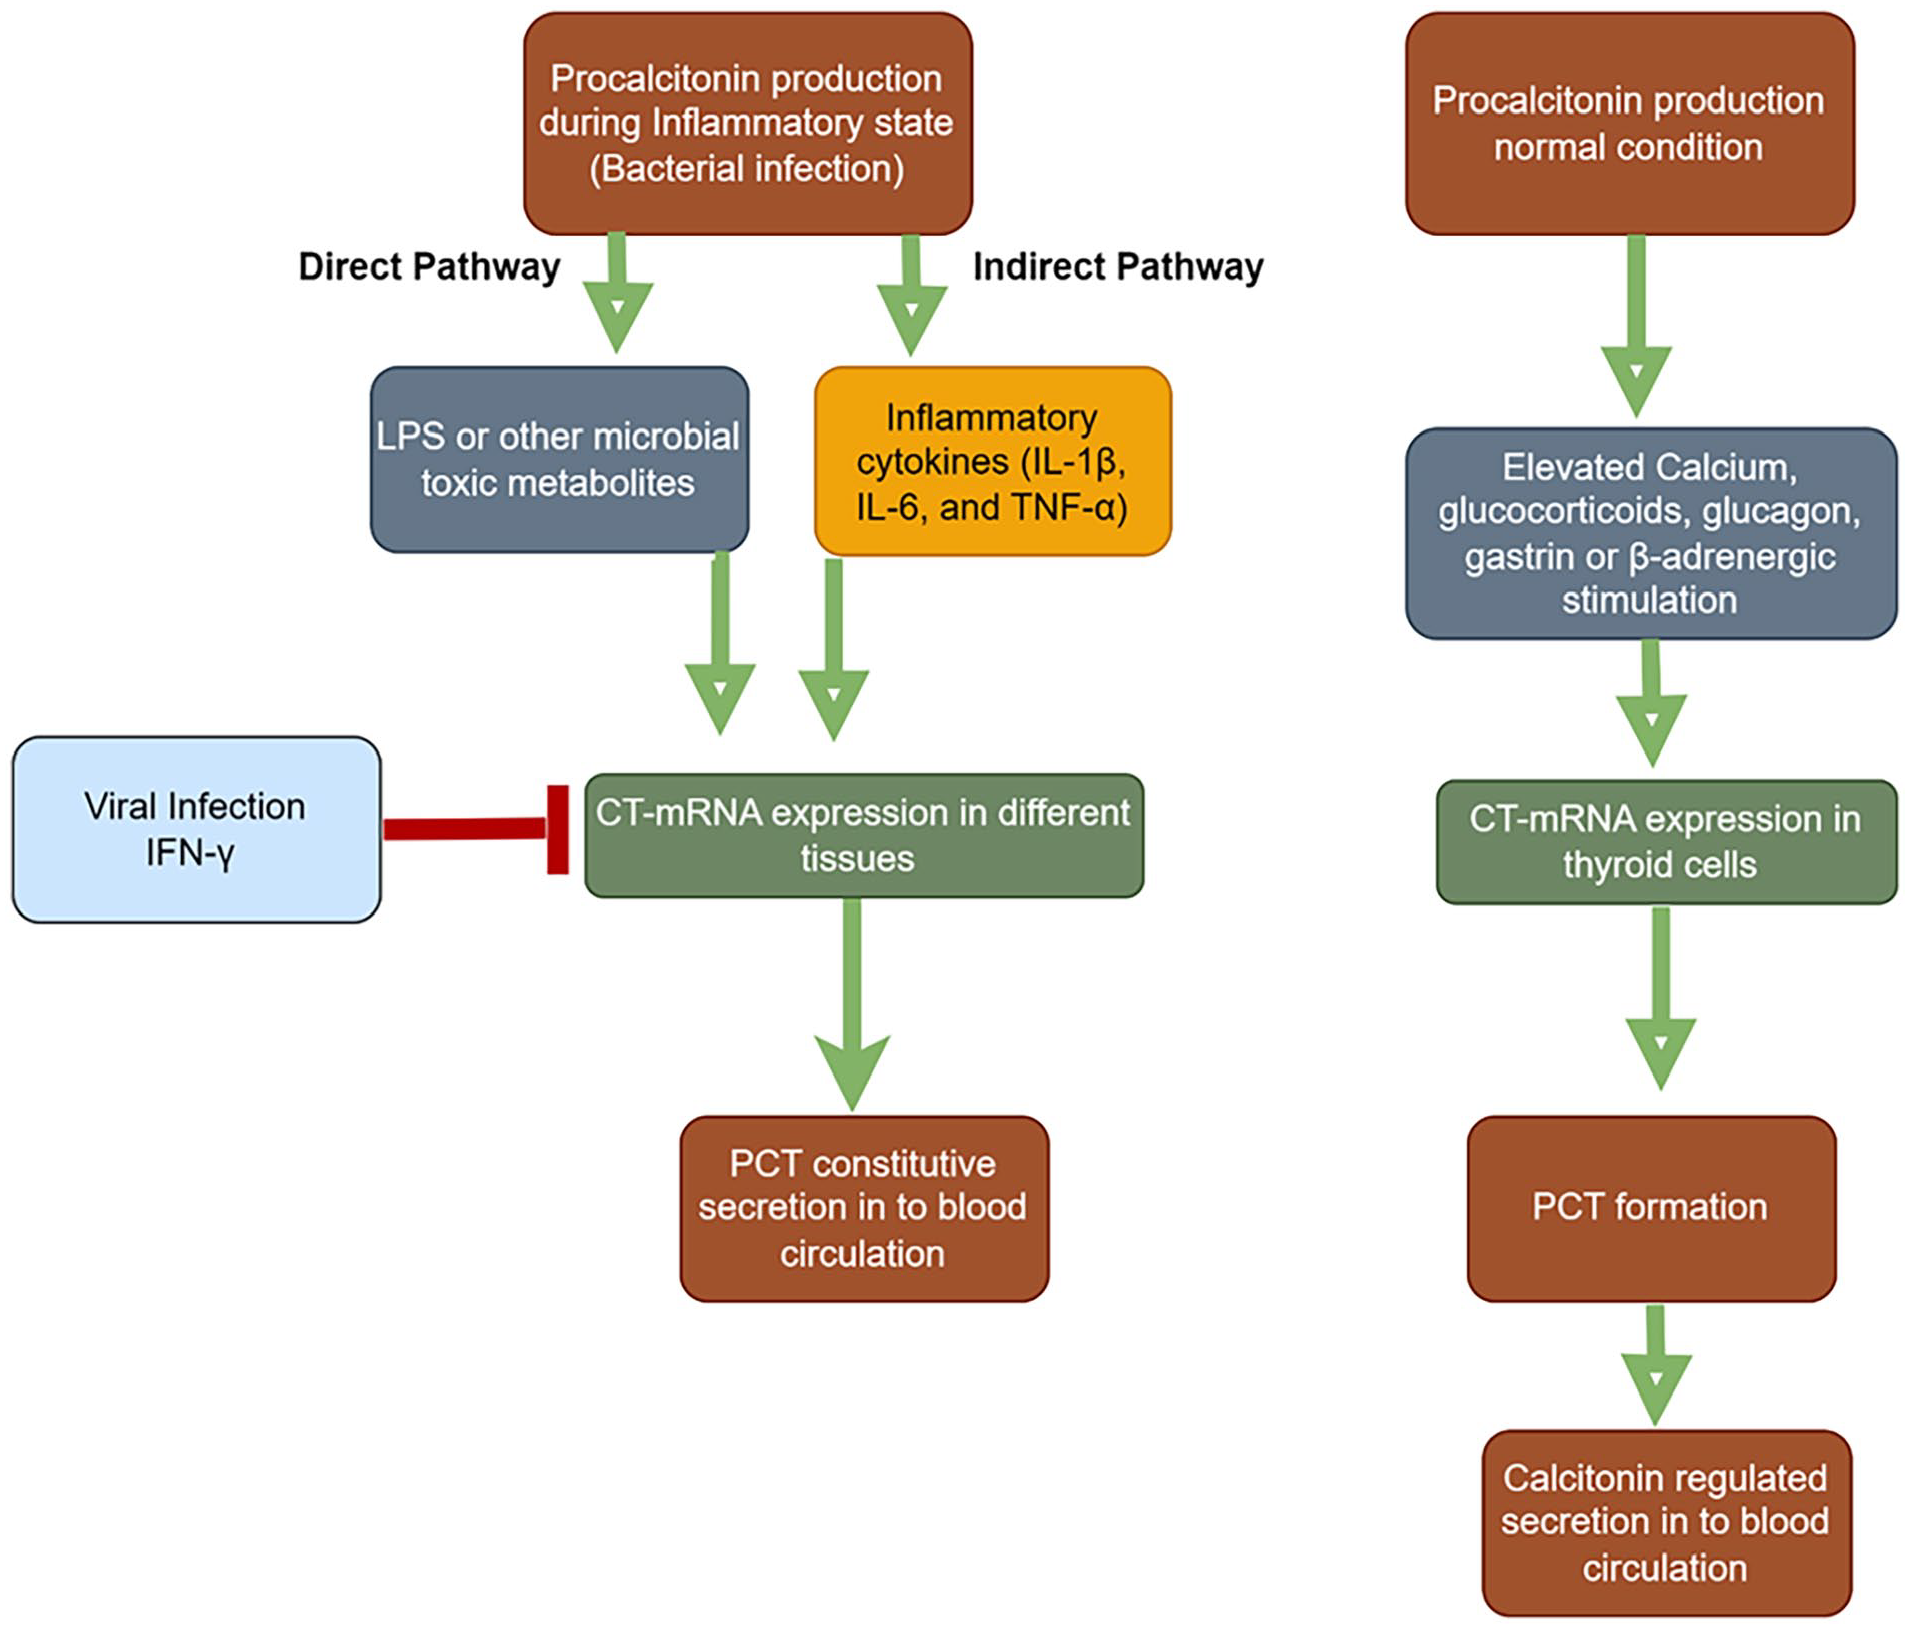
Procalcitonin Production During Inflammation. The figure shows increased procalcitonin (PCT) synthesis in response to bacterial infections due to cytokines (IL-1β, IL-6, TNF-α) and lipopolysaccharide (LPS). Viral infections trigger interferon gamma (IFN-γ), which suppresses PCT production. CT-mRNA: Calcitonin messenger RNA; LPS: lipopolysaccharide; IFN- γ: Interferon gamma; IL-1β: Interleukin 1 beta; IL-6: Interleukin 6; TNF- α: Tumor necrosis factor alpha.
Procalcitonin kinetics
Procalcitonin (PCT) exhibits a kinetic profile that is highly useful for monitoring patients’ status and guiding antibiotic therapy. PCT levels become detectable within 2 to 4 hours of infection, rising typically within 6 to 12 hours and peaking around 24 hours. 22 This rapid increase allows clinicians to assess the severity of the infection. Conversely, PCT level quickly decline when the infection is controlled.14,15 PCT levels correlate with interleukin -6 (IL-6) and tumor necrosis factor alpha (TNF-α), which are key cytokines involved in the inflammatory response to infection. 23 A significant decrease in PCT levels overtime suggests a positive response to therapy, providing valuable insights into the effectiveness of the chosen antibiotic regimen. The trajectory of PCT plasma concentration has become an important focus in the diagnosis and monitoring of infectious diseases.
Due to the sustained expression of PCT during infection and its decline during recovery, monitoring PCT kinetics over time offers significant prognostic value. 15 Several studies demonstrated that PCT non-clearance over time was a good predictor of 28/30-day mortality,24-27 whereby PCT clearance was defined as a decrease in PCT level by 25% or more in 48 hours to 7 days.
It should be noted that other inflammatory processes can cause transient increase in PCT levels though this increases are generally lower compared to those seen in bacterial infection (28). The rapid rise in PCT levels, peaking 6 hours after endotoxin injection and remaining elevated for 25-30 hours, makes PCT a promising biomarker to differentiating bacterial infection from non-bacterial ones, often even before microbiological culture results are available. 28
Different cut-off values for PCT are used depending on the clinical condition and the purpose of the measurement. Schuetz et al. 29 reviewed the evidence for PCT cut-offs across various infections and clinical settings. For patients with low acuity, such as those typically presenting to the emergency department (ED) without sign of severe infection or sepsis, a single PCT measurement with a cut-off between less than 0.10 to less than 0.25 ng/ml is likely indicative of non-bacterial infections, such as bronchitis or viral-induced exacerbation of Chronic Obstructive Pulmonary Disease (COPD). For patients transferred to ICU due to severe illness, initial empiric antibiotic therapy is recommended for all suspected sepsis cases. In such settings, the PCT algorithm primarily guides discontinuation of antibiotics during follow-up, with daily PCT measurements. Antibiotic discontinuation is advised when PCT levels decreases by >80% from the peak value or fall below an absolute value of 0.5 ng/ml, while closely monitoring the patient’s clinical status. Treatment failure is indicated if PCT levels remain elevated.
These cut-off values may not be applicable to individuals with kidney disease, as renal function significantly influences plasma PCT levels. Several studies suggest using higher thresholds for patients with impaired kidney function.30-33 While the exact elimination route of PCT is not fully understood, its low molecular weight of 14 kDa, suggests that renal function could affect PCT levels. 31 Additionally, renal impairment might indirectly elevate PCT levels by increasing serum concentrations of proinflammatory metabolites, which activate the immune system, leading to heightened inflammation and increased PCT release into circulation. 34 For instance, Wu et al. reported a higher PCT levels in chronic kidney disease (CKD) patients(0.44 ± 0.67 ng/mL) compared to healthy controls (0.04 ± 0.06 ng/mL), with patients in stage 5 CKD showing a significantly elevated PCT level (0.50 ± 0.73 ng/mL). 30 Similarly, El-sayed et al. suggested that a single threshold is unreliable for predicting bacterial infection in patients with renal impairment, proposing a threshold of 3.2 ng/mL above which bacterial infection is highly likely, and below 0.5 ng/mL, infection is unlikely. 33 However, Meisner et al, observed only a moderate and clinically insignificant prolongation of PCT clearance in patients with severely impaired renal function compared to those with normal renal function.35,36 This suggests that renal secretion plays a minor role in PCT elimination, and the slightly increased clearance time might be due to persistent inflammation in patients with severe renal impairment.
Host factors
The impact of host immune status on PCT levels has received significant research attention. Earlier studies suggested that PCT’s utility in severely leukopenic patients (WBC < 1 × 10⁹/L) was inadequate, 37 promoting a need for new PCT cut-offs for immunocompromised patients. 38 This was based on concerns that leukocytes might be a primary source of PCT production during infection. However, recent findings do not support reduced PCT levels in immunosuppressed individuals. Unlike markers like white blood cells (WBCs), PCT levels are generally not affected by immunocompromising conditions or leukopenia-inducing medications, as PCT is secreted not only by leukocytes but also by various tissues throughout the body. 39 PCT response is not suppressed by immunosuppressive medications; in fact increased concentration have been reported in immunosuppressed patients with confirmed infection compared to non-immunosuppressed patients with infections. 40 A meta-analysis by Wu et al. showed that PCT has higher diagnostic value than other biomarkers, such as CRP and IL-6, for detecting bacterial infection in patients with febrile neutropenia. 41 Similar to other populations, PCT levels are effective in ruling out bacterial infection in immunosuppressed patients 42 and solid organ transplant recipients. 43
Using PCT level as a marker of bacterial infection in the first days of life presents several challenges. For instance, infants with conditions such as respiratory distress syndrome, hemodynamic failure, perinatal asphyxia, intracranial hemorrhage, pneumothorax, or those undergoing resuscitation can exhibit elevated serum PCT levels similar to those seen in septic neonates within the first 48 hours of clinical signs of distress or infection. 44 Additionally, in healthy neonates, PCT levels typically rise before term or at term and peak within 18-30 hours after birth, returning to normal levels by 42-48 hours. 45 Gestational age (GA) significantly affects PCT levels, with preterm neonates showing higher and more prolonged elevations compared to term neonates. This variation necessitates the use of reference PCT values tailored to GA and days of life for diagnosing early onset sepsis (EOS). 46 Altunhan et al, reported an increased PCT level at 24 hours of life compared to levels at birth, proposing a cut-off values of 0.59 ng/ml at birth and 5.38 ng/ml at 24 hours. 47 However, notable differences exist between healthy and septic neonate: septic neonates exhibit much higher increase in PCT levels, and failure to decrease after an initial rise suggests persistent bacterial infection. 48 For late-onset sepsis (LOS), physiological variation do not interfere, making PCT level a reliable indicator of the neonate’s condition. 49 The Adult reference ranges can be applied to newborns after three days of birth. 50
Procalcitonin analysis
Procalcitonin can be reliably analyzed using serum or plasma samples collected in EDTA or heparin anticoagulants. 51 Whole blood samples also provide consistent results, making them suitable for procalcitonin measurement.52,53 For accurate PCT analysis, serum or plasma samples should be separated and analyzed within 4 hours of blood collection. They can be stored at 2-80C for upto 24 hours; for longer, storage, samples should be refrigerated at −200C within 48 hours. A single freeze-thaw cycle may reduce PCT recovery of up to 8%. Prior to analysis, all samples should be centrifugated to remove fibrin or other particulate matter. 54
Numerous commercially available platforms for PCT assays differ in technical characteristics such as sensitivity, processing time, and detection limit. 55 The original manual PCT assay, the B·R·A·H·M·S PCT LIA (formerly the LUMItest PCT), was a one-step immunoluminescence assay with limited sensitivity, capable of detecting only markedly elevated PCT levels with a functional assay sensitivity of 0.3 ng/ml and lower detection limit (0.1 ng/ml). 56 This assay has been replaced by more sensitive automated immunoassay methods, such as the B·R·A·H·M·S PCT sensitive Kryptor® assay. Although there is no reference method for PCT detection, the B·R·A·H·M·S PCT sensitive Kryptor® assay is often considered as a gold standard, as it was among the earliest methods used in clinical trials that established PCT cut-offs for antibiotic stewardship decisions. 15
The assay uses polyclonal antibodies against calcitonin (CP) and monoclonal antibodies against katacalcin (CCP-I) domains of PCT. When PCT is present in the sample, it forms an immunocomplex by being sandwiched between these antibodies. 57 This method is highly sensitive, with lower detection limit of 0.02 ng/ml and a functional assay sensitivity of 0.06 ng/ml. 55 B·R·A·H·M·S licensed reagents containing the B·R·A·H·M·S PCT antibody have been incorporated into various automated platforms, including ADVIA Centaur (Siemens Healthcare), ARCHITECT (Abbott), Cobas ELECSYS (Roche Diagnostics), VIDAS (Biomerieux), and LIAISON (DiaSorin), among others.
The Diazyme PCT assay utilizes a latex-enhanced immunoturbidimetric method in which PCT binds to specific anti-PCT antibodies coated on latex particles, resulting in agglutination. The resulting turbidity is measured at 600 nm, and its intensity is directly proportional to the concentration of PCT in the sample. The final PCT concentration is calculated by interpolating the optical signal against a 6-point calibration curve. 58 The Diazyme PCT reagent system is also compatible with several automated instruments, including ADVIA 2400, ARCHITECT c16000, Roche cobas c 501, and Roche cobas c 702, among others. A detailed comparison of PCT assays, including performance evaluations against the B•R•A•H•M•S PCT sensitive Kryptor® and comparability across different platforms, is available in other sources. 15
Interfering factors
Several clinical conditions and factors can influence PCT results. Falsely elevated PCT results may occur in situations like severe trauma or burns, major surgery, cardiogenic shock, and treatments including cytokine-stimulating agents. 59 PCT levels typically rise rapidly, peaking at 24 hours post-trauma, and decline quickly in non-complicated patients cases. 59 A persistent rise, 60 a biphasic increase after 1 week, 61 or a significantly higher rise compared to non-infectious systemic inflammatory response syndrome (SIRS) 60 is associated with development of sepsis. Therefore, repeated measurements rather than a single value, are recommended for optimal clinical decision-making.
PCT levels elevate within 24 hours in patients with burn injuries, independent of infection, due to the immediate inflammatory response, and typically return back to normal by the third day. However, in the presence of sepsis, PCT value continues to rise rapidly, reaching values greater than 5-100 ng/mL.62,63 A similar PCT kinetic pattern is observed in patients undergoing abdominal surgery.64,65 While there is a slight increase in PCT levels 1 day post-operation, these levels continue to rise in patients with postoperative infectious complications.
False negative PCT results may occur in localized infections such as osteomyelitis, abscess, subacute endocarditis; or when PCT is measured too early in disease course. 22 This highlights that a low or normal PCT does not always preclude the presence of bacterial infections.
Antibiotic guidance using PCT
Procalcitonin is one of the most extensively studied biomarkers in the context of antibiotic stewardship for patients with infections. Numerous randomized controlled trials and meta-analyses have assessed the effectiveness of PCT in guiding the initiation and de-escalation of antibiotics using specific cut-off points. These studies typically compared PCT-guided antibiotic initiation and discontinuation with the standard of care (SOC) practices, which rely on the physician discretion or established national and international guidelines. The clinical and economic impacts of using PCT to guide antibiotic initiation and cessation are discussed in the following sections.
Procalcitonin guided initiation of antibiotics
Procalcitonin is well studied for its utility in helping clinicians decide when to start antibiotics and determine the appropriate duration of treatment. One of the key challenges in clinical practices is accurately distinguishing between the need for prompt antibiotic initiation and avoiding unnecessary antibiotic use when infection is not present. A reliable biomarker that guides these decisions is therefore of high importance. While most clinical studies have concentrated on evaluating the role of PCT-guided strategies for discontinuing antibiotics, some studies, as discussed in the proceeding paragraphs, have explored the effectiveness of using PCT for guiding the initiation antibiotic therapy.
In a randomized controlled trial conducted across 5 ICUs with509 adult participants, patients were randomized to receive either a PCT-guided approach or SOC approach for antibiotic management. In the PCT group, antibiotics were not initiated for patients with PCT levels< 0.25 ng/ml, while antibiotics were started for those with PCT levels> 1 ng/ml. 66 In the control group, physicians were blinded to PCT results. This study found no significant difference between the PCT and control groups regarding the initiation of antibiotics. Notably, 46% of patients with suspected sepsis in the PCT group were not eligible for antibiotic treatment due to PCT level below <0.25 ng/ml, compared to 32.7% in the control group. However, antibiotics were still administered to 43 patients in the PCT group with PCT level <0.25 ng/ml, most of whom had lower respiratory tract infection. As a result, the overall antibiotic consumption between the two groups was not significantly different as assumed. This outcome could be attributed to nearly half of the participants in the PCT arm having PCT levels >1 ng/ml, making them eligible for antibiotics. The study concluded that relying solely on PCT levels for antibiotic initiation was not particularly helpful. However, there was notable significant reduction in antibiotic consumption when clinicians considered the patient’s PCT levels alongside the clinical context of possible infection.
The Procalcitonin and Survival Study (PASS), a randomized controlled trial conducted in nine university hospitals in Denmark from 2006 to 2009, involved 1200 critically ill adult patients. Its objective was to assess whether procalcitonin-guided antimicrobial escalation reduces the time to appropriate therapy. 67 In the SOC group, antimicrobial treatment was guided based on the existing guidelines while in the PCT group antimicrobial intervention was further guided by the daily PCT measurement classified as “alert PCT” (>1.0 ng/mL and not decreasing by at least 10% from the previous day) and “non-alert PCT” (SOC only guided diagnostics and antimicrobial therapy plus de-escalation of antimicrobial therapy when PCT <1.0 ng/ml for at least 3 days). In this study, broad spectrum antimicrobial therapy consumption was higher in the PCT group as compared to the SOC and the median length of antibiotic course in the ICU was 2 days longer [PCT median 6 days (interquartile range [IQR] 3–11)] vs SOC of 4 days (IQR 3-10). While the 28-day mortality was comparable between the two groups, time spent on mechanical ventilation and length of stay in the ICU is longer among PCT group as compared to the SOC group. Therefore, the authors concluded that escalation of broad-spectrum antimicrobials using PCT level guidance led to increased consumption of antimicrobials, raising concern on resistance and toxicity, and did not reduced mortality. Moreover, the study reported the significant increase in cost of using PCT guided approach. This is mainly due to the repeated analysis of PCT itself, use of additional broad-spectrum antibiotics, additional requirement of culture, more days on mechanical ventilation, and longer stay in the ICU.
Similar results were reported in different meta-analyses that determined the role of PCT in antibiotic guidance. A meta-analysis by Peng et al., that included 16 RCTs and enrolled 6452 critically ill patients, showed that PCT-guided initiation of antibiotic therapy reduced neither the short-term mortality nor the length of stay of critically ill sepsis patients. 68 Similarly, the efficacy of PCT-guided initiation of antibiotic therapy could not be verified by a meta-analysis by Huang et al. 69 A meta-analysis by Prkno et al. that focused on both escalation and discontinuation of antibiotics based on PCT level, showed that there was no significant difference between PCT-guided approach and SOC approach with respect to 28-day mortality, and length of stay in the ICU and in-hospital stay. 70
Procalcitonin guided cessation of antibiotics
Antimicrobial resistance is a rapidly growing public health concern particularly in the ICUs due to the weight of broad-spectrum antimicrobial use. One of the risk factors is prolonged duration of antimicrobial treatment. 71 PCT is a biomarker that has been well studied for its utility to discontinue antimicrobial therapy and hence yielded a shorter duration of therapy as compared to the SOC. Several RCTs showed the importance of PCT to discontinue antibiotic treatment at a given cut off (usually PCT<0.5 ng/ml) or a relative decrease in PCT by a given percentage (usually 80% or more) from peak value.
Antibiotic cessation in sepsis patients
We reviewed 15 clinical studies that recruited sepsis, severe sepsis, or septic shock patients,72,73-85 of which two studies75,81 involved neonates born after 34 weeks of GA suspected to have EOS (Table 1). Overall, the studies involved 3143 patients in the PCT group and 3144 in the control group, and half of them were multicenter studies. There was variability in the frequency of PCT measurement whereby some of them measured PCT daily starting from day of enrollment,77,78,82,84 while others measured every other day74,80,86 or every 2 or 3 days.72,73,76,79,81 Moreover, absolute cut-offs of PCT to discontinue antibiotic therapy varied across studies. The thresholds were 0.25 ng/ml,78,85 0.5 ng/ml,72–74,77,79,80,83 or 1.0 ng/ml.76,83,84 The cut-off points used for studies that involved neonates were multiple depending on the hour of measurement after birth (Supplemental Figure 1). 75 Alternative to the cut-off points, most studies used an approach to discontinue antibiotic therapy based on relative decrease of PCT from the baseline or peak value. A decrease by ⩾80%-90% of the baseline or peak value was the most common approach across the studies, while a couple of studies used a decrease by ⩾50%, 76 and by ⩾25%-30%.83,84
Characteristics of 15 clinical studies involving Sepsis patients.
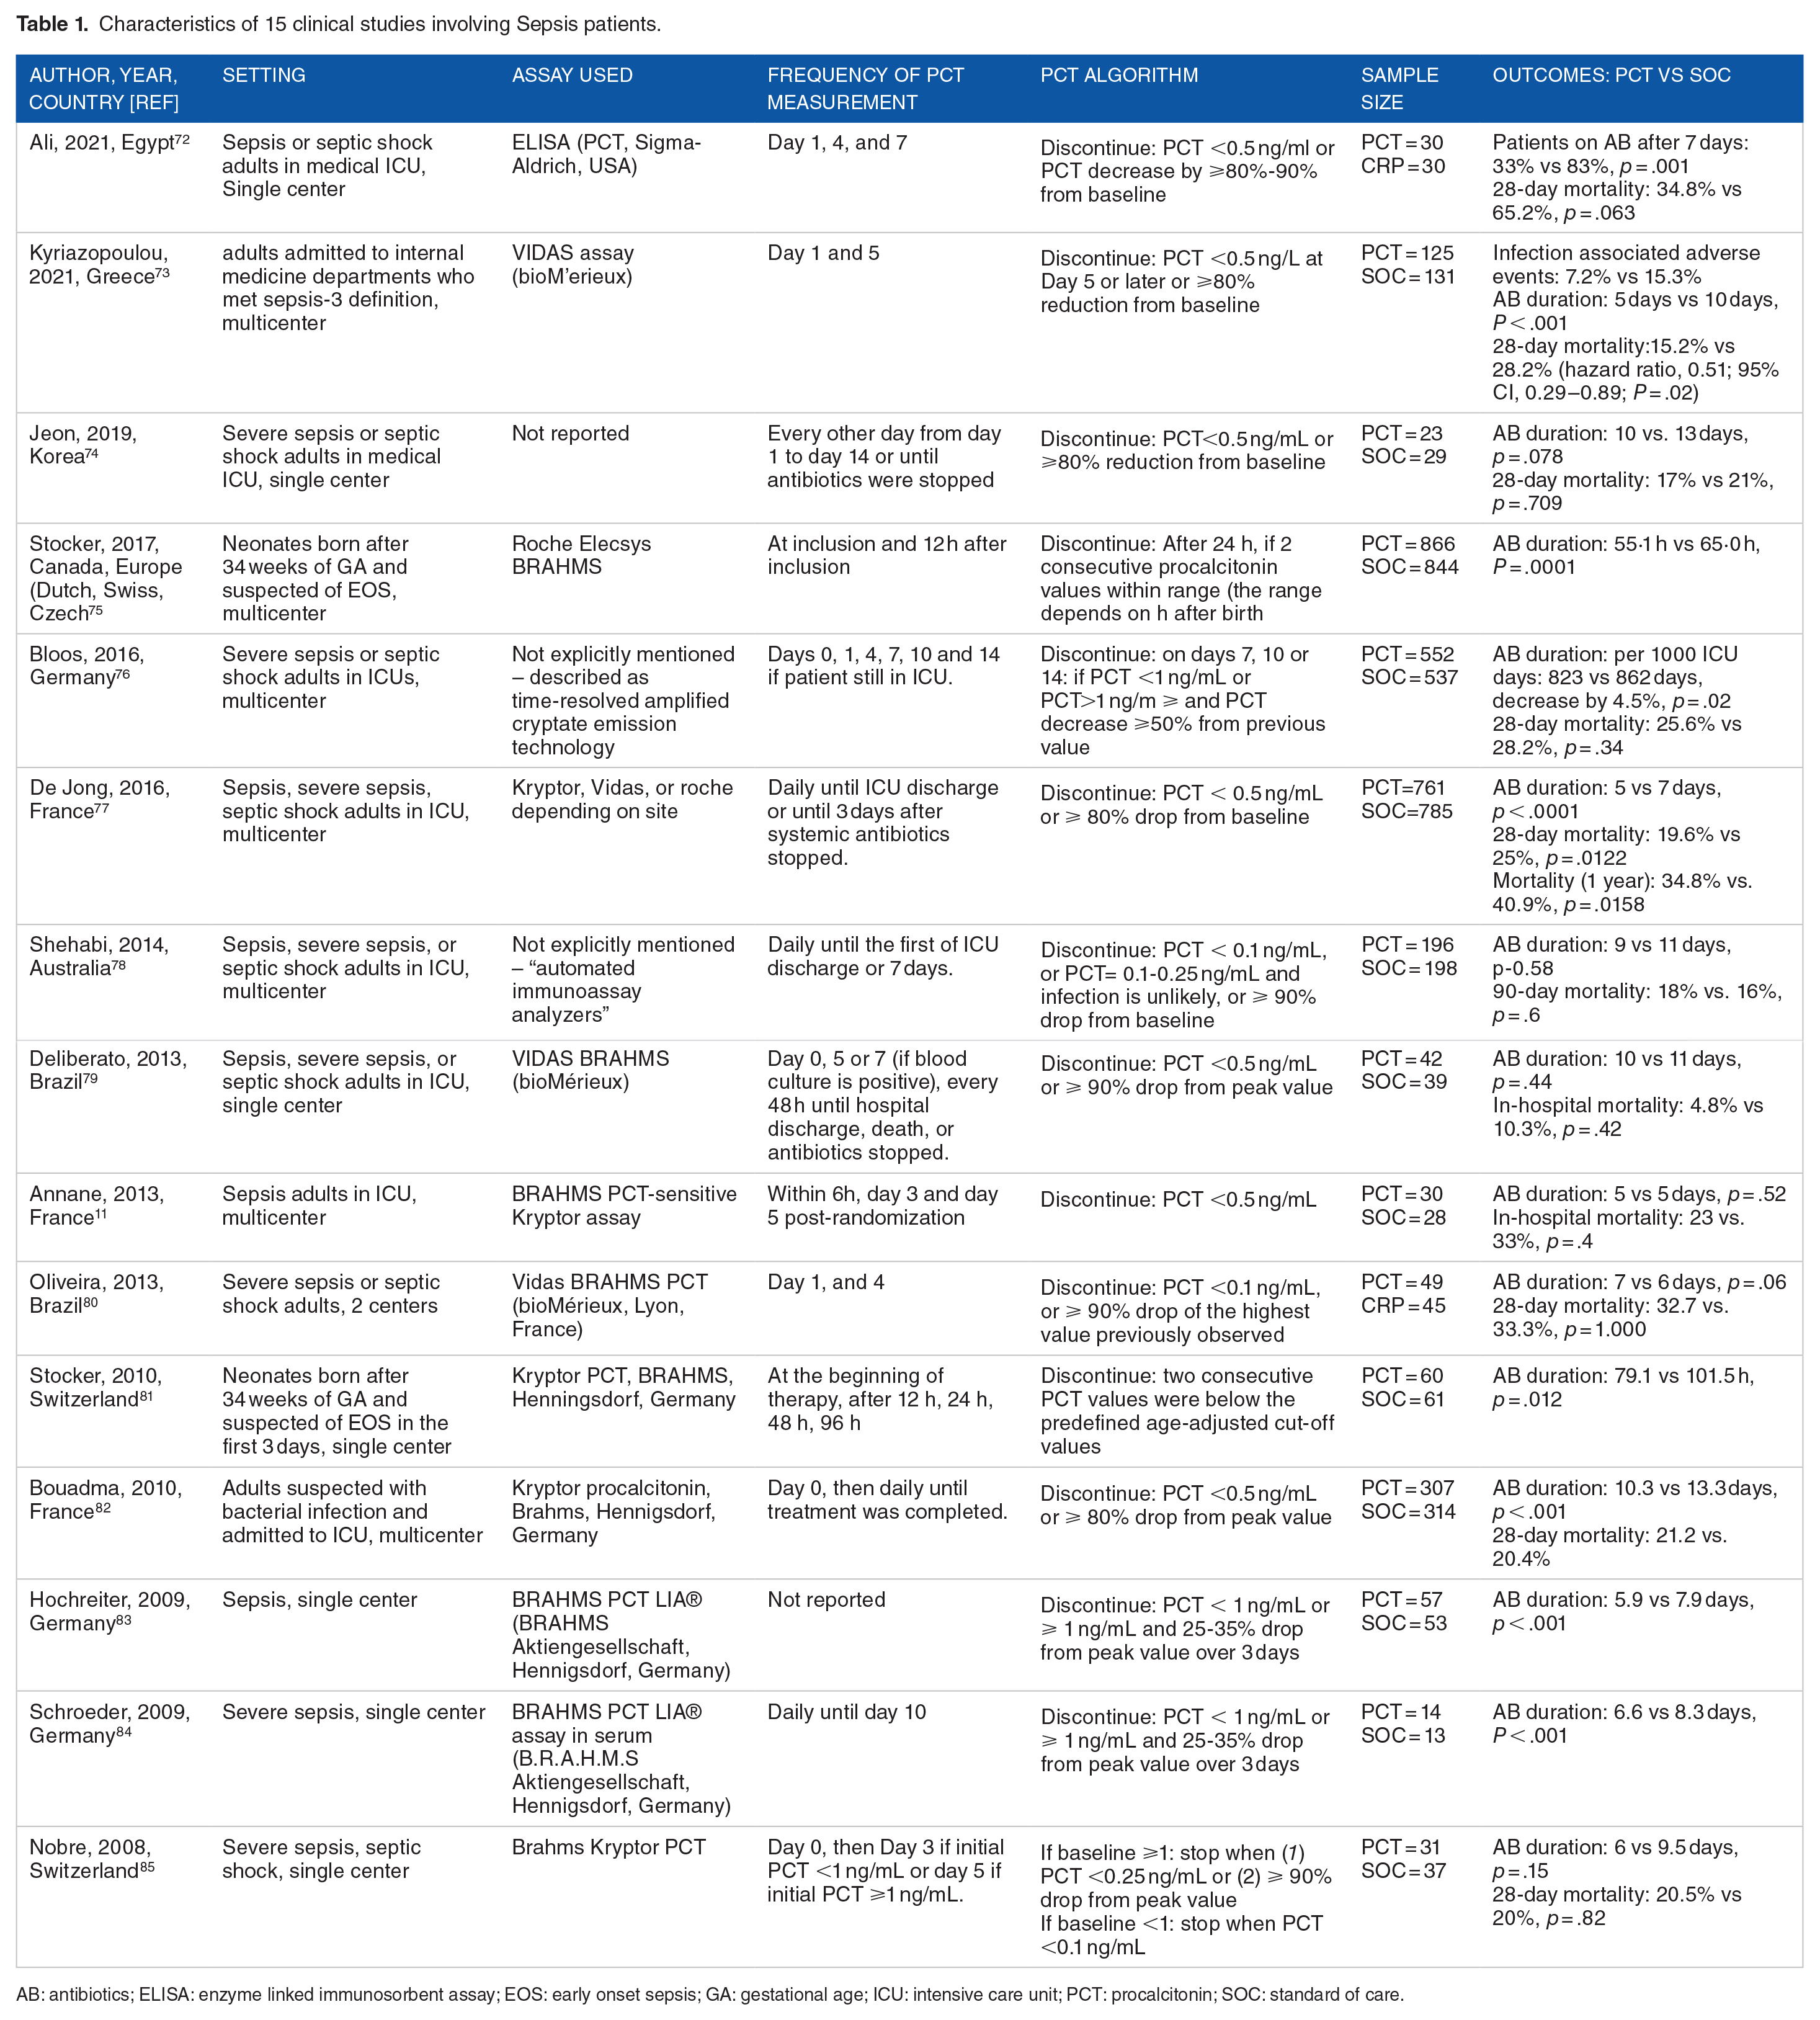
AB: antibiotics; ELISA: enzyme linked immunosorbent assay; EOS: early onset sepsis; GA: gestational age; ICU: intensive care unit; PCT: procalcitonin; SOC: standard of care.
Most studies reported reduction in duration of antibiotics in PCT groups compared to the SOC groups, the reduction ranging from 1 day to 5 days. One study 11 reported similar days of antibiotic exposure in both groups, while 3 studies78,79,80 showed lack of statistically significant difference in antibiotic duration between the two groups. Eight studies reported 28-day mortality,72-74,76,77,80,82,85 two studies reported in-hospital mortality,79,80 and one study each reported 90-day and 1 year mortality.77,78 The 28-day mortality rate in the PCT group was lower than the control group in all studies except two studies,82,85 though the decrease was statistically significant only in three studies.72,73,77 The reported in-hospital mortality and 90-day mortality were not statistically significantly different between the two groups, whilst the difference in 1-year mortality was statistically significant (Table 1).
Antibiotic cessation in respiratory tract infection
As presented in Table 2, we reviewed 22 clinical studies that involved patents with respiratory tract infection. Overall, 3272 patients were involved in the PCT group while 3221 patients were involved in the SOC group. Most of the studies recruited adult patients except one study 86 that recruited elderly patients aged >80 years, and two studies recruited children and adolescents.87,88 Two-third of the studies were multicenter by design and patients with chronic obstructive pulmonary disease (COPD)89-92 and community acquired pneumonia (CAP)88,93-95 were the focus in four studies each. Most of the studies measured PCT every other day starting from the day of enrollment,86-90,95-99 while few studies measured at daily basis.91,100,101 The absolute cut-off point of PCT to discontinue antibiotic therapy was 0.25 ng/ml in all of the studies except one study that used a value of 0.5 ng/ml. 101 The other study used a PCT value of <0.5 ng/ml to initiate Azythromycin and PCT> 0.5 ng/ml to initiate levofloxacin. 102 Moreover, there were studies that used a relative decrease of PCT from peak value by >80%-90%.
Characteristics of 22 clinical studies involving patients with respiratory tract infection.

AB: antibiotics; CAP: community acquired pneumonia; COPD: chronic obstructive pulmonary disease; ED: emergency department; LRTI: lower respiratory tract infection; ICU: intensive care unit; PCT: procalcitonin; SOC: standard of care.
Most studies reported reduction in duration of antibiotics in PCT groups compared to the SOC groups with an average reduction of 2.3 days. Three studies90,98,104 reported almost similar days of antibiotic exposure in both groups, while six studies90,96,98,101,104,105 showed lack of statistically significant difference in antibiotic duration between the two groups. Six studies reported 28-day or 30-day mortality,91,94,96,97,99,102 one study reported in-hospital mortality, (104) and one study reported 90-day mortality. 90 The 28-day or 30-day mortality rate in the PCT group was lower than the control group in all studies except two studies91,99 that reported higher mortality rate among the PCT group, and one study 96 reported similar mortality rate. However, the decreased mortality rate in PCT groups was not statistically significant in all studies. In addition, the reported in-hospital mortality and 90-day mortality were not statistically significantly different between the two groups (Table 2).
Economic Impact
Another crucial aspect of implementing PCT-guided antibiotic stewardship is evaluating its cost-effectiveness. While cost of repeated PCT measurement in the laboratory may be considered, it should be weighed against the cost reductions achieved through shortened antibiotic use. Jensen et al. found that the cost of using PCT-guided strategy for initiating antibiotics increased significantly. This was due to repeated PCT bioanalysis, additional use of broad- spectrum antibiotics, extra culture samples, extended use of mechanical ventilation and dialysis, and a longer ICU stay. 67 Conversely, as discussed in the following paragraphs, studies have shown significant cost saving when using PCT-guided approach to discontinue antibiotic therapy as compared to standard care.
Garnfeldt et al. investigated the budget impact of PCT-guided antibiotic stewardship among ICU admitted patients suspected of sepsis in Belgium. 108 The study compared the PCT-guided approach with SOC regarding annual budget impact on the Belgian health care system. Key model parameters included the duration of antibiotic therapy, mechanical ventilation, ICU and regular ward stays, the number of PCT tests per patient, and the unit costs of these variables. The results showed that PCT-guided approach reduced antibiotic exposure days by 66,868 days per year leading to cost savings of €1.98 million. On the other hand, implementing PCT-guided antibiotic stewardship for patients suspected of sepsis costs €68,220 (€1.90 per patient). The model also projected significant cost saving for the Belgian healthcare system, estimating potential saving of up to €49.90 million. These savings were primarily attributed to reductions in ICU length of stay and the duration of mechanical ventilation use.
Acost impact analysis by Geraerds et al. comparing health care costs between SOC and PCT-guided decision making based on the NeoPInS algorithm in neonates found no significant cost difference between the two groups (€3649 in PCT-group vs. €3616 in SOC group, P = .240). 109 However, sub-group analysis revealed varying results. For neonates categorized under the “infection unlikely” group, the cost of PCT-guided approach was less costly, where as in the “infection possible” group, PCT-guided approach was slightly more expensive compared to SOC. Exclusion of serious adverse events and related additional days of hospitalization resulted in significantly shorter hospital stay and lower total health care costs in the PCT-guided arm as compared to the SOC arm.
A study by Garay et al. assessed the budget impact of using PCT to guide treatment in sepsis patients in Argentina. 110 This study compared costs and outcomes between SOC and PCT-guided approaches, considering parameters such as the epidemiology of sepsis cases, hospital C. difficile cases, and AMR cases; days on antimicrobial therapy; length of stay due to AMR and C. difficile infection; number of PCT tests per patient; and effectiveness in reducing antibiotic therapy days, C. difficile infection, and AMR. The finding indicated that implementing a PCT-guided approach could avoid 734.5 thousand antibiotic treatment days [95% CI: 1,105.2;438.8], 7.9 thousand antibiotic-resistant cases [95% CI: 18.5;8.5], and 5.1 thousand C. difficile cases [95% CI: 6.7;4.2] per year. This equates to a savings of 83.0 million USD [95% CI: $183.6; $57.7] for the entire health system. A similar economical evaluation by Mewes et al. focusing on US-based studies, also found cost benefits associated with the PCT-guided approach. 111 Specifically, for sepsis patients, the PCT group showed a reduction in antibiotic duration by 5.83 days. Additionally, the length of stay in general wards and ICUs was shortened by 0.7 days and 3.6 days, respectively. The incremental costs for the PCT group were-$11,311 per patient. Furthermore, the study estimated that the incidence of antibiotic-resistant infections was 6.4% lower in the PCT-guided care group compared to standard care (206,442 vs. 193,219 patients).
Conclusion
Evidence from randomized controlled trials (RCTs) and meta-analyses indicates that procalcitonin (PCT)-guided antibiotic stewardship is particularly effective for discontinuing antibiotic therapy. This approach helps reduce the duration of antibiotic exposure, shorten hospital stay, and achieve significant cost saving. However, using PCT guidance to initiate antibiotics has not demonstrated notable clinical or economic benefits compared to standard care (SOC), while the decision to implement PCT-guided antibiotic stewardship should be tailored to individual clinical settings, applying this approach for antibiotic discontinuation in sepsis and patients with lower respiratory tract infections (LRTI) could be advantageous.
Supplemental Material
sj-docx-1-bmi-10.1177_11772719241298197 – Supplemental material for Procalcitonin Guided Antibiotic Stewardship
Supplemental material, sj-docx-1-bmi-10.1177_11772719241298197 for Procalcitonin Guided Antibiotic Stewardship by Girum Tesfaye Kiya, Elsah Tegene Asefa, Gemeda Abebe and Zeleke Mekonnen in Biomarker Insights
Footnotes
Acknowledgements
None
List of Abbreviations
AB Antibiotic
AMR Antimicrobial Resistance
CAP community acquired pneumonia
CKD chronic kidney disease
COPD Chronic Obstructive Pulmonary Disease
CRP C-reactive protein
CT Calcitonin
CT-mRNA Calcitonin messenger RNA
ED emergency department
EDTA Ethylene diamine tetra-acetic acid
ELISA Enzyme linked immunosorbent assay
EOS Early onset sepsis
GA Gestational age
ICU Intensive care unit
IFN-γ Interferon gamma
IL-1 Interleukin-1
IL-6 Interleukin -6
IQR Interquartile range
LOS Late onset sepsis
LPS lipopolysaccharide
LRTI Lower respiratory tract infection
MW Molecular weight
PASS Procalcitonin and Survival Study
PCT Procalcitonin
POC Point of care
RCTs Randomized controlled trials
RNA Ribonucleic acid
SIRS Systemic inflammatory response syndrome
SOC Standard of care
TNF-α Tumor necrosis alpha
VAP Ventilator associated pneumonia
WBCs white blood cells
Declarations
Supplemental material
Supplemental material for this article is available online.