
Abstract
Background:
Bacteremia and sepsis are significant contributors to the morbidity, mortality, and economic burden of health care systems worldwide. Procalcitonin has been identified as a potentially useful marker of disease and severity in sepsis. However, the assumption that greater procalcitonin levels correlate with greater burden of disease has not been adequately studied.
Methods:
A retrospective chart review of adult patients admitted to an urban teaching hospital with suspected sepsis was undertaken to test the association of elevated procalcitonin (>30 ng/mL) with other markers of sepsis (lactic acid, white blood cell count, percent bands), severity of disease (Sequential Organ Failure Assessment [SOFA] and Acute Physiology and Chronic Health Evaluation–II [APACHE II] scores), and mortality.
Results:
In total, 168 patients were identified over 18 months (42% ward, 11% Stepdown, 44% medical intensive care unit [MICU], 2% surgical intensive care unit (STICU), 1% gynecology [GYN]). The Spearman correlation analysis showed that serum procalcitonin level did not correlate with SOFA (P = .238) or APACHE II (P = .918) scores on admission, and did not correlate with survival (Kruskal-Wallis test, P = .937). However, higher serum procalcitonin levels were associated with patients who had positive blood cultures (Kruskal-Wallis test, P = .0016 for Gram-positive and P = .0007 for Gram-negative bacteria). Lactic acid levels on admission strongly correlated with SOFA APACHE II (the Spearman correlation, P < .0001 for both) and mortality (P = .0001 for both).
Conclusions:
Higher serum procalcitonin levels above 30 ng/mL failed to correlate with indicators of sepsis, severity of disease (SOFA and APACHE II scores), and mortality but were associated with positive blood cultures. Lactic acid levels did show correlation to both severity of disease and mortality. Serum procalcitonin levels >30 ng/mL do not appear to correlate with the severity of disease in a sample of patients with markedly elevated initial procalcitonin levels.
Introduction
Bacteremia and sepsis are among the most common conditions encountered in hospitalized patients. The morbidity, mortality, and economic burden of this spectrum of disease are significant 1 and have not shown significant improvement over recent time. 2 Thus, there has been continued effort to identify patients with suspected bacteria-related sepsis early, accurately prognosticate and treat, and thereby improve overall outcomes. Procalcitonin was first identified in vitro in the late 1980s and in vivo in the 1990s as a potential indicator of bacterial infection 3 and has since undergone significant study for this purpose.
Procalcitonin is a pro-hormone physiologically secreted in a tissue-specific manner by C-cells in the thyroid gland and cleaved to calcitonin involved in calcium regulation.4,5 In response to the inflammatory cytokines released in response to the presence of bacterial infection, gene upregulation results in the systemic liberation of procalcitonin into the bloodstream4,5 and its potential utility as a marker of sepsis. While site-specific infection data show some variance, serum levels of <0.1 ng/mL are generally accepted as supporting a strongly unlikely cause of symptoms to be related to bacterial infection, and levels of >1 ng/mL are strongly suggestive of bacteremic sepsis. 6
More recently, initial serum procalcitonin levels have been shown to correlate with disease severity.
Several studies suggest that markedly elevated procalcitonin levels are associated with more severe disease and worse outcomes.7-12 However, while conclusions from meta-analyses appear to support the association of higher procalcitonin levels with worse clinical outcomes in patients with sepsis,13,14 the overriding theme across a review of meta-analyses shows only moderate sensitivity and slightly worse specificity. 15 More importantly, significant heterogeneity in study populations, designs, results, and range of serum procalcitonin values has been described across studies, as demonstrated in a meta-analysis by Liu et al in which cutoff procalcitonin values for prognosis ranged from 0.12 to 14.27 ng/mL. 13 Nonetheless, these results have led to the practice-applied assumption that higher procalcitonin levels correspond to worse clinical outcomes.
As the evolution of sepsis treatment shows that the greatest clinical and economic burden of sepsis occurs in those with less severe clinical disease initially, 16 serum markers continue to be of great interest in improving outcomes. Therefore, while previous studies have largely focused on the clinical significance of low-to-moderately elevated procalcitonin levels,13-15 no study to-date has adequately studied the clinical correlation and significance of markedly elevated procalcitonin levels. The aim of the present study was to investigate the clinical significance of markedly elevated serum procalcitonin levels and its utility as a diagnostic and prognostic indicator for sepsis. We hypothesized that markedly elevated serum procalcitonin level would correlate with lactic acid, mortality, morbidity, and severity of disease.
Materials and Methods
A retrospective chart review of patients admitted to an urban teaching hospital with suspected sepsis was performed. Patients admitted between July 1, 2017, and December 31, 2018 (a period during which serum procalcitonin was in heavy use in this institution) with suspected sepsis and serum procalcitonin levels of ⩾30 ng/mL were screened for inclusion. The study population was limited to adult patients who were admitted to the wards, step-down unit, and intensive care units (ICUs) of the medicine, trauma, and surgical services. Patients were excluded if there were insufficient data (absent blood gas analysis was accepted) within the first 24 hours of admission. The first procalcitonin level during admission was used. This value was chosen based on prior studies that showed that higher initial procalcitonin levels were more strongly associated with more severe disease (ie, severe sepsis and septic shock).7-9 The study was approved by the local institutional review board.
Chart review was completed by 6 investigators, and all discrepancies were discussed among the group. The Sequential Organ Failure Assessment (SOFA) and Acute Physiology and Chronic Health Evaluation–II (APACHE II) scores17,18 were calculated for all patients on admission. For any patient in which arterial blood gas analysis was not done, normal values were assumed, as it was presumed that the clinical condition did not warrant arterial blood draws, thereby favoring the null hypothesis and decreasing the probability of Type 1 errors. For patients for whom mean arterial pressure (MAP) was not available prior to initiation of vasopressor support, an MAP of 65 mm Hg was assumed (minimum score criteria for hypotension), as this is the criterion for initiation of vasopressor therapy within our institution.
The procalcitonin assay used for the duration of the study was the ARCHITECT B.R.A.H.M.S PCT assay by Abbot Laboratories performed on the Abbott ARCHITECT i1000SR immunoassay analyzer, in accordance with manufacturer’s instructions. The assay can detect an interval of 0.02 to 100.00 ng/mL and can report values up to 1000.00 ng/mL using the 1:10 automated dilution protocol. 19
Statistical analysis
Demographic and clinical characteristics were summarized using descriptive statistics. Given the design of the study, the distribution of procalcitonin levels (the primary variable of interest) and other markers of sepsis (white blood cell [WBC] count, Lactic Acid, and % Bands) were checked for normalcy, all of which did not fit a normal distribution (the Shapiro-Wilk goodness-of-fit test, P < .0001 for all), and thus we used nonparametric statistical analysis. Serum markers of sepsis (Procalcitonin, Lactic Acid, White-blood-cell count, % Bands [ie, immature granulocytes]) were compared between groups of interest using independent-sample Kruskal-Wallis test for multiple group comparisons. These groups included patients with end-stage renal disease on regular hemodialysis (ESRD on HD), who were immunocompromised or who had a history of cancer. Serum markers of sepsis were also compared between groups based on source of infection and bacterial Gram-stain classification (ie, Gram-positive vs Gram-negative bacteria). Bonferroni correction for all significant values was undertaken to determine specific between-group significance.
Correlation analysis was performed between procalcitonin and SOFA score, APACHE II score, and lactic acid using the Spearman correlation, as well as with respect to overall mortality by Kruskal-Wallis test. Serum procalcitonin level was also compared between groups as determined by their final disposition, categorized as favorable (patients discharged home or to acute rehab), intermediate (subacute rehab), and unfavorable (deceased or discharged to inpatient hospice).
Data were analyzed using STATA 16. A P value of .05 was determined to be significant for all analysis.
Results
A total of 206 patients were identified with procalcitonin levels greater than 30 ng/mL during the 18-month study period. After exclusion of patients <18 years of age and those with insufficient clinical data, 168 patient charts were included for full analysis as 38 patients (18%) had insufficient data (missing lactic acid, or insufficient data to calculate SOFA or APACHE II scores on admission). Of the 168 patients for whom data were included, 32 patients (19%) did not have arterial blood gas analysis as part of their workup, and therefore normal values were assumed.
Demographics
Basic clinical and demographic characteristics are described in Table 1. The median age was 66 years (inter-quartile range [IQR] = 54-76.5), and males made up a slightly large portion of the study population at 58%. Regarding pertinent past medical history, 21% of patients had ESRD and were on HD, 17% had a history of cancer, and 23% were identified as being immunocompromised. Disposition on admission was as follows: 42% medical ward, 11% adult step-down, 44% medical intensive care unit (MICU), 2% surgical service and ICU, and 1% gynecology. Overall, 73% of patients were identified as having suspected sepsis on admission.
Descriptive statistics of the study population.

Abbreviations: APACHE II, Acute Physiology and Chronic Health Evaluation–II; IQR, inter-quartile range; SOFA, Sequential Organ Failure Assessment; WBCs, white blood cells.
Disposition—Favorable: discharge home or to acute rehab; Intermediate: discharge to subacute rehab facility; Unfavorable: discharge to hospice, or death on discharge.
Laboratory markers of sepsis
The medians and IQR for markers of sepsis on admission for the study population are listed in Table 1. There was no significant difference for procalcitonin level between the sexes (Kruskal-Wallis test, n = 168, P = .86). In addition, no significant difference in procalcitonin level was identified in the subgroups of patients on regular hemodialysis (Kruskal-Wallis test, n = 168, P = .1623), history of cancer (Kruskal-Wallis test, n = 168, P = .503), identified as immunosuppressed (Kruskal-Wallis test, n = 168, P = .7825), or those with an admission diagnosis of sepsis (Kruskal-Wallis test, n = 168, P = .244) (Table 2).
Analysis of serum markers of sepsis with respect to patient characteristics at admission, diagnosis of suspected sepsis on admission, mortality, and final disposition on hospital discharge.
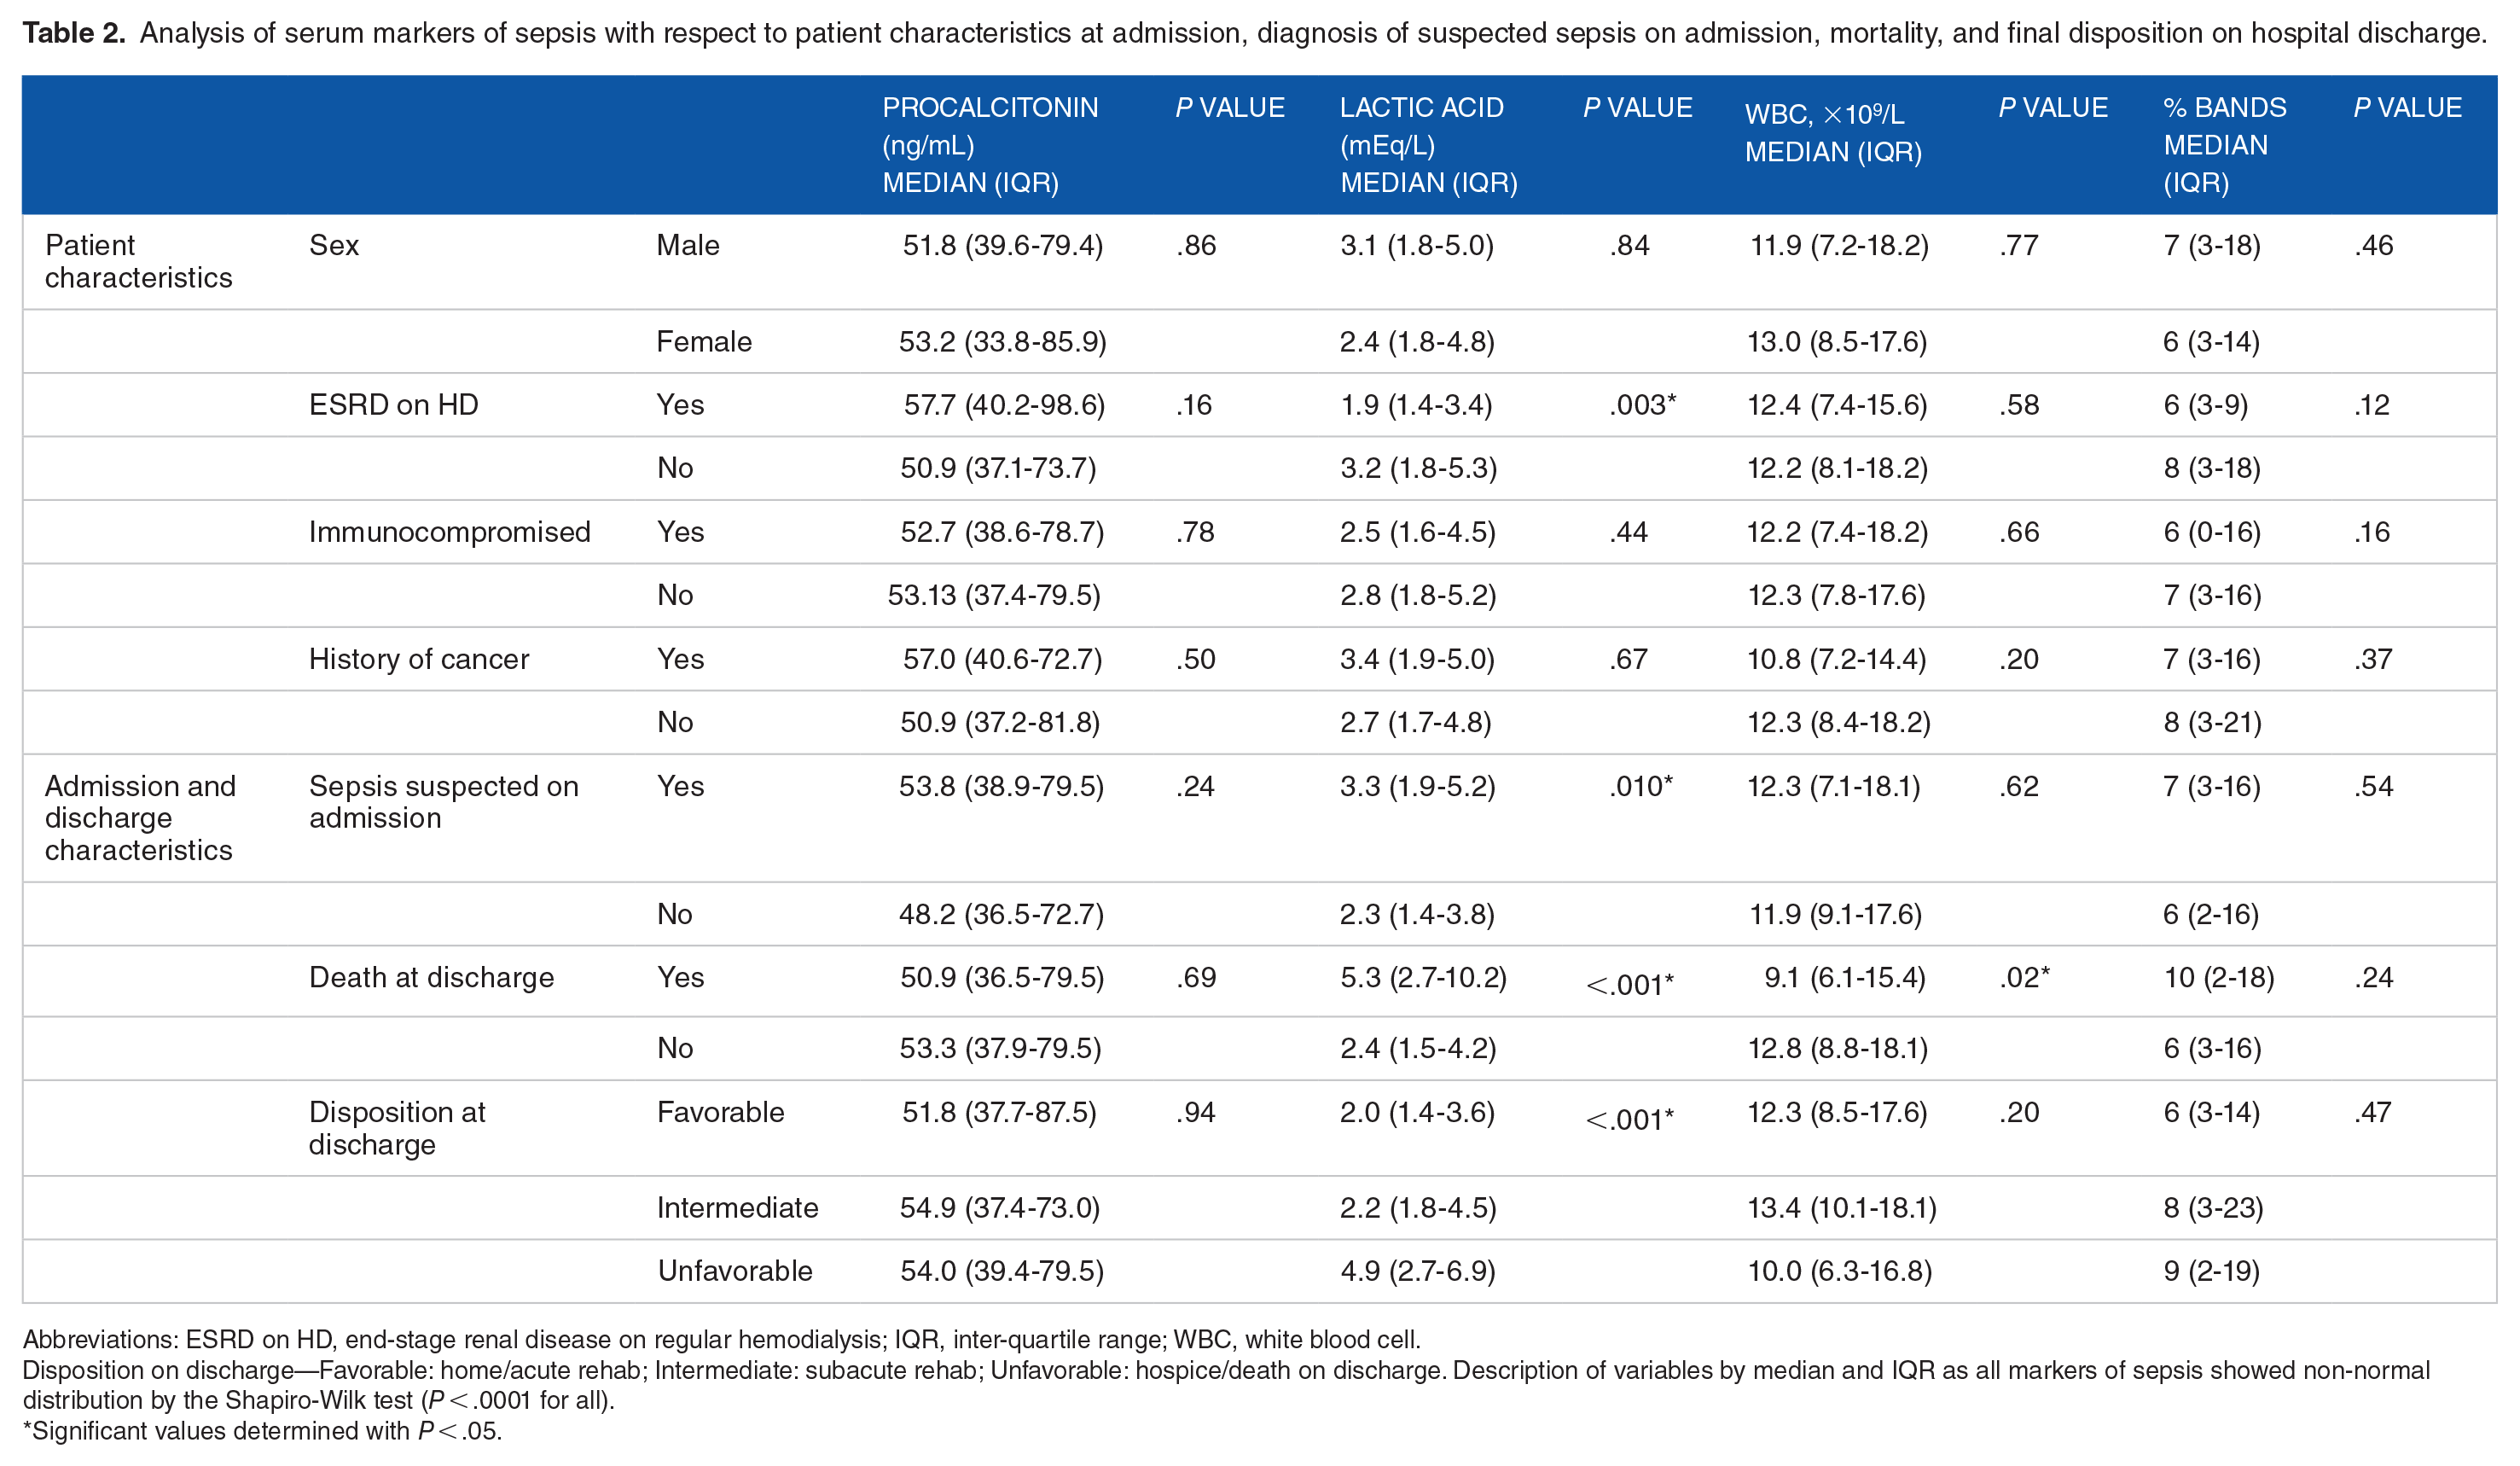
Abbreviations: ESRD on HD, end-stage renal disease on regular hemodialysis; IQR, inter-quartile range; WBC, white blood cell.
Disposition on discharge—Favorable: home/acute rehab; Intermediate: subacute rehab; Unfavorable: hospice/death on discharge. Description of variables by median and IQR as all markers of sepsis showed non-normal distribution by the Shapiro-Wilk test (P < .0001 for all).
Significant values determined with P < .05.
The SOFA and APACHE II scores for the study population are listed in Table 1. No significant correlation was observed between procalcitonin and SOFA (the Spearman correlation, n = 168, P = .238) or APACHE II (the Spearman correlation, n = 168, P = .918) scores (Table 3). However, a positive correlation was observed for SOFA and APACHE II scores on admission with serum lactic acid level (the Spearman correlation, n = 168, P < .0001 for both) and % bands (the Spearman correlation, n = 168, P = .0005 for SOFA and P = .0014 for APACHE II) (Table 3).
The Spearman correlation analysis for sepsis markers and severity of disease on admission by SOFA and APACHE II scores, and between markers of sepsis.

Abbreviations: APACHE II, Acute Physiology and Chronic Health Evaluation–II; SOFA, Sequential Organ Failure Assessment; WBC, white blood cell.
The Spearman coefficient expressed as rho.
Denotes significant values with P < .05.
Mortality and disposition
Final disposition was available for 94% of the study population and is shown in Table 2. Overall, 43 patients (25.5%) had died on hospital discharge. Mortality was not associated with procalcitonin levels (Kruskal-Wallis test, n = 168, P = .69). Higher lactic acid levels were associated with mortality (Kruskal-Wallis test, n = 168, P = .0001), while lower initial WBC count was associated with mortality (Kruskal-Wallis test, n = 168, P = .02). Discharge disposition was stratified into 3 categories: favorable (discharged home or to acute rehab), intermediate (discharged to subacute rehab), and unfavorable (discharge to inpatient hospice or deceased). No significant difference was observed between final disposition and procalcitonin (Kruskal-Wallis test, n = 158, P = .937), initial WBC count (Kruskal-Wallis test, n = 158, P = .201), or % bands on admission (Kruskal-Wallis test, n = 158, P = .465). Serum lactic acid was found to be strongly associated with a less favorable discharge disposition (Kruskal-Wallis test, n = 158, P = .0001) (Table 2).
Microbiologic data
Positive cultures were identified in 130 (77.4%) patients. The most frequently positive cultures were from blood (52%), urine (24%), and respiratory (23%) sources. Mixed source cultures (ie, patients with more than one source positive) were identified in 28% of patients.
Microbiologic data for those with positive cultures were as follows: bacterial only (92.3%), mixed bacterial and fungal (6.9%), and fungal only (0.8%). Among the bacterial profile found in culture-positive patients, solitary Gram-positive infections accounted for 31.7% of infections, whereas 61% were caused strictly by Gram-negative infections. Considering those patients who had mixed cultures (both Gram-positive and Gram-negative bacteria present; 6.1%), the total number of patients with Gram-negative bacterial infections was 68.3%. Procalcitonin was found to be significantly different depending on the microbiologic data (Kruskal-Wallis test, n = 168, P = .0263). On between-group analysis after Bonferroni correction for pairwise comparisons, procalcitonin levels were found to be significantly higher in patients with Gram-positive cultures (P = .0016) and Gram-negative cultures (P = .0007). No significant difference in serum procalcitonin level was appreciated between Gram-positive versus Gram-negative cultures (Kruskal-Wallis test, n = 128, P = .599; Figure 1). Analysis was not performed for fungal cultures as only 1 patient was found to have a fungal infection as the likely source of infection.

Box graph of serum procalcitonin levels in relation to bacterial culture results. A significantly higher serum procalcitonin level in those patients with positive bacterial cultures (denoted by the letter B) when compared with those with negative cultures (denoted by the letter A). Analysis by way of Kruskal-Wallis test showed significant difference between the groups (n = 168, P = .0263). Further analysis after Bonferroni correction (P < .008) showed significantly higher procalcitonin levels in patients with positive (B1) Gram-positive cultures (n = 82, P = .0016) and positive (B2) Gram-negative cultures (n = 117, P = .0007).
Discussion
The present study failed to show a significant association between procalcitonin levels >30 ng/mL with the severity of disease as determined by the APACHE II and SOFA scores on admission, disease-associated morbidity as determined by disposition on discharge, and mortality. Significant study has gone into early markers of sepsis to try and predict the presence and severity of disease, as well as mortality. While the elevation of serum procalcitonin in response to bacterial infection and sepsis has been well documented, meta-analyses have shown that higher procalcitonin levels are associated with increased risk in mortality. 13 However, the cutoff value of said utility remains debated and is largely due to the heavy emphasis on low levels of procalcitonin in the literature and outlier data extrapolated from a small number of studies not designed to evaluate such values.7-12 This has created a bias in which markedly elevated values are taken out of context.
We took 2 steps to confirm that our study population addressed the question at hand. First, a right-of-center distribution was achieved by selecting for patients with serum procalcitonin >30 ng/mL. This is supported by the study of Kim et al, in which initial serum procalcitonin levels of >4.71 ng/mL had a 79% specificity for septic shock. 7 Second, by evaluating serum lactic acid levels and observing a strong correlation with severity of disease on admission by both SOFA and APACHE II scores, discharge disposition and mortality, as confirmed in prior studies,20,21 we are able to support the assumption that this population is representative of patients who are reasonably suspected of having sepsis on admission, and would therefore benefit from early prognostication markers for severity of sepsis. Therefore, we are able to conclude that there is, in fact, an umbral to which a higher serum level is not predicative of a given clinical course or outcome.
While disease severity scores such as SOFA and APACHE II on admission and mortality are variables that are frequently studied, we sought to further evaluate disease-associated morbidity by evaluating discharge disposition. By stratifying disposition into favorable (discharged home or to acute rehab), intermediate (discharged to subacute rehab), and unfavorable (discharged to hospice or deceased) in the context of disease severity on admission (SOFA and APACHE II), we are able to evaluate whether or not there is association between the serum procalcitonin levels on admission, initial disease severity, and consequent morbidity. The absence of these associations further strengthens our conclusion that markedly elevated serum procalcitonin levels do not appear to be of clinical utility in predicting a disease course.
Microbiologic analysis
Serum procalcitonin levels were significantly higher in patients with documented presence of infections, which is consistent with the pathway of synthesis being strongly linked to the pathologic presence of bacteria. 5 However, surprisingly no significant difference was found between infections caused by Gram-positive versus Gram-negative bacteria. This is at odds with the results by Yan et al, which found an association between Gram-negative infections and higher values of procalcitonin when compared with Gram-positive infections. 22 While this may be in part due to their study having a lower serum procalcitonin range of focus, it does challenge the notion that Gram-negative bacteria are a stronger stimulus for the synthesis of procalcitonin than Gram-positive bacteria, as we would have expected to see significant correlation given the serum procalcitonin levels evaluated. Study with a wider range of procalcitonin values would be required to draw definitive conclusions.
Limitations
As with any chart-review study, the depth of data is reliant on chart completion in a clinical and non-research protocol directed data collection format. For this reason, missing arterial blood gas data were assumed to be normal data, as these patients were assumed to not require said level of monitoring or evaluation.
All data were collected in a single-center community hospital (Stroke center, Level 1 Trauma center, Chest Pain center). While this gives homogeneity to the data, and likely is representative of practice at many community hospitals, it does decrease the external validity of the results as it is a single-center study in an urban safety-net hospital in the United States.
Finally, antibiotic therapy (drug selection, time of initiation, pathogen susceptibility) was not evaluated. In addition, there exists the suggested possibility in the literature that procalcitonin elevation could correlate with certain bacterial species, fungal species, and/or antimicrobial resistance profiles. The data were not robust enough to analyze such endpoints and therefore fall outside the scope of this article.
Conclusions
The present study suggests that above 30 ng/mL, higher levels of serum procalcitonin are not associated with worse SOFA or APACHE II scores on admission, disposition on discharge, or mortality as suggested by previous studies based on outlier data but are significantly associated with the presence of bacterial infection.
Footnotes
Funding:
The author(s) received no financial support for the research, authorship, and/or publication of this article.
Declaration of conflicting interests:
The author(s) declared no potential conflicts of interest with respect to the research, authorship, and/or publication of this article.
Authors’ Note
All work related to the preparation of this manuscript was performed at Jamaica Hospital Medical Center during the authors’ work at the Center.
Author Contributions
All authors have contributed meaningfully in the creation of this manuscript, and have signed off on the final version.
Availability of Data
De-identified data and analysis are available upon reasonable request.
Consent for Publication
All authors and the institutional research department have signed off on the final version of this manuscript, giving consent for publication.
Ethical Approval and Consent to Participate
Institutional Review Board (IRB) approval for the present study was obtained by the local IRB. A waiver of informed consent was granted by the IRB.