
Abstract
Background:
Hypoxia, a condition where there is a lack of oxygen, is known to play a role in cancer progression.
Objective:
This study investigates the correlation between HIF1A gene-altered expression and hypoxia in Bangladeshi breast cancer (BC) cases and TCGA_BC datasets.
Design:
This case-control study compares BC cases to healthy controls to understand the relationship between gene changes and cancer.
Method:
This study used advanced analysis methods to examine the transcriptional landscape of BC, and quantitatively assessed its correlation using integrated multi-omics analysis.
Results:
In Bangladeshi BC cases, the T allele of HIF1A rs1154946 correlates notably (P-value < .001) with BC incidence. ELISA results confirmed a significant association (P-value < .005) between elevated HIF1A expression and BC-related hypoxia. Bioinformatics eQTL analysis validated the correlation between increased HIF1A expression and rs11549465 T allele (P-value < .01). Structural analyses suggested that rs11549465 (P582S) mutation may decrease protein stability (ΔΔG-value: −1.24 kcal/mole), potentially affecting HIF1A function. HIF1A enrichment analysis in BC underscores strong associations with oxygen levels, hypoxia, metabolic processes, apoptosis, and programed cell death (P-value < .001). Transcriptomic data demonstrated a robust correlation (P-value < .0001) between HIF1A expression and copy-number alterations, mutations, and abnormal methylation. Altered HIF1A expression showed strong negative correlations (P-value < .00001) with methylation and the expression of the ER (ESR1), in Whites. Survival analysis revealed marked differences in overall survival linked to high and low HIF1A expression (P-value < .00001). Furthermore, HIF1A expression significantly correlated (P-value < .000001) with hypoxia, TMB, MSI, and immune infiltration by CD8+ T cells, neutrophils, dendritic, and macrophages, providing deeper insights into the BC microenvironment.
Conclusion:
Thus, the HIF1A gene could serve as a promising biomarker for breast cancer progression, control, and survival across ethnicities, emphasizing its role in disease development and regulation.
Plain Language Summary
Hypoxia is a known indicator of cancer progression. This study investigates the correlation between HIF1A gene-altered expression and hypoxia in Bangladeshi breast cancer (BC) cases and TCGA_BC datasets. This case-control study examined the transcriptional landscape of breast cancer, and quantitatively assessed its correlation using integrated multi-omics analysis. In Bangladeshi BC cases, the T allele of HIF1A rs1154946 correlates notably ( P-value <.001) with BC incidence. ELISA results confirmed a significant association (P-value < .005) between elevated HIF1A expression and BC-related hypoxia. Bioinformatics eQTL analysis validated the correlation between increased HIF1A expression and rs11549465 T allele (P-value < .01). Structural analyses suggested that rs11549465 (P582S) mutation may decrease protein stability (ΔΔG-value: –1.24 kcal/mole), potentially affecting HIF1A function. HIF1A enrichment analysis in BC underscores strong associations with oxygen levels, hypoxia, metabolic processes, apoptosis, and programed cell death ( P-value <.001). Transcriptomic data demonstrated a robust correlation ( P-value < .0001) between HIF1A expression and copy-number alterations, mutations, and abnormal methylation. Altered HIF1A expression showed strong negative correlations ( P-value < .00001) with methylation and the expression of the ER ( ESR1), in Whites. Survival analysis revealed marked differences in overall survival linked to high and low HIF1A expression ( P-value < .00001). Furthermore, HIF1A expression significantly correlated ( P-value < .000001) with hypoxia, TMB, MSI, and immune infiltration by CD8+ T cells, neutrophils, dendritic, and macrophages, providing deeper insights into the BC microenvironment. Thus, the HIF1A gene could serve as a promising biomarker for breast cancer progression, control, and survival across ethnicities, emphasizing its role in disease development and regulation.
Introduction
For women across the globe, Breast Cancer (BC) is the second leading cause of death.1,2 The most common risk factors associated with breast cancer are inheritance, genetics, obesity and overweight, alcohol consumption, smoking, menopause, prolonged hormone replacement therapy, sedentary lifestyle, and reproductive issues.3-5 In cancer biology, hypoxia is the well-known index in association with tumor development, regulation and metastasis. 6 The Hypoxia-Inducible Factor 1 (HIF1) plays a vital role in oxygen sensing under normal conditions (normoxia) and/or in tumor development and metastasis (hypoxia) by regulating the expression of over 1000 target genes that are involved in numerous cellular functions like glucose metabolism, cell survival, cell proliferation, cell apoptosis, erythropoiesis, iron metabolism and especially in angiogenesis.7-11 HIF1 is a heterodimer basic helix-loop-helix protein containing the α-subunit (HIF1A) and β subunit (HIF1B).
Under normal conditions (normoxia), only the α-subunit (HIF1A) expresses. This transcription factor after sensing the levels of oxygen degrades rapidly through a proteolytic degradation process and the β-subunit (HIF1B) never expresses. In this process, at the N-terminal oxygen-sensitive degradation domain of HIF1A, 2 proline residues (P402 and P564) undergo hydroxylation which then binds with the Von Hippel–Lindau (VHL) protein. This VHL conjugate is then a binding target of Ubiquitin molecules and subsequently, the ubiquitinylation process triggers proteasomal degradation of the HIF1A.12-14 Whereas, under hypoxic conditions, these 2 proline residues at the oxygen-sensitive degradation domain of HIF1A do not go through hydroxylation and as a consequence do not undergo proteasomal degradation. The HIF1A is stabilized and then moves from the cytosol to the nucleus and constitutively the HIF1B, which is also known as Aryl hydrocarbon Receptor Nuclear Translocator (ARNT) expressed and binds with HIF1A subunit forming the heterodimer and then regulates transcription of various genes controlling erythropoiesis, tumor proliferation, angiogenesis and many more.15-20 Thus the HIF1A is a crucial transcription factor that plays an important role in the development of different diseases or disorders in the human body by regulating the functions of some genes at low oxygen concentrations. 21 However, direct evidence of the levels of varied expression of HIF1A, their roles, and exact mechanism, correlating with various diseases remain obscured.
In recent years, the availability of high-throughput multi-Omics data provided the opportunity to unfold the molecular basis of cancer by analyzing genetic alterations like copy number alterations, mutations, and epigenetic regulations in tumors. Now, genetic polymorphisms like Single Nucleotide polymorphisms (SNPs) are considered the most valuable biomarkers in association with human diseases and/or disorders and cancers.22-24 The human HIF1A gene has 35 SNPs. 4 From the literature, the involvement of the 2 SNPs rs11549465 (C/T), and rs11549467 (G/A) of the HIF1A gene was mostly reported in association with different diseases and cancer.22-24 These 2 SNPs (rs11549465 and re11549467) are located within the oxygen-dependent degradation (ODD) domain of exon 12 of the HIF1A gene.25,26 They are responsible for amino acid substitution from proline to serine (P582S, rs11549465) and alanine to threonine (A588T, rs11549467) respectively.25,26 Involvement of these 2 SNPs (P582S, A588T) was reported with increased levels of expression as well as transcriptional activity in the progression of different cancers including oral, colorectal, head and neck, renal, and hepatic cancer.3,27-29 Breast cancer biology is complex, and yet to fully comprehend. In recent years, the availability of TCGA (The Cancer Genome Atlas) datasets and resources like cBioportal allow us to integrate, validate and compare various levels of multi-omics information across different races and to understand complex diseases like cancer better and move a step forward toward precision medicine. 30
This study aimed to systematically evaluate the expression, function, and prognostic value of the HIF1A gene in breast invasive carcinoma (BC), interrelate the link between hypoxia and breast cancer incidences among different races and subtypes, and also to assess the prognostic relevance of HIF1A expression in overall survival. The main target was to quantitatively measure hypoxia in Bangladeshi breast cancer patients and evaluate their clinical and demographic factors. In addition, integration of literature mining and case-control datasets from The Cancer Genome Atlas (TCGA) was employed to assess HIFA transcripts and their genetic modifications in BC. To evaluate hypoxia in BC, we compared the levels of HIF1A expression in breast cancer patients of different races (Caucasian, African, and Asian) through multi-omics approaches using cBioPortal.30-36 This study investigated the structure-function relationship of HIF1A and examined the impact of SNPs in association with hypoxia and BC. Enrichment analyses and integrated network construction were utilized to establish correlations among interactions and regulatory pathways associated with BC. Here, we targeted to evaluate the possibility of HIF1A, as a potential biomarker in BC screening, by interrelating breast cancer genomic data with clinical features. Thus, this study aims to comprehensively evaluate the significance of HIF1A in breast cancer, with the ultimate goal of enhancing screening, diagnosis, and treatment for Bangladeshi breast cancer patients.
Methods
Bangladeshi breast cancer and healthy control study subjects’ inclusion-exclusion criteria
A total of 29 subjects including 12 women who were diagnosed with breast cancer (cases) and 17 healthy adult Bangladeshi women (controls), who were willing to participate, were enrolled for this study. BC patients were screened through histopathological evaluation and samples were collected from the National Institute of Cancer Research and Hospital (NICRH), Mohakhali, Dhaka from January 2023 to March 2023. The study participants’ inclusion criteria were: adult Bangladeshi women between 25 and 65 years of age, not pregnant, with no major comorbidities, and willing to participate. The exclusion criteria were: pregnant women, patients with severe debilitating conditions and unwilling to participate in the study. The research goals and procedures were properly explained to all participants before enrolling and their verbal and written consent were collected before inclusion and taking samples. The study was conducted in full compliance with the Declaration of Helsinki guidelines, ensuring the privacy and anonymity of all participants throughout the process. Intravenous blood sampling was conducted by trained professionals. This study was approved by the Ethics Committee of the National Institute of Cancer Research and Hospital (NICRH), Mohakhali, Dhaka, Bangladesh (Reference: NICRH/IRB/2023/28).
Bangladeshi BC cases genomic data analysis
Chemicals and reagent kits used: K2-EDTA vacuum blood collection tube (BD, Franklin lakes, USA), ReliaPrep™ Blood gDNA Miniprep System (Promega, Madison, USA), Agarose powder (Sigma Aldrich, Germany), Tris-HCl, EDTA, Ethidium Bromide, 6X loading dye (Promega), GoTaq® G2 Master Mix (Promega, Madison, USA), 100 bp DNA ladder (Invitrogen™, Thermo Fisher Scientific, Austria), Wizard® SV Gel and PCR Clean-Up System (Promega, Madison, USA), HIF1A gene primers (IDT, Singapore), HIF1A protein ELISA Kit (Invitrogen™, Thermo Fisher Scientific, Austria), Ethanol (Merck, Germany) and so on. All these chemicals and reagents were of analytical grade and available in the market.
Genotyping of the breast cancer cases and healthy controls: The whole human genomic DNA (gDNA) of both cases and the control subjects were isolated from the buffy coat of collected blood samples using the ReliaPrep™ Blood gDNA Miniprep System (Promega, Madison, USA). All isolated gDNA samples were qualitatively analyzed using 0.8% (w/v) agarose gel electrophoresis and quantitatively assayed using a Nanodrop 2000 spectrophotometer (Thermo Scientific, USA) and the DNA purity index of the extracted genomic samples was measured. The isolated gDNA of both cases and controls were used as a template to amplify the HIF1A gene, using synthetic oligonucleotide primers (forward: 5ʹ-AAGGTGTGGCCATTGTAAAAACTCATG-3ʹ and reverse: 5ʹ-GTGAGGCTGTCCGACTTTGAGTATCTC-3ʹ; from Integrated DNA Technology [IDT], Singapore), GoTaq® G2 Master Mix (Promega, Madison, USA), and a Thermocycler (Esco Swift™ MaxPro, USA) by polymerase chain reactions (PCR). The PCR amplified products were evaluated using agarose gel electrophoresis and were further purified and extracted using the Wizard® SV Gel and PCR Clean-Up System (Promega, Madison, USA). Ensuring the quality and purity of the amplified samples (both breast cancer cases and healthy controls), DNA samples were sent for sequencing. All amplified samples were sequenced using both the HIF1A forward and reverse primers. The sequencing analysis was conducted by the 1st Base Life Technologies (Malaysia) using the ABI-prism Big Dye Terminator Cycle sequencing ready reaction kit and sequencing reactions were analyzed using an ABI 3500 automated genetic analyzer (ABI Prism, USA).
Evaluating the DNA sequenced data of HIF1A gene rs11549465 and rs11549467 polymorphisms: The DNA sequenced data of both cases and controls of the HIF1A rs11549465 (C/T) and rs11549467 (G/A) SNPs were carefully aligned, matched and analyzed using BLAST (the Basic Local Alignment Search Tool; https://blast.ncbi.nlm.nih.gov/Blast.cgi) and mutations were evaluated using dbSNP (https://www.ncbi.nlm.nih.gov/snp/). The 1000 Genomes Project, Phase 3 dataset (http://asia.ensembl.org/Homo_sapiens/Variation/Population?db=core;r=14:61740339-61741339;v=rs11549465), was used for Linkage Disequilibrium (LD) and allele frequency distribution analysis of the HIF1A rs11549465 and rs11549467 SNPs among different Asian countries including Bangladesh. The risk frequency of the HIF1A rs11549465 polymorphism in breast and other tissues was compared and analyzed through multi-tissue eQTL regression analysis using the GTex portal (https://gtexportal.org/home/snp/). Further, these rs11549465 (C > T) and rs11549467 (G > A) polymorphisms were evaluated for their mutagenic properties, and structural effects through several bioinformatics tools: like I-Mutant (https://folding.biofold.org/i-mutant/i-mutant2.0.html): for determining the protein stability due to the amino acid substitution at a particular position; Consurf (https://consurf.tau.ac.il/consurfindex.php): for detecting the protein’s buried or exposed position after the amino acid alteration using the conservation score; SNAP2 (https://rostlab.org/services/snap2web/): to evaluate the functional effect of the altered protein, and NetSurfP-3 (https://dtu.biolib.com/NetSurfP-3/): was used for evaluating the surface accessibility prediction of the HIF1A polymorphisms (rs11549465 and rs11549467).
Structural-functional analysis of the HIF1A wild-type and mutant proteins: To comprehend the functional associations and pathway regulation of HIF1A, a protein-protein interactions network was generated using the STRING database (https://string-db.org/). The topological degree and betweeness of the hub proteins in the generated PPI network were analyzed, and the protein class abundance interactome of HIF1A was evaluated using the Konnect2prot (k2p; https://konnect2prot.thsti.in/) data portal. The enrichment analysis of the HIF1A-associated network proteins was conducted through STRING, and ShinyGO 0.77 (http://bioinformatics.sdstate.edu/go/), Also, the correlation networks among different hub proteins with signaling pathways and disease hallmarks were analyzed through k2p.
3D structural model of the HIF1A wild-type and P582S mutant proteins prediction and evaluation through homology modeling and Molecular dynamics (MD) simulations: The human hypoxia-inducible factor 1 subunit alpha (HIF1A) protein comprising of 826 residues, sequence data were retrieved from the UniProt (https://www.uniprot.org/uniprotkb/Q16665), and RefSeq (https://www.ncbi.nlm.nih.gov/gene/3091) databases. The 3D domain model was predicted using the ab initio protein structure prediction server Robetta (https://robetta.bakerlab.org/). To understand the structural variations in the mutant protein compared to the wild-type structure, the predicted 3D coordinated models were validated through comparative protein domains analysis, energy minimization, and molecular dynamics simulations (MDS) using Robetta. The 3D structure modeling and analysis were performed using SWISS-MODEL (https://swissmodel.expasy.org/), I-TASSER (https://zhanggroup.org/I-TASSER/), Discovery Studio (https://discover.3ds.com/discovery-studio-visualizer), Swiss-PDB Viewer (https://spdbv.unil.ch/) and TM-align (https://seq2fun.dcmb.med.umich.edu//TM-align/). The HIF1A wild-type and Mutant (P582S) proteins 3D models were super-imposed based on analyzing the TM-score (template modeling score) and RMSD (root mean square deviation) values. A TM-score ranging from 0 (unrelated protein) to 1 (perfect match) was used for model evaluation. The 3D models of WT_HIF1A and MT_HIF1A were subjected to MD simulations in water using WebGro (https://simlab.uams.edu/) to assess the structural impact of the mutation through energy minimization, equilibration, molecular dynamics (MD), and trajectory analysis. The MD simulations, focusing on structural dynamics and thermodynamics, utilized the GROMOS9643A1 force field and the SPC water model. Energy minimization was performed using a steepest-descent integrator with 5000 steps. System equilibration and MD runs were conducted with NVD/NPT conditions, at 300 K temperature, 1 atm pressure, using a Leap-frog MD integrator, with a simulation duration of 50 000 ps (50 ns) and approximately 1000 frames per simulation. Root Mean Square Deviation (RMSD) and Root Mean Square Fluctuation (RMSF) of the protein residues were analyzed, along with calculations of the Radius of Gyration (Rg) for structural compactness, Solvent-Accessible Surface Area (SASA), and the average number of hydrogen bonds per frame over time. Additionally, the collective motions of the predicted protein models were examined through Normal Mode Analysis (NMA) in torsional space using the iMods server (https://imods.iqf.csic.es/), which maintained stereochemistry, performed vibrational analysis, and analyzed morphing trajectories to rapidly characterize potential conformational changes. Furthermore, the WAXSiS automated server (https://waxsis.uni-saarland.de/) was used to compute Small- and Wide-Angle X-ray Scattering (SAXS/WAXS, or SWAXS) curves for the 3D protein models in solution. These calculations were based on explicit-solvent all-atom MD simulations conducted with YASARA, typically lasting between 15 and 250 picoseconds. The protein model was placed in a cuboid simulation box filled with explicit water and counter ions, with protein atoms described by the AMBER03 force field and the TIP3P water model. Following energy minimization, a short MD simulation was carried out. After the simulation, a spatial envelope including the biomolecule and its solvation shell within 7 Å of the biomolecule atoms was constructed. The excluded-solvent scattering was computed based on a prior pure-water simulation, and all frames were used for the subsequent SAXS/WAXS curve calculation.
Measuring the HIF1A protein levels in Bangladeshi BC patients using ELISA
Blood samples from both BC patients and healthy controls were collected into K2-EDTA vacuum tubes (BD, Franklin Lakes, USA) and plasma was separated after overnight incubation. The HIF1A protein expression in both cases and controls plasma was evaluated using the HIF1A ELISA (Enzyme-Linked Immunosorbent Assay) kit (Invitrogen™, Thermo Fisher Scientific, Austria). All the reagents and samples were incubated at room temperature for an hour. Then 50 μl of the samples/ standard was added into each antibody pre-coated well of the ELISA plate (except the blank), covered carefully with the supplied adhesive plate covers and incubated for 2 hours. After the incubation period, the wells were washed carefully using wash buffer 3 times and then 50 μl of Biotinylated antibody reagent was added into each well and further incubated for an hour. Then following washing each well properly, 50 μl of Streptavidin HRP solution was added and incubated for 30 minutes. Again, after washing the wells properly, 100 μl of TMB substrate was added into each well, and incubated for 30 minutes, followed by adding 100 μl of stop solutions into each well. Then the absorbance were taken at 450 nm using a multi-plate reader spectrophotometer (Multiskan FC photometer, Thermo Fisher Scientific, UK) and the HIF1A protein levels were evaluated using a standard curve.
Breast cancer genomic analysis using TCGA breast invasive carcinoma dataset
Breast cancer dataset selection and pre-processing: In this study, The Cancer Genome Atlas (TCGA) breast invasive carcinoma dataset (TCGA, PanCancer Atlas) containing 1084 samples was selected for further investigation. The multidimensional breast cancer genomics data of the selected study was retrieved using the cBio Cancer Genomics Portal (cBioportal; http://www.cbioportal.org).30-38 The inclusion criteria of the selected TCGA BC dataset were: a case-control study including females, availability of patients’ ethnicity, clinical, and subtypes data. The 1084 patient/case dataset of the selected study was then screened based on altered/varied expression of the Hugo gene symbol HIF1A. The responsive dataset was further screened based on having genomic altered expressions (mutations, structural variants, and putative copy number alterations) from GISTIC (Genomic Identification of Significant Targets in Cancer) and only HIF1A mRNA expression samples with z-scores (threshold ± 2.0) of tumor samples in comparison to adjacent normal samples (RNA Seq V2 RSEM), and protein expression in the cohort, measured by reverse-phase protein array (RPPA) with a z-score threshold of ±2, was retrieved. Only the responsive dataset with a minimum of 2-fold up or down-regulation values of the HIF1A expression, in comparison to controls, was then selected.30-38 Thus, finally, only 37% of the patients’ data of the selected study (TCGA, PanCancer Atlas), which met all the screening criteria, were used for further genomic profiling and correlation analyses.
Assessment of changes in Transcriptomic mRNA expression of HIF1A in BC: The HIF1A gene altered transcript (mRNA) expression, for breast cancer patients and normal samples were extracted and analyzed using cBioPortal (http://www.cbioportal.org) and ULCAN (https://ualcan.path.uab.edu/analysis.html) data portals.32-36,39 The multi-omics data of mutations, structural variants, fraction genome alterations, copy number variations, co-expressions, protein expression, comparison, enrichment, and survival analysis were extracted and analyzed using cBioPortal. The different mutation types of HIF1A in TCGA breast cancer samples were detected through the DepMap (https://depmap.org/portal/) portal. 40 The BC patients’ data stratified based on race categories, and breast cancer subtypes of the HIF1A gene were extracted from cBioPortal. The correlation between the 2 variables was analyzed using Spearman’s or Pearson’s test and a P-value < .05 was considered significant. All analysis was conducted and evaluated strictly following the cBioPortal guidelines. The expression variations of HIF1A among different race categories and subtypes were analyzed using UALCAN data portal. The GTex portal (https://gtexportal.org/home/snp/) was used to determine the risk frequency of HIF1A polymorphisms in different tissues. 41 For the selected TCGA BC patient clinical data analysis, like patient’s age, sex, tumor stage, breast cancer subtype, and race was evaluated using the OncoPrint in cBioPortal. Co-expression between the HIF1A gene in TCGA BC samples and tumor markers like ER (Estrogen receptor), PR (Progesterone Receptor), and HER2 (Human Epidermal growth factor Receptor 2) was conducted using the GTEx, GEPIA2 42 and cBioPortal. Pearson’s and Spearman’s correlation coefficients were calculated against all other genes and a P-value < .05 indicated the statistical significance. Also, mutual exclusivity analyses were performed for ER, and HIF1A, where Fisher’s exact test was used to analyze whether alterations are significantly mutually exclusive or co-occurring between every pair of query genes, and a P-value < .05 was considered significant using cBioPortal.30-36 Gene Ontology (GO) enrichment and gene set enrichment analysis (GSEA) were performed to explore the relevant pathways involved with HIF1A in BC. The ClinOmics Trail database (https://clinomicstrail.bioinf.unisb.de/) was used to conduct enrichment analyses of the pathway activities by the HIF1A gene in the selected TCGA breast cancer dataset. 43 GO enrichment contains molecular function (MF), cellular component (CC), and biological process (BP). P < .05, and FDR < 0.25 are defined as significantly enriched. 43 In this study, the Kaplan-Meier (KM) plot, log-rank test, and Cox regression analysis were used for survival analyses. 44 The overall survival analysis was conducted based on the low and high HIF1A mRNA expression of breast cancer patients using KM-Plotter (https://kmplot.com/analysis/). 44 The KM Plotter was used for the validation of the HIF1A as a survival biomarker. The statistical significance between the survival curves was analyzed using the log-rank test, and a P-value < .05 was considered statistically significant. 44
Analysis of HIF1A gene mutation and methylation level in TCGA BC: The DNA methylation pattern of the selected TCGA breast cancer patients was extracted and evaluated using cBioPortal (http://www.cbioportal.org).30-33 The mean methylation pattern of HIF1A in normal, as well as tumor samples of the selected TCGA Breast invasive carcinoma, was evaluated using different probes of TCGA-Wanderer (http://maplab.imppc.org/wanderer/). 45 TCGA-Wanderer provided the level 3 TCGA methylation arrays (450k Infinium chip) and expression data (Illumina HiSeq RNAseq, summarized by exons and genes) to analyze the HIF1A expression and levels of methylation of the breast cancer samples. 44 The adjusted P-value threshold < .05 indicated was considered statistically significant. Also, MethSurv (https://biit.cs.ut.ee/methsurv/) was used to perform multivariable survival analysis using methylation data of TCGA breast cancer. 46 The statistical significance of the survival curves was evaluated using the log-rank test, and a P-value < .05 was considered statistically significant.
Correlation between hypoxia and HIF1A expression in TCGA BC patients: The differential expression of the HIF1A gene between cases compared to controls of the TCGA BC dataset was evaluated to measure hypoxia using 3 different score-based approaches: including Buffo hypoxia, Ragnum hypoxia, and Winter hypoxia47-49 from cBioportal, (http://www.cbioportal.org/). Pearson correlation coefficient was used for correlation analysis. A 2-sided P-value < .05 was considered as statistically significant. The levels of HIF1A expression in BC cases were further stratified based on race and BC subtype categories were evaluated using the Buffo hypoxic score. 47 Group differences analysis was performed using Wilcoxon test or Kruskal–Wallis test, and expressed as means ± standard deviation (SD). Also, Pearson correlation analysis between HIF1A expression and methylation of the TCGA BC dataset was evaluated using Buffo hypoxia score using cBioPortal.30-33,47
Correlation of HIF1A expression and immune regulators TMB and MSI: The Tumor Mutational Burden (TMB) and Micro Satellite Instability (MSI) are 2 emerging promising, predictive biomarkers for immunotherapy in cancer treatment. 50 Correlation between altered HIF1A gene expression and mutation in BC and immune regulators TMB and MSI evaluation were conducted using the cBioPortal.30-33,50-53 TMB is considered high if it exceeds a predetermined threshold, this cut-off may widely vary based on differing factors, including tumor type and usually 10 muts/Mb cut-off where used when analyzing different solid tumors.53,54 In cases of high values, TMB is a predictive biomarker, potentially indicating a high rate of response to immunotherapy. 55 In BC patients’ correlation between HIF1A altered expression and TMB, MSI was evaluated together with hypoxia score using cBioPortal.30-33,47,50-53 Spearman and Pearson correlation analysis was conducted to investigate the correlation between HIF1A expression in TCGA BC patients and TMB, MSI, a P-value < .05 indicated the statistical significance.
Association of HIF1A expression and Immune cell Infiltration in Breast cancer: The relationship between differences in HIF1A expression in TCGA breast cancer patients and levels of immune infiltration was analyzed through the Tumor Immune Estimation Resource (TIMER, https://cistrome.shinyapps.io/timer/).56,57 The differential somatic copy number alterations (SCNA) of HIF1A gene in breast tumor and adjacent normal tissues was compared and the association between SCNA and immune infiltrates was evaluated as defined by GISTIC 2.0 using TIMER.34-36,56,57 TIMER uses the 2-sided Wilcoxon test to statistically evaluate, and a P-value < .05 was considered significant.56,57
Statistical analysis
All data were analyzed using SPSS Statistics 20 (Version 27.0. Armonk, NY: IBM Corp.2020), and Microsoft Excel (2013). The number of participants was presented as a whole number, percentage, and average ± standard deviation. Chi-square test and ANOVA were performed and a P-value less than .05 was considered statistically significant. A 2-sided P-value of <.05 was considered statistically significant.
Results
Genotyping and evaluating Bangladeshi BC study participants through statistical and Bioinformatics analysis
The DNA sequencing data for the HIF1A gene polymorphisms, rs11549465 (C > T) and rs11549467 (G > A), in Bangladeshi BC patients (cases) and healthy controls were analyzed through the BLAST sequence alignment tool (https://blast.ncbi.nlm.nih.gov/Blast.cgi). Mutations were assessed using the dbSNP database (https://www.ncbi.nlm.nih.gov/snp/; Figure 1). The genotyping and distribution of allele frequencies for rs11549465 and rs11549467 single nucleotide polymorphisms (SNPs) in Bangladeshi BC cases and healthy controls were statistically evaluated using the chi-square test (Table 1A). Additionally, a regression analysis was performed to assess genetic variations across different models. The analyzed data for rs11549465 (C > T) polymorphism revealed a significant association of the rs11549465 (C > T) SNP across all comparison models: Dominant (CT + TT vs CC: OR 3.30, 95% CI = 1.73-6.30; P-value < .001); Recessive (TT vs CC + CT: OR 2.24, 95% CI = 1.16-4.34; P-value .016); Allele (T vs C: OR 2.79, 95% CI = 1.46-5.35; P-value .002); Homozygote (TT vs CC: OR 2.59, 95% CI = 1.33-5.04; P-value .005); and Heterozygote (CT vs CC: OR 14.07, 95% CI = 1.75-112.9; P-value .013; Table 1B). Hence, the analyzed data indicated a robust connection between the variant T allele and a heightened susceptibility to BC (Table 1). However, no such association was observed for the HIF1A rs11549467 (G > A) polymorphism (Table 1).
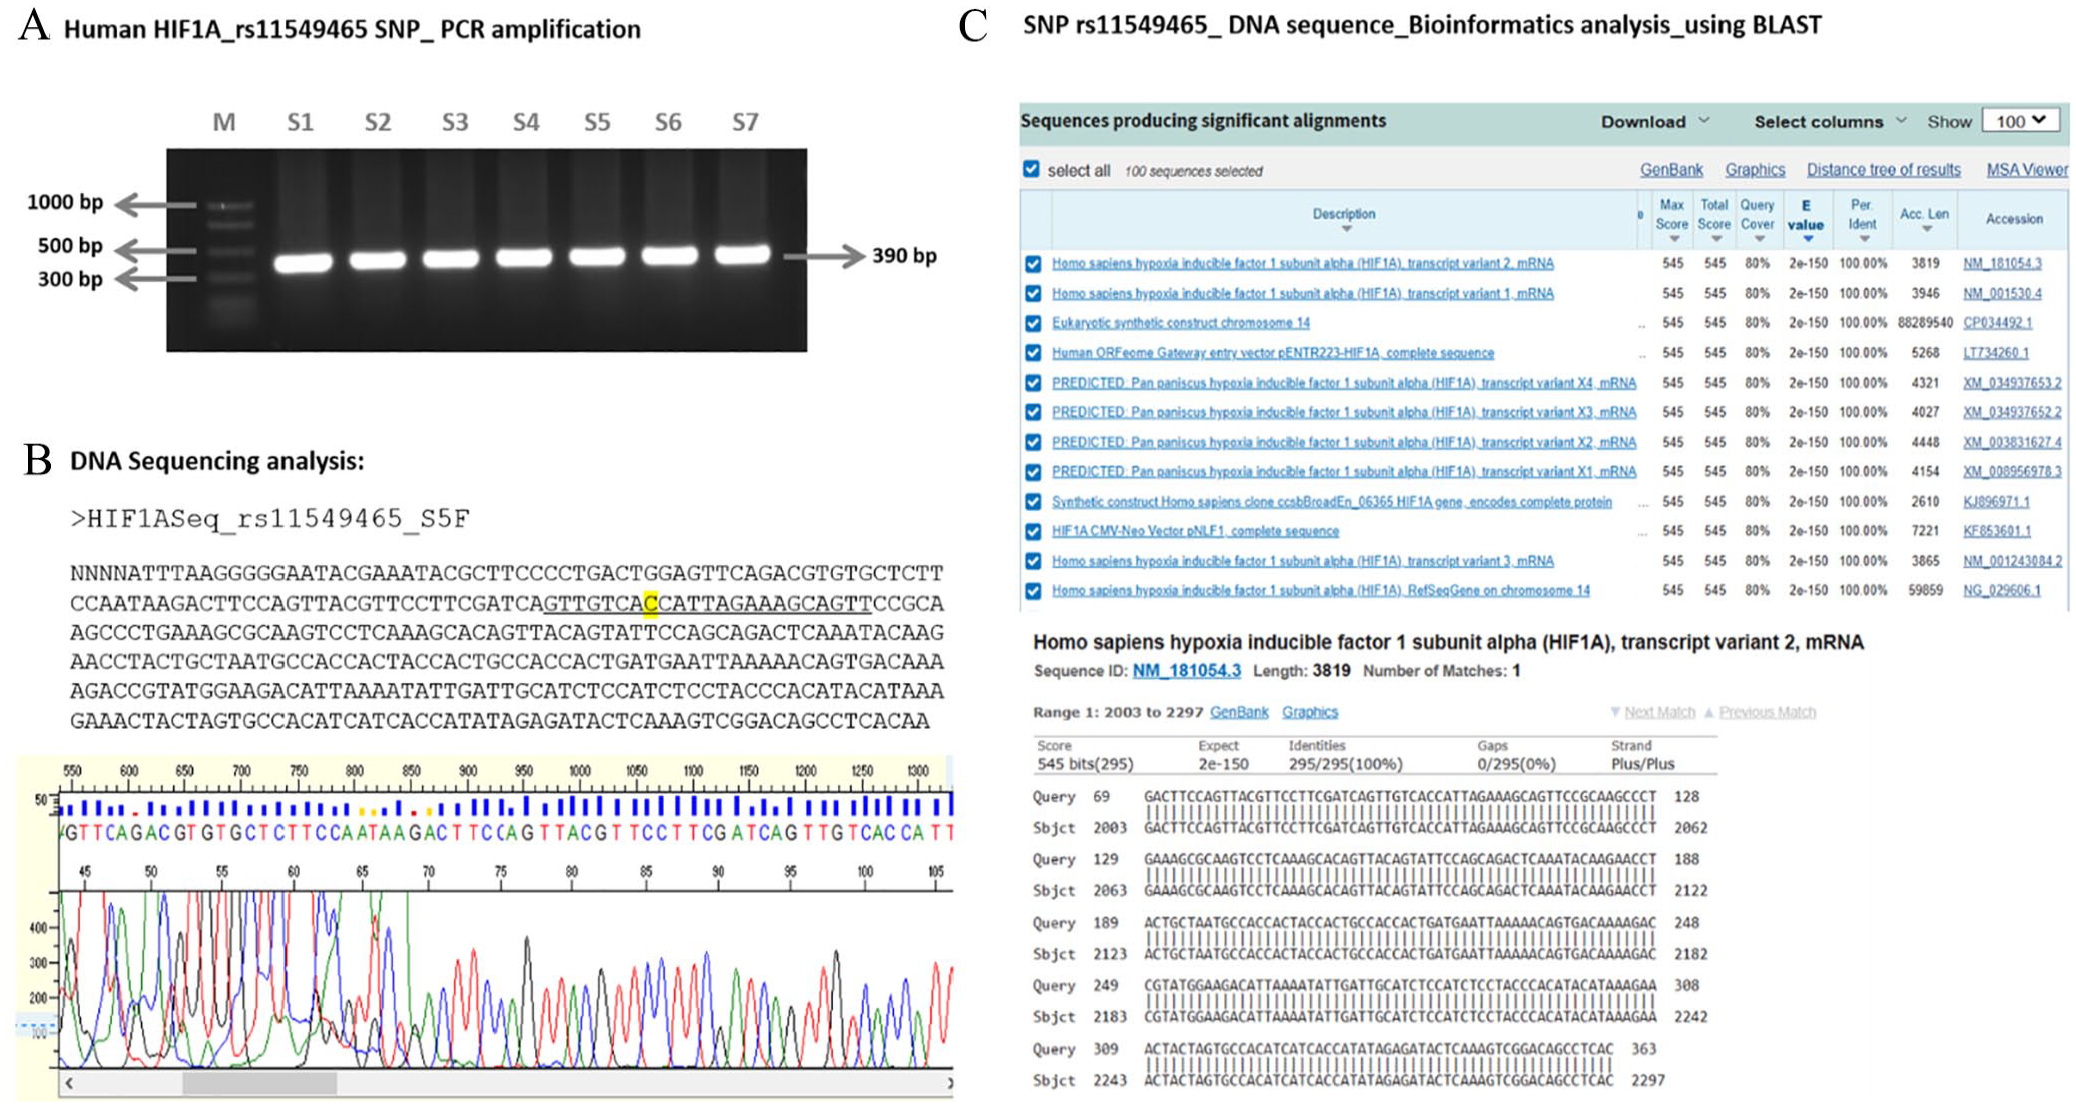
Genotyping the HIF1A gene SNP_rs11549465 DNA sequence and Bioinformatics analysis of the Bangladeshi BC cases. (A) PCR amplification. M: 100 bp PCR marker; S1-S7: PCR products of HIF1A gene amplification for BC samples. (B) DNA sequencing analysis; (C) BLASTn analysis of the sequenced BC sample DNA.
Genotyping and allele frequency distribution of the HIF1A gene SNPs (rs11549465 and rs11549467) analysis data of Bangladeshi BC cases.

Data are expressed as numbers (%), P-value was determined by the regression test. The odds ratios were calculated by taking the percentage values of the case and control number. The zero was adjusted. The P-value < .05 is considered significant.
Since the participant count in our case-control study on BC in Bangladesh was relatively low, we analyzed linkage disequilibrium (LD), and examined the allele frequencies of the HIF1A gene variants rs11549465 and rs11549467 in various populations sourced from the 1000 Genomes Phase 3 dataset (Table 2; Figure 2). Bioinformatics analysis of the HIF1A rs11549465 C/T and rs11549467 G/A polymorphisms were conducted for allele frequency and linkage disequilibrium (LD) data. The correlation (r2) and LD coefficient values revealed that these 2 missense mutations exhibited complete LD and had not undergone recombination (Table 2). In the case of the rs11549465 polymorphism, alterations in motifs (CDP, Pou5f1) were observed, while no such effects were noted for the rs11549467 polymorphism (Table 2). Additionally, we conducted a comparison between the assessed Minor Allele Frequency (MAF) of the HIF1A rs11549465 polymorphism in Bangladeshi breast cancer cases and controls with allele frequency information sourced from the 1000 Genomes Phase 3 (Figure 2). The allele frequency data for the HIF1A gene rs11549465 polymorphism were analyzed across various race categories (Asian, Black, and White), Asian sub-categories (Asian, South Asians, and East Asians), and specific Asian countries (Bangladesh, India, Pakistan, Sri Lanka, China, Japan, and Vietnam), extracted from the 1000 Genomes Project. Examination of the rs11549465 SNP revealed that the minor T allele frequencies in White, Black, and Asian populations were 10%, 6.2%, and 8.2%, respectively (Figure 2A). In the breakdown of Asian subcategories, South Asians exhibited a higher Minor Allele Frequency (MAF) at 11.9%, surpassing the 4.6% observed in East Asians (Figure 2B).
Linkage disequilibrium (LD) analysis of the HIF1A gene rs11549465 and rs11549467 polymorphisms from 1000 Genome project phase 3.

Race category: AFR: African; AMR: American; ASN: Asian.

The Minor Allele Frequency (MAF) for the HIF1A rs11549465 polymorphism from the 1000 Genomes Phase 3 dataset. (A) Race wise. (B) Asian sub-category wise. (C) Asian countrywide. *The frequency of the C allele or T allele both in BD BC patients and control groups of Bangladeshi women from this study. (D) GTEx multi-tissue eQTLs meta-analyses data showing the association between the risk frequency of rs11549465C T allele and HIF1A in breast mammary tissue from the TCGA database.
When examining the 1000 Genomes data across Asian countries, the MAF values for India (12.9%), Pakistan (12.0%), Sri Lanka (9.8%), and Bangladesh (9.3%) were notably higher than those for Vietnam (7.1%), China (4.0%), and Japan (3.9%; Figure 2C). For a more thorough investigation, we compared the Minor Allele Frequency (MAF) data obtained from this study for Bangladeshi breast cancer cases and controls with the information derived from the 1000 Genomes sequencing. This analysis revealed an altered allele frequency of 38.0% for Bangladeshi breast cancer cases and 18.0% for controls (Figure 2C). The analysis of data from the 1000 Genomes project revealed variations in the frequency of the minor T allele of rs11549465 across different race categories. Furthermore, a significant disparity in the T allele frequency was evident between South and East Asians. When we compared our evaluated Bangladeshi BC patients with healthy controls, the association of the minor T allele frequency with BC was markedly more pronounced. Collectively, the comparison data of mutant T allele frequencies suggested notable variations in the HIF1A rs11549465 polymorphism among diverse global populations, emphasizing the need for further assessment to establish its correlation with breast cancer susceptibility (Figure 2). To assess the global impact of the rs11549465 (C/T) polymorphism on HIF1A expression and its potential link to breast cancer risk, we conducted a comprehensive analysis using data from the Genotype-Tissue Expression (GTEx; https://gtexportal.org/home/; Figure 2D). The resulting plot illustrates the slope of the linear regression derived from normalized expression data in individual tissues’ expression quantitative trait locus (eQTL) analyses. Our findings revealed a robust correlation between the rs11549465(C/T) polymorphism and HIF1A expression across diverse tissues (Meta-Analysis RE2 P-value: 2.85e-35). Specifically, the minor T allele of the rs11549465 polymorphism exhibited significantly elevated HIF1A expression in breast mammary tissue (P-value .009; Figure 2D). This observation implies a potential association of rs11549465(C > T) with the tissue-specific regulation of HIF1A expression.
Bioinformatics tools I-Mutant, Consurf, SNAP2, and NetSurfP-3, were utilized to assess the structural and functional consequences of the mutations at HIF1A rs11549465 (C/T) and rs11549467 (G/A). I-Mutant (https://folding.biofold.org/i-mutant/i-mutant2.0.html) analyzed data shown, the changes in free energy (DDG value) for the mutations at rs11549465 (P582S) and rs11549467 (A588T) were −1.24 kcal/mole and -0.37 Kcal/mole, respectively. This implies that both variations are likely to result in a decrease in protein stability (Table 3). The data analyzed using Consurf (https://consurf.tau.ac.il/consurfindex.php) yielded conservation scores of 4 and 2 for the rs11549465 and rs11549467 polymorphisms, respectively. This indicated that both mutants are likely to be structurally exposed at their respective positions (Table 3). The functional scores assigned by the SNAP2 tool (https://rostlab.org/services/snap2web/) for the rs11549465 and rs11549467 polymorphisms were 13 and −54, respectively. These scores suggest that the rs11549465(C/T) polymorphism is likely to induce a significant alteration, while the rs11549467 (G/A) variant is expected to have a neutral effect (Table 3). Additionally, we assessed the surface accessibility of these 2 polymorphisms using NetSurfP3 (https://dtu.biolib.com/NetSurfP-3/), and the findings suggested that both variants led to overall structural disorders (97% and 99%; Table 4). Nevertheless, the relative surface accessibility (RSA) for the rs11549465 and rs11549467 polymorphisms was 62% and 59%, respectively, and the absolute surface accessibility (ASA) evaluation yielded values of 98% and 76%. This indicates that the rs11549465 variant was more exposed than the rs11549467 variant (Table 4). In summary, the bioinformatics analyses strongly suggest that the rs11549465(C > T) variant induces a more significant structural alterations, affecting protein stability and potentially leading to functional impairment of the HIF1A gene (Table 4).
Bioinformatics analysis of the HIF1A SNPs (rs11549465, and rs11549467) structural-functional properties.

DDG < −0.5: large decrease of stability.
Surface accessibility prediction of HIF1A variants.

At pH 7.0 and 25°C.
Functional analysis of the HIF1A protein through Protein-protein interactions (PPI) network
To understand the functional connections and regulatory pathways of HIF1A expression, we generated a protein-protein interactions (PPI) network using the STRING database (https://string-db.org/). We examined the shortest paths of connections from hypoxia-related proteins to BC progression and pinpointed the central hub proteins responsible for spreading throughout the protein-protein interactome (PPI) network. Furthermore, we identified the top spreaders, which are highly connected hub proteins interacting with HIF1A (like STAT3, MDM2, SMAD3, MAPK3, CDK1, RELA, AKT1, TP53, HIF1AN, EP300, CREBBP, VHL, TCEB2, SRC, MYC, GSK3B, SP1, PRKACA, ESR1, MAPK1 etc.; Figure 3A). The assessment of the topological degree and betweenness of hub proteins within the created PPI network was conducted using Konnect2prot (k2p; https://konnect2prot.thsti.in/; Figure 3B; Supplemental File 1, Table T1). Through the analysis of shortest paths, several routes for the dissemination of metastasis and angiogenesis from hypoxic proteins were identified. Collectively, a PPI network comprising functional partners of HIF1A was established, featuring a high confidence score of 0.999. The average node degree was 7.09, the average local clustering coefficient was 0.813, and the PPI enrichment P-value was <.001 (Figure 3A). To gain a deeper insight into the regulation and biological functions of primary interacting partners, as well as to pinpoint key mutation genes, we conducted functional pathways enrichment analyses (Figure 3C). The P-values for the enrichment analysis were derived from the hypergeometric distribution. After applying the Benjamini-Hochberg correction for multiple testing, the most significantly enriched signaling pathways, based on log10(FDR) fold enrichment, encompassed HIF-1, resistance to EGFR tyrosine kinase inhibitors, insulin resistance, focal adhesion, adherens junction, thyroid hormone, estrogen, AGE-RAGE, JAK-STAT, Wnt, and PI3K-Akt (Figure 3C; Supplemental File 1, Table T2). Notably, the top-fold enrichment in disease pathways encompassed various cancer types such as prostate, breast, endometrial, colorectal, gastric, and melanogenesis. Additionally, it included other diseases like diabetic cardiomyopathy, alcoholic liver disease, Cushing syndrome, measles, atherosclerosis, hepatitis, and pathways associated with neurodegeneration (Figure 3C). Moreover, an examination of correlation networks was conducted to analyze the connections among various hub proteins (notable spreaders), their association with signaling pathways, and disease hallmarks (Figure 3D and E; Supplemental File 1, Table T2). Additionally, the abundance interactome of HIF1A’s protein class was assessed using the k2p data portal (Figure 3F). The resulting interactome network unveiled high-confidence interactions and regulations among hypoxic and metastatic proteins.
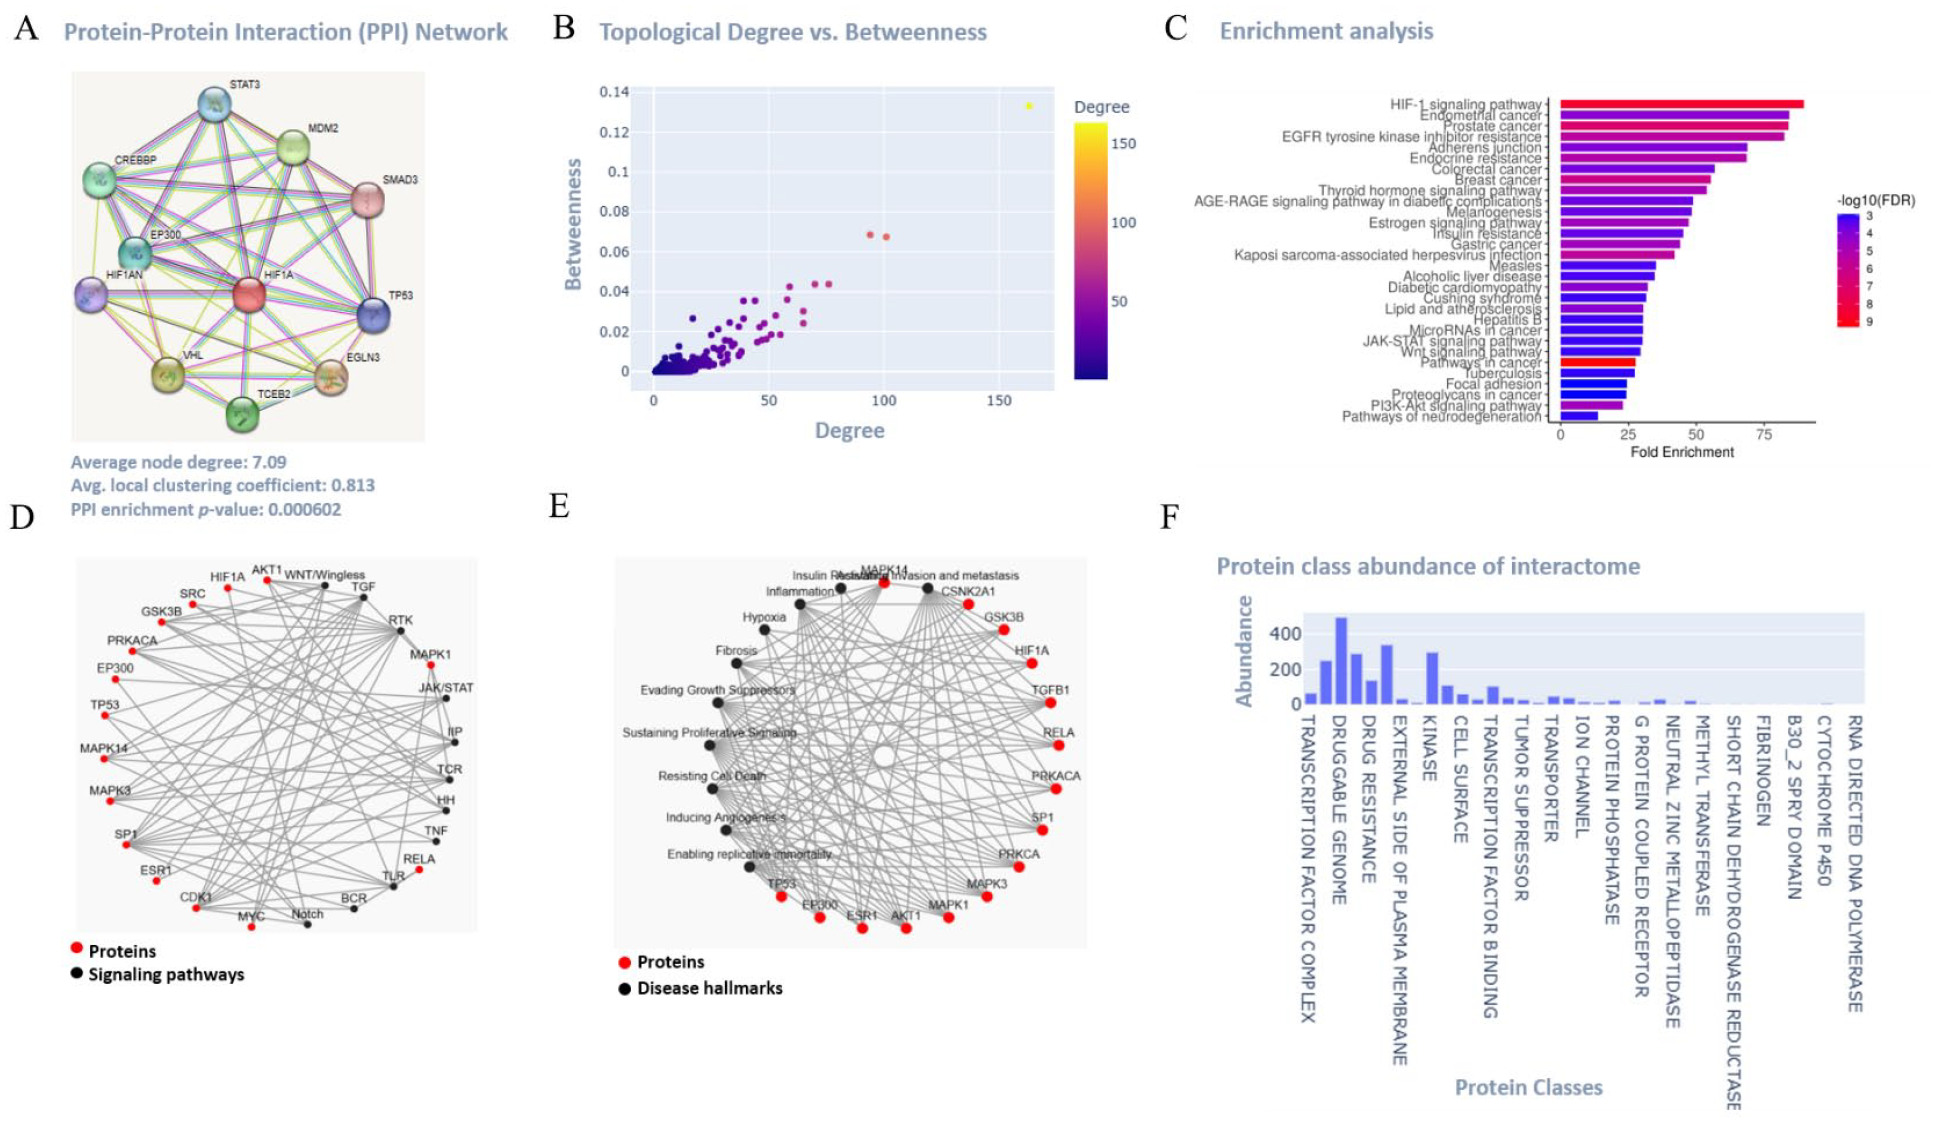
Functional analysis of the HIF1A protein using bioinformatics. (A) Protein-protein interaction (PPI) network of HIF1A. (B and C) Topological degree versus betweenness of the hubs of the predicted Protein-protein interaction (PPI) network; and Pathway Enrichment analysis exhibiting the Benjamini-Hochberg False Discovery Rate (FDR)-adjusted threshold of 0.01. (D-F) Correlation networks prediction between important hub proteins with the disease hallmarks, signaling pathways, and protein class abundance of the interactome.
Structural analysis of the HIF1A wild-type and P582S mutant proteins
HIF1A (Q16665) exhibits a high degree of conservation across various species, and its conserved domains are: the HLH (Helix-loop-helix) domain, PAS domain, HIF-1 domain, and CTAD (C-terminal transactivation domain; Figure 4A). The structured N-terminal domain, retaining the active site, facilitates DNA binding and dimerization. The PAS domain plays a vital role in ligand binding and functions as a sensor for light and oxygen in the signal transduction pathway. The HIF-1 domain, positioned at 549 to 582, regulates cellular homeostatic responses to changes in oxygen availability. In the presence of oxygen, HIF1A undergoes ubiquitination, leading to targeted proteasomal degradation. The CTAD domain, spanning 40 residues, exhibits a high degree of conservation (Supplemental File 1, Figure S1; Table 5). Variations in single nucleotide polymorphisms (SNPs) often have a notable impact on the structure and functionality of proteins. In the HIF1A protein, the missense mutation rs11549465, located at position 582, resulted in the substitution of a nonpolar, aliphatic proline residue (Pro, P) with a polar residue containing a reactive hydroxyl group, namely serine (Ser, S; Figure 4A). Although the Protein Data Bank (PDB) contains several X-ray crystallography and NMR structures primarily covering the N-terminal half of the HIF1A protein, there is a lack of structures for the C-terminal domain. Therefore, this study employed ab initio, de novo 3D modeling through Robetta.

Three dimensional homology model prediction of the HIF1A wild-type (WT) and P582S mutant (MT) proteins. (A) The domain architecture of HIF1A (RefSeq 3091; UniProt Q16665); (B and C) Ramachandran plot of the WT_HIF1A and MT_HIF1A proteins; (D and E) 3D homology models of the WT_HIF1A and MT_HIF1A; (F and G) 3D model of WT_HIF1A and the mutant showing all Pro (P) residues including the P582 position at the MT_HIF1A model, showing the amino-terminal (N-tr.) residues in yellow and the carboxyl-terminal (C-tr) in blue. (H) Superposition of the 3D structural models of the WT_HIF1A with MT_HIF1A prediction based on pair-wise structure comparison.
Conserved domains prediction of HIF1A protein (NP_001521) for 3D modeling.

3D homology modeling and Molecular dynamic (MD) simulation of HIF1A wild-type (WT) and P582S mutant (MT) proteins
The 3D structures of both wild-type HIF1A (WT_HIF1A) and P582S mutant (MT_HIF1A) proteins were predicted and analyzed using Robetta (https://robetta.bakerlab.org/) and I-TESSER (https://zhanggroup.org/I-TASSER/) servers (Figure 4). Model visualization and representation were carried out using the Discovery Studio (https://discover.3ds.com/discovery-studio-visualizer) and Swiss-PdbViewer (SPDV; https://spdbv.unil.ch/; Figure 4). Robetta was employed for the prediction of 3D coordinate models, which were validated via comparative analysis of protein domains, energy minimization, and simulations using molecular dynamics (MDS; Table 5; Figure 4). The Ramachandran analysis was carried out for the WT and MT_HIF1A proteins (Figure 4B and C). The analysis of Ramachandran plots revealed that the residues in the wild-type protein predominantly occupied the favored and allowed regions, indicating a higher level of structural integrity in WT_HIF1A exhibited the 3D protein models of the wild-type (WT_HIF1A; Figure 4D and F) and the mutant P582S (MT_HIF1A; Figure 4E and G). The substitution at position P582S, replaced the nonpolar, cyclic bend-forming amino acid at this site with a polar, nucleophilic functional group (Figure 4G). Figure 4F and G exhibited the WT and MT_HIF1A 3D models showing all Pro (P) residues, and emphasizing the regions affected by the P582 substitution. The quality and accuracy of the predicted wild-type (WT_HIF1A) and P582S mutant (MT_HIF1A) protein models were assessed by I-TESSER (Table 6) mainly focusing on identifying differences in hydrophobicity and size between the native (wild-type) and modified residue. These variations could potentially disrupt interactions with neighboring residues, ultimately influencing the overall structure and function of the proteins (Table 6; Supplemental File 1, Table T3-T5). The MT_HIF1A model presented structural drifting, confirmed by energy refinement evaluation (Figure 4E and G). We calculated root-mean-square deviation (RMSD) values for the MT model (Table 6). The value means the average distance of α-carbon backbones between mutant and wild-type models. The generated WT_HIF1A and MT_HIF1A models with an estimated RMSD values of (9.1 ± 4.6 Å) and (12.4 ± 4.3 Å) and a TM score of (0.68 ± 0.12), and (0.52 ± 0.15) respectively, indicated models were of correct topology (Figure 4B-G; Table 6). For further evaluation, the modeled mutant protein (MT_HIF1A) was superimposed on the wild-type (WT_HIF1A) protein using TM-align (https://seq2fun.dcmb.med.umich.edu//TM-align/; Figure 4H; Supplemental File 1: Table T6). The estimated RMSD values of 8.87 Å and TM score of 0.21 indicate random structural similarity (Table 7; Figure 4H). The data alignment revealed notable structural shifts within the ODD domain housing the P582S mutation. Consequently, the variance in structure between the mutant and wild-type proteins exhibited a positive correlation with the RMSD value. The presence of the P582S mutation may led to a reduction in hydrophobicity, potentially impacting the stability and intra-molecular interactions of the HIF1A protein. This, in turn, could affect the functionality of the HIF1A protein and contribute to the onset of diseases.
The quality and accuracy assessment of the wild-type (WT) and P582S mutant (MT) structure models of HIF1A by I-TESSER.

A TM-score > 0.5 indicates a model of correct topology.
Superposition of the predicted 3D structure models of the HIF1A wild-type (WT) and P582S mutant (MT) prediction based on pair-wise structural homology analysis using the TM-align algorithm.
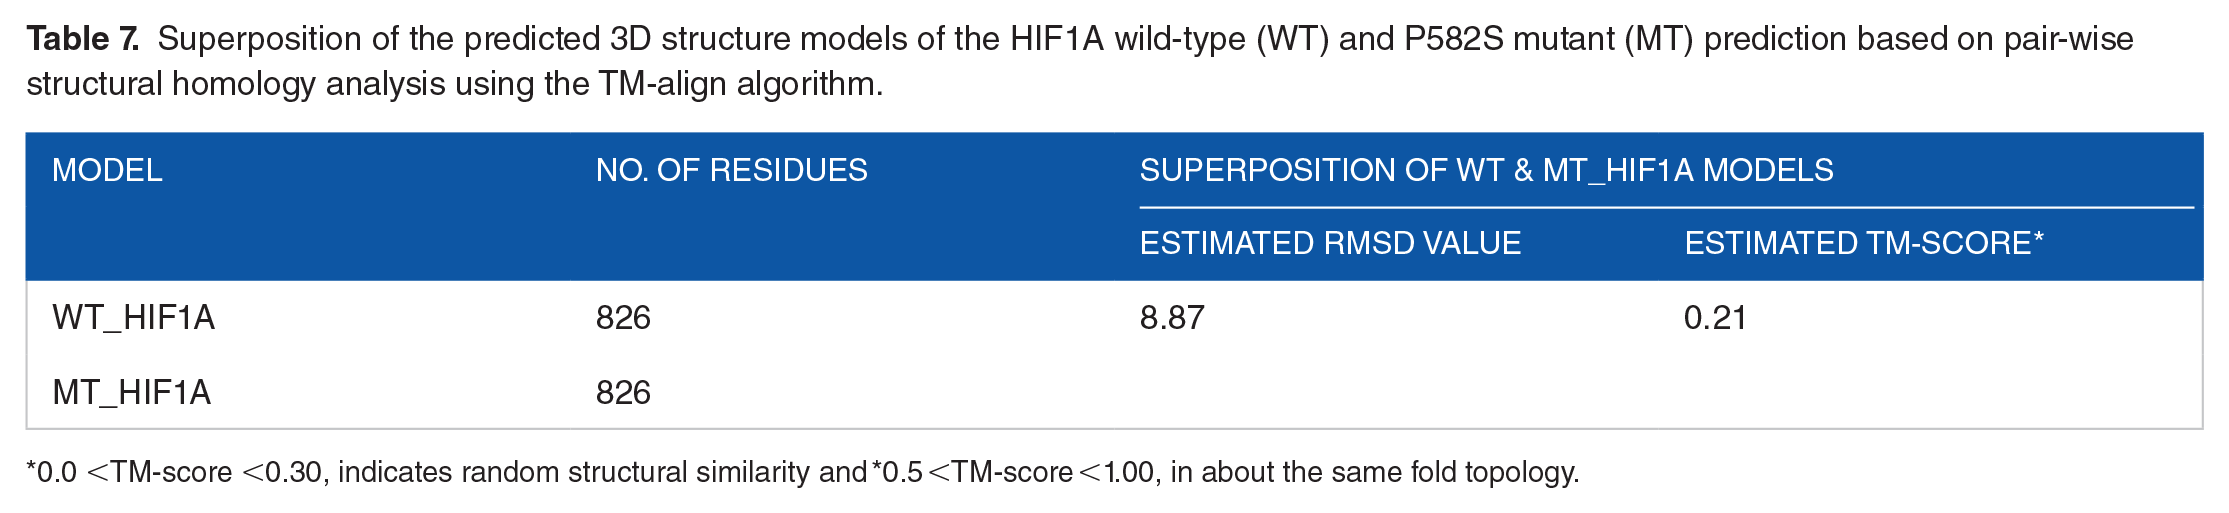
0.0 <TM-score <0.30, indicates random structural similarity and *0.5 <TM-score <1.00, in about the same fold topology.
A comprehensive computational analysis of the structural impact of the P582S mutation in the HIF1A protein was performed. Multiple simulation analyses were conducted to understand the dynamic and structural differences between the wild-type (WT) and mutant (MT) HIF1A proteins (Figure 5). Root mean square deviation (RMSD) was calculated as the average distance between the backbone atoms of the reference structure and the simulated structures (frame by frame) when superimposed. Root mean square fluctuation (RMSF) measured the standard deviation of atomic positions of each amino acid (residue) in the trajectory. The radius of gyration (Rg) assessed the structural compactness of the protein models and the radii of gyration about the x-, y-, and z-axes over time. Solvent-accessible surface area (SASA) represented the approximate surface area of the protein’s 3D model accessible to a solvent throughout the simulation time (Figure 5A and B). The B-factor/ deformability of the main chain evaluated the ability of each residue to deform. The chain “hinges” locations were derived from regions with high deformability. The experimental B-factor was taken from the corresponding PDB field, while the calculated B-factor from normal mode analysis (NMA) was obtained by multiplying the NMA mobility. The eigenvalue associated with each normal mode indicated the motion stiffness; lower eigenvalues suggested easier deformation (Figure 5C and D). The variance associated with each normal mode was inversely related to the eigenvalue, with colored bars showing individual (purple) and cumulative (green) variances. The covariance matrix indicated coupling between pairs of residues, showing correlated (red), uncorrelated (white), or anti-correlated (blue) motions (Figure 5C and D). The eigenvalues provided insights into the stability, structure, and dynamic properties of the WT and MT HIF1A proteins. The eigenvalue of the WT HIF1A model was 4.7e-05, indicating certain levels of stability and flexibility, serving as a baseline for comparison with the MT protein. The MT HIF1A had a lower eigenvalue of 1.5e-05, suggesting the mutation resulted in a less flexible protein, which could significantly impact its function by making it less dynamic in interactions or less capable of necessary conformational changes for biological activity. The elastic network model identified which pairs of atoms were connected by springs, with each dot on the graph representing a spring between corresponding atom pairs. Dots were colored according to their stiffness, the darker grays indicated stiffer springs and vice versa. Small-angle X-ray scattering (SAXS) curves based on explicit-solvent all-atom molecular dynamics (MD) simulations were computed for WT and MT HIF1A proteins (Figure 6). The MD simulations provided a realistic model for the hydration layer and excluded solvent, naturally accounting for thermal fluctuations without solvent-related fitting parameters. The Rg value over time in MD simulations revealed the protein folding process: a decrease in Rg typically signified folding, while an increase indicated unfolding. The altered Rg in the MT HIF1A mutant implied that the protein underwent changes leading to tighter folding or aggregation, resulting in a more rigid structure than the WT protein (Figure 6). This indicated that the mutations significantly impacted its structural dynamics and potentially its function. SAS, representing the protein’s accessible surface area to a solvent, is crucial as it reflects protein interactions with its surroundings. Changes in SAS indicated structural rearrangements, unfolding, or refolding events. Altered SAS in MT_HIF1A could hinder its normal function by obstructing interaction sites, affecting stability, binding site exposure, and the protein’s ability to interact with other molecules, influencing various pathways and processes. This detailed analysis helps understand how the mutation affects the protein’s structure and dynamics, potentially providing insights into its functional implications.
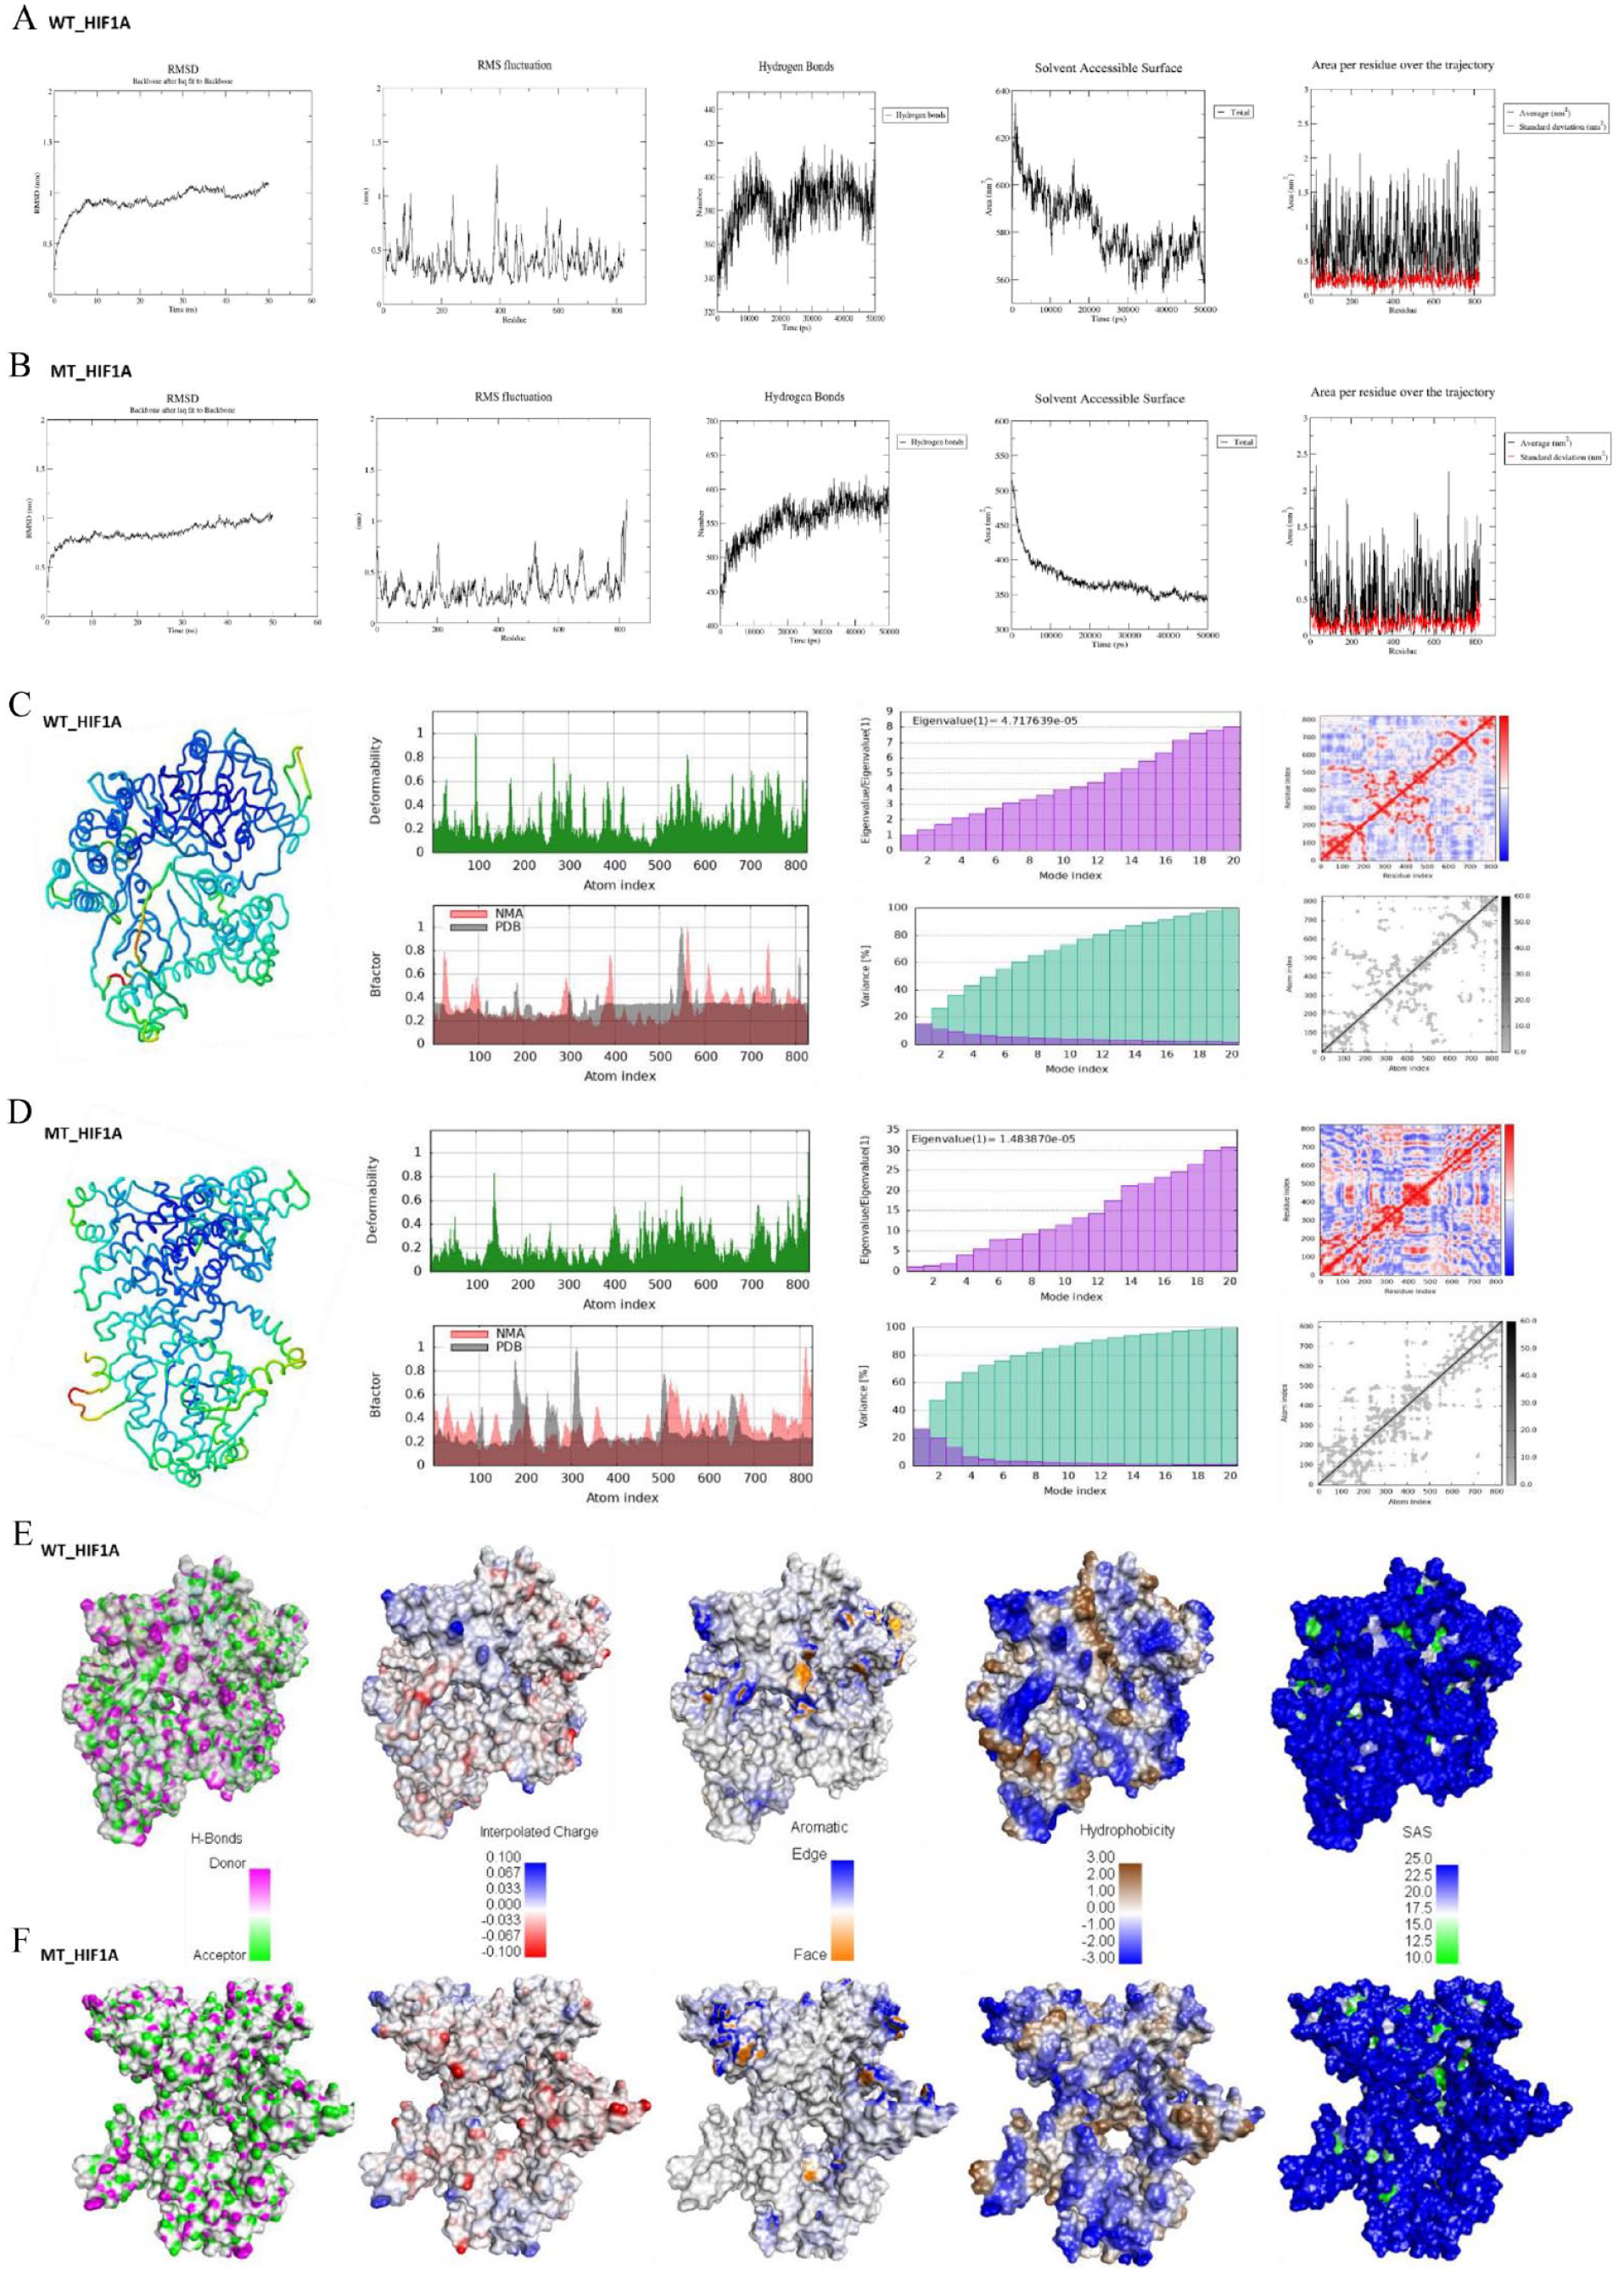
Structural implications of the P582S mutant (MT_HIF1A) compared to the wild-type (WT_HIF1A) proteins. (A and B) MD simulation data of WT and MT_HIF1A protein models showing RMSD (Root Mean Square Deviation) deviations, RMS Fluctuations, Hydrogen bonding, Solvent Accessible Surface (SAS) and Area per residue over the trajectory; (C and D) Complementary insights into the static structure, dynamic behavior, and functional capabilities of the WT and MT_HIF1A proteins through measuring B-factors, Deformability, Eigenvalues, Covariance map and Elastic network; (E and F) Structural changes induced by the P582S mutation on the HIF1A protein: showing H-bonds, interpolated charges, aromaticity, hydrophobicity and SAS.
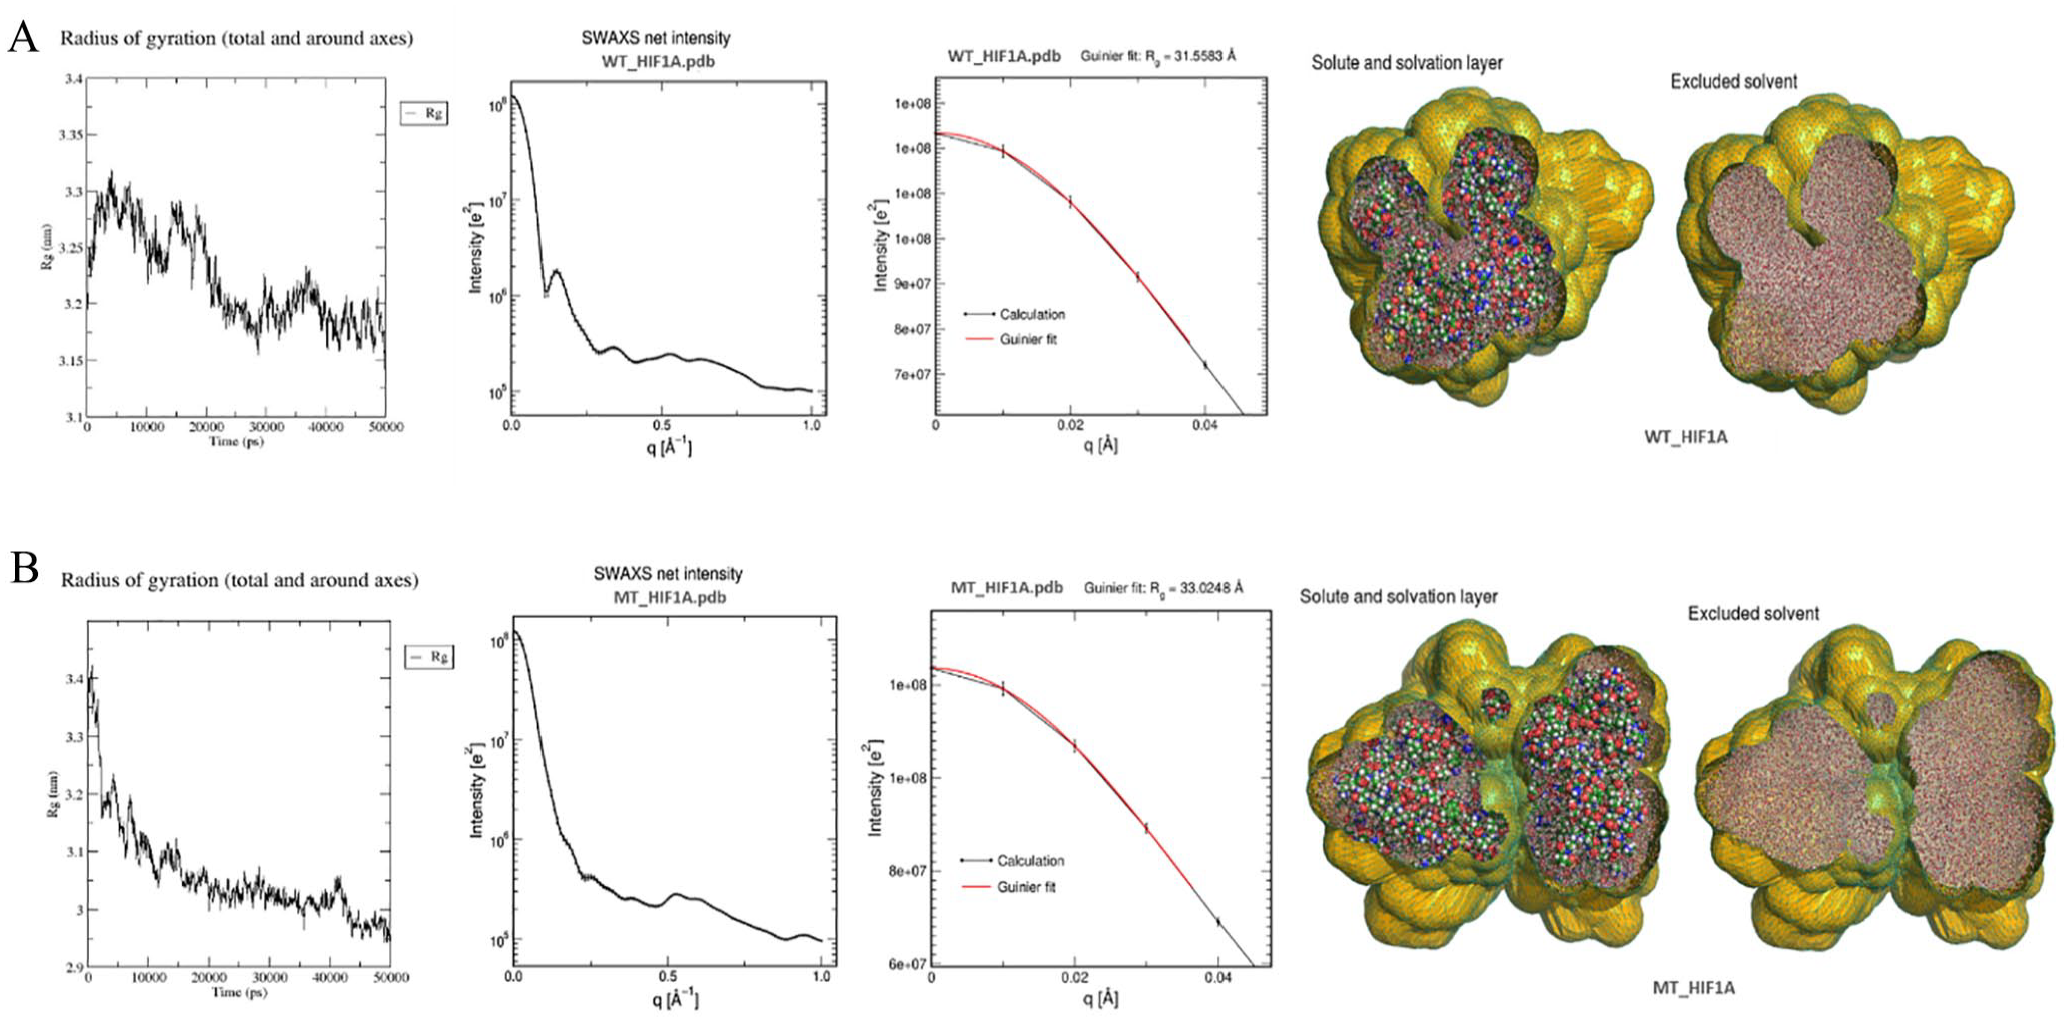
Explicit-solvent all-atom molecular dynamics (MD) simulations models for the hydration layer showing the SWAXS curves based on Radius of Gyration (Rg), SWAX net intensity and 3D models for the excluded solvent. (A) WT_HIF1A and (B) MT_HIF1A.
Assessing HIF1A protein levels in Bangladeshi BC patients and controls using ELISA
In this study, we examined samples from Bangladeshi individuals diagnosed with BC as well as control subjects. An ELISA assay was employed to measure the levels of HIF1A protein expression in plasma. The resulting line graph illustrated a significant increase in protein expression among BC cases compared to controls, with a P-value of less than .005 (Figure 7A). The HIF1A protein levels detected in BC patients and controls were 902.78 ± 381.49 pg/ml and 438 ± 148.37 pg/ml, respectively (Table 8). The evaluation employing a 2-tailed Student’s t-test unveiled a noteworthy connection (P-value of .003) between heightened HIF1A expression and occurrences of BC in the Bangladeshi population. Furthermore, the parametric one-way ANOVA test showcased a significant relationship (P-value of .004) between HIF1A protein expression levels and the prevalence of BC (Table 8; Figure 7A). Moreover, the Manhattan plot illustrating the enrichment analysis of GO: biological processes (bp) and signaling pathways enrichment analysis was conducted and the GO: BP revealed the utmost significance (FDR q-value < 0.001) concerning HIF1A levels. These included responses to diverse stresses such as endogenous and abiotic stimuli, reactions to oxygen levels, hypoxia, positive regulation of metabolic processes, as well as the regulation of apoptotic processes and programed cell death. Additionally, the most closely linked pathways encompassed HIF-1 signaling, pathways associated with various cancers such as breast, renal, prostate, pancreatic, and thyroid, along with estrogen signaling pathways and endocrine resistance, all exhibiting a Benjamini-Hochberg FDR < 0.001 (Figure 7B). Finally, we examined the interactions of small molecules with HIF1A and hypoxia by utilizing data from the Comparative Toxicogenomics Database (https://ctdbase.org/). The results highlighted that oxygen and glucose ranked among the top interactions with HIF1A (Figure 7C). Consequently, the study uncovered heightened levels of circulating HIF1A in BC patients from Bangladesh. Moreover, the enrichment analysis suggested a strong correlation between the elevated HIF1A levels in plasma and sensing oxygen and hypoxia. Consequently, circulating HIF1A levels may be regarded as a potential indicator for BC, and in the future, the ELISA procedure could emerge as a promising alternative for measuring hypoxia.
Levels of HIF1A protein expression analysis in Bangladeshi BC study participants (cases) using ELISA.

P-value <0.05 is considered significant.
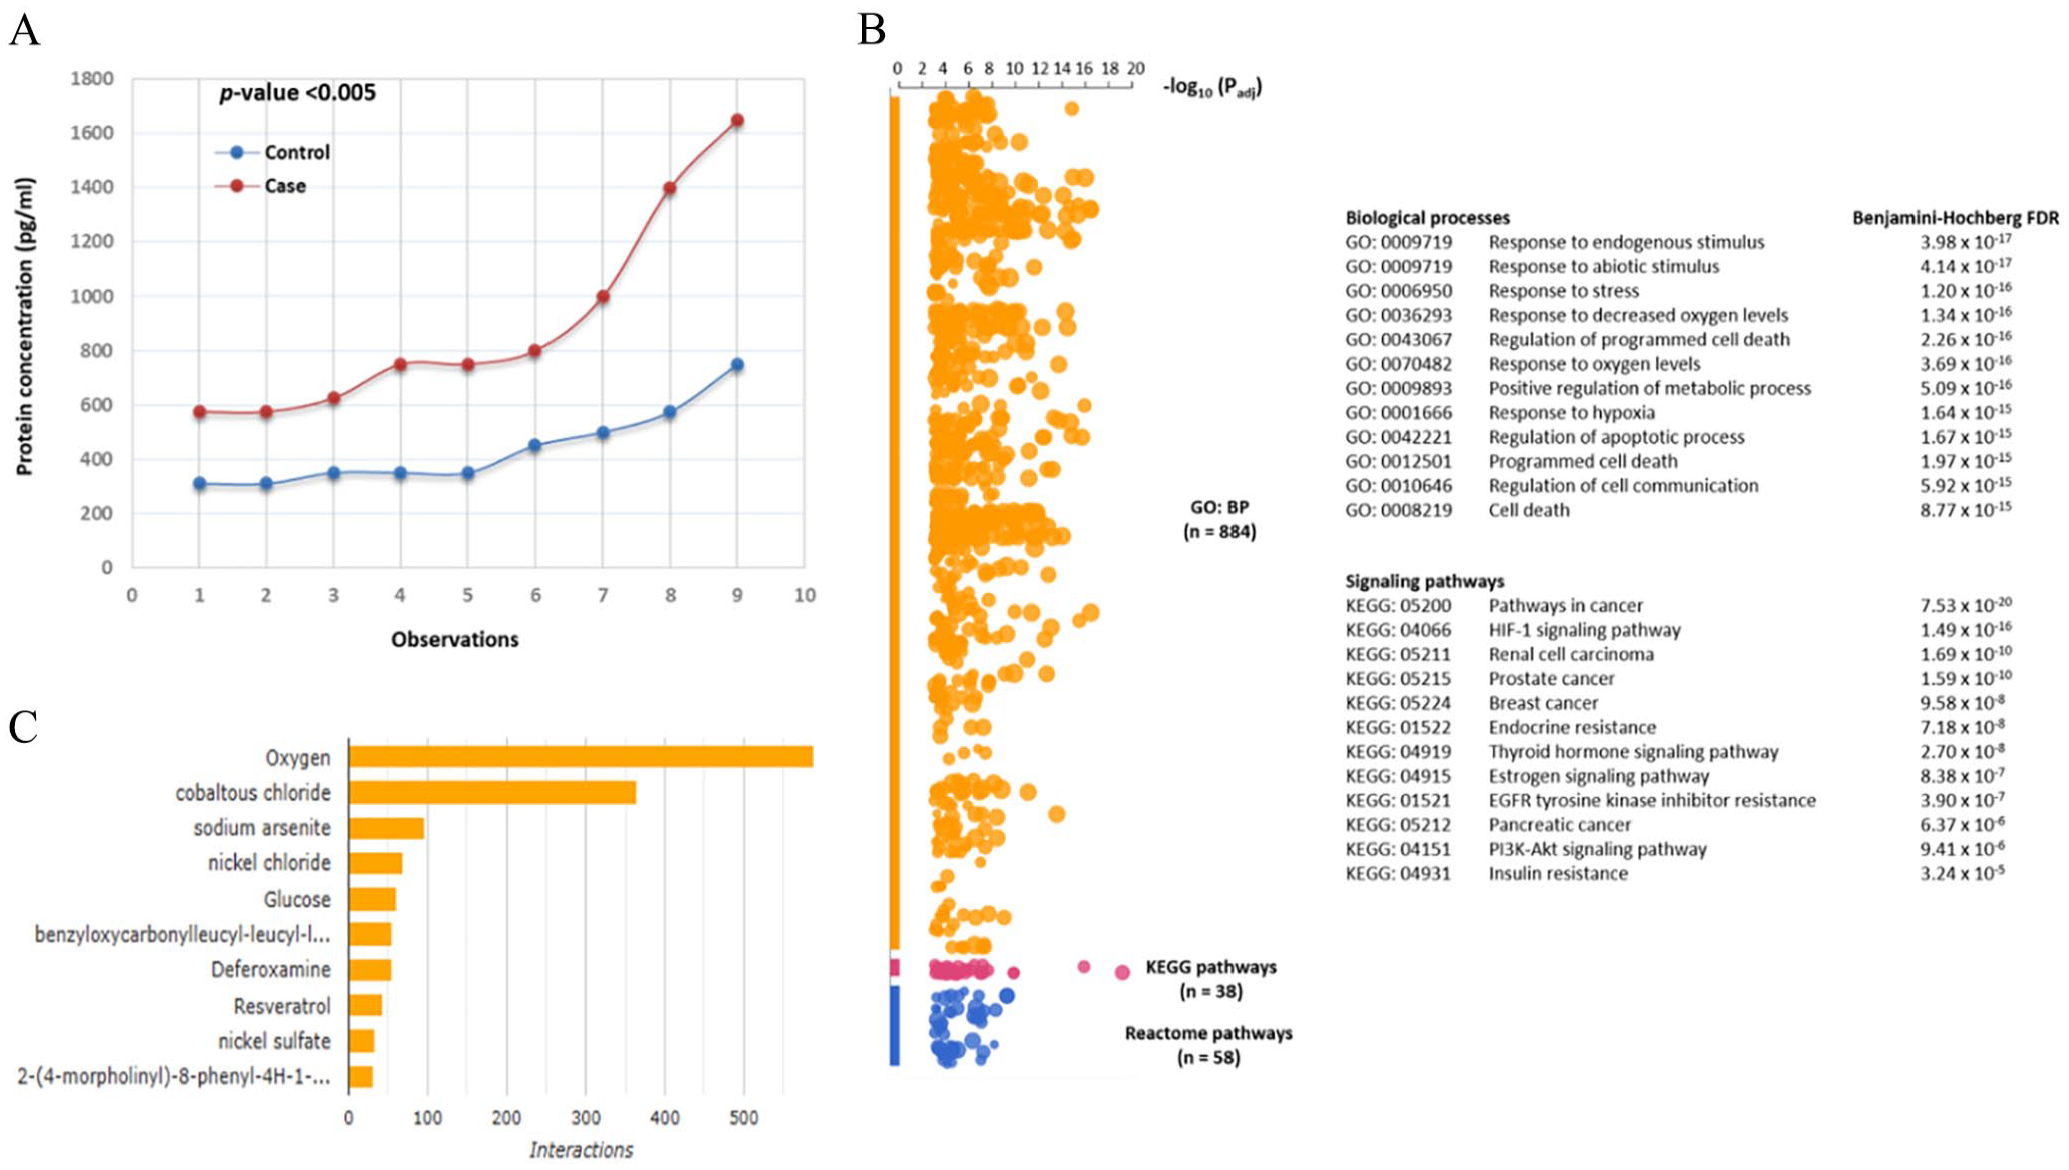
(A) ELISA analysis of HIF1A protein expression in Bangladeshi healthy controls and BC cases, showing a significant association of hypoxia with Bangladeshi BC cases (P-value < .005). (B) Functional enrichment analysis: Manhattan plot showing the most significant GO: BP related to oxygen sensing and hypoxia and the most significant signaling pathways with a Benjamini-Hochberg FDR q < .001. (C) Bar chart showing top chemicals with the most curated interactions for the HIF1A gene. The colored bars are linked to corresponding interactions for this gene.
Genomic and transcriptomic alterations of HIF1A expression in TCGA breast cancer samples
In this investigation, we scrutinized the TCGA BC dataset, comprising 1084 samples, to examine the altered genomic and transcriptomic expression levels of the HIF1A gene in individuals with BC compared to control samples using cBioportal33-36 (Figure 8). Our evaluation encompassed fraction genome alterations, copy number variations, mutation count, levels of methylation, and structure-function alterations. We also identified up and down-regulated genes associated with the differential expression of the HIF1A gene in TCGA BC patients. Additionally, we employed cBioPortal to assess clinical attributes and background data of BC patients for correlation with genomic data. Finally, the clinical outcomes of HIF1A-altered patients were examined through overall survival analysis. In summary, through integrated multi-omics analyses, this study encompassed the transcriptional landscape of the HIF1A gene’s differential expression in the TCGA BC (PanCancer Atlas) dataset (Figure 8). We performed a comprehensive examination, evaluating the mutation of the HIF1A gene in breast cancer patients from TCGA. Utilizing the cBioPortal database, our analysis through Oncoprint genomics unveiled that the expression levels of HIF1A were modified in 37% (398 out of 1084) of PanCancer BC patients (Supplemental File 1, Figure S2). Moreover, we examined copy number variations and assessed the correlation between the fraction of genome alteration and mutation count. The predominant type of HIF1A mutation was amplification (Supplemental File 1, Figure S2). Additionally, we identified genes with the highest mean frequency per genomic or transcriptomic alteration were identified (Supplemental File 1, Table S2). The bar plot examined the data on altered HIF1A transcripts levels in BC samples (cases) compared to normal samples (controls), revealing a notable distinction in HIF1A expression levels in BC cases (P-value 4.32e-05; Figure 8A). Subsequently, differential mRNA expression data from TCGA BC samples (n = 908) were scrutinized and stratified them based on various race categories. This analysis aimed to assess the frequency of HIF1A gene alterations, encompassing copy number variations, deletions, amplifications, and mutations, and was conducted using cBioPortal (Figure 8B; Supplemental File 2). The scattered plot analysis revealed a robust correlation between the fraction of altered genome and mutation count in BC samples for the HIF1A gene across various races (Spearman: R .43, P-value 1.03e-42; Pearson: R .33, P-value 7.2e-25; Figure 8B). The analysis of mutation types conducted by DepMap 40 revealed that missense mutations were the predominant alterations observed in cell lines (Figure 8C). Additionally, when examining altered HIF1A expression in breast cancer cases through race category stratified analysis, the most substantial expression variations were found in Whites (Caucasians: P-value 3.9e-06), as opposed to other races such as Blacks (Africans, P-value 8.1e-01) or Asians (P-value 1.7e-03), compared to healthy controls. Moreover, a notable difference in HIF1A expression was observed between Blacks and Asians (P-value 6.2e-04; Supplemental File 1: Table T7, Figure S3). Furthermore, a noteworthy change in the expression of HIF1A was observed between individuals of Black and Asian descent (P-value 6.2e-04; Supplemental File 1, Table T7, Figure S3). The predominant alteration associated with all cancer types is the up-regulation of mRNA transcripts. Co-variation genes related to the differential expression of HIF1A in TCGA BC samples were obtained from cBioPortal. The volcano plot, depicting high or up-regulated (n = 192) and low or down-regulated (n = 206) genes, revealed significant regulatory alterations in breast cancer cases (n = 398; P-value < .05; Figure 8D). This study analyzed the multi-omics data of TCGA_BC to assess pathway activities using the ClinOmics data portal. 43 The activity patterns of pathways in tumor samples from TCGA BC were organized and pathway activities were calculated based on the scores of differential expression. A radar chart was generated, with each radar axis representing the activity of a selected pathway (Figure 8E). The results of the enrichment analysis revealed that the signaling pathways most significantly associated with HIF1A expression were MAPK (P-value .001), Wnt (P-value .001), Notch (P-value .001), PI3-Akt (P-value .002), TGF-beta (P-value .004), NFKB (P-value .006), and HIF-1 (P-value .03). These pathways are implicated in the regulation of motility, invasion, modulation, and plasticity of the breast cancer microenvironment (Figure 8E). Finally, a Kaplan-Meier regression analysis was performed to examine the correlation between the clinical outcome and the prognosis of BC patients. The Kaplan-Meier (KM) plots depicted the overall survival analysis of the TCGA BC patients, stratified by high and low levels of HIF1A expression, revealed noteworthy differences in survival time (Hazard Ratio [HR] = 1.58, 95% CI: [1.31-1.92]; log-rank P-value 1.9e-06; Figure 8F). This outcome suggests that BC patients with elevated HIF1A expression levels experienced significantly shorter survival times compared to those with lower levels of mRNA expression (Figure 8F).

Transcriptome analysis of the HIF1A gene altered expressions on the selected case-control from TCGA BC dataset (n = 1097; TCGA PanCancer). (A) Volcano plot showing HIF1A gene expression alterations Up (n = 192) and Down (n = 206) regulation in TCGA_BC samples. (B) Box plot showing significant HIF1A gene expression alterations in breast cancer cases (HIF1A_BC) compared to healthy controls. (C) Overall Survival analysis of the up and down-regulated breast tumor samples. (D) Correlation analysis between fraction genome altered and mutation count of HIF1A gene varied expression in breast cancer cases data stratified by race category. (E) Box plot of HIF1A mRNA expression variation among different race categories. (F) Radar plot showing the association between HIF1A expressions with 20 core pathway activities in breast cancer cases compared to controls from TCGA_BC.
Correlation between DNA methylation and differential expression of HIF1A in TCGA BC
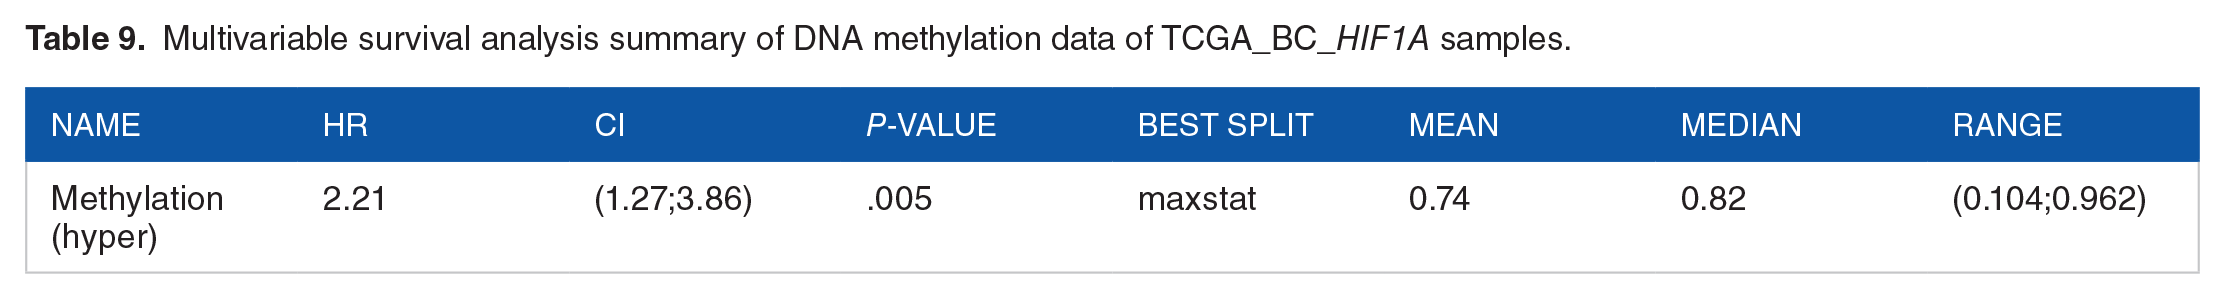
Abnormal DNA methylation plays a significant role in the development of cancer. In this investigation, we utilized the UALCAN 39 and MethSurv 46 databases to examine the extent of methylation of HIF1A in the TCGA_BC dataset. We assessed the average methylation levels of HIF1A in TCGA breast cancer samples in comparison to normal samples using various probes from the TCGA-Wanderer, 45 includ-ing cg20580088, cg07052387, cg04948941, cg13259118, cg01182555, cg08141928, cg26661257, and cg23174662. A heat map plot was generated to illustrate the methylation patterns of HIF1A in BC, considering ethnicity, race, patient age, and events (Figure 9A). The analysis revealed an aberrant DNA methylation pattern in BC samples, particularly with probes cg23174662, cg20580088, and cg07052387 (Figure 9A). The bar plots, comparing the β-value of HIF1A methylation between breast tumor samples and normal samples, revealed significant alterations (P-value 4.7e-10) in HIF1A methylation profile in BC (Figure 9B). Furthermore, the methylation patterns of the selected BC samples were stratified based on race categories and cancer stages (Figure 9C and D). The bar plot analysis indicated that the aberrant methylation pattern was most significantly associated with Caucasians (P-value 1.5e-10) compared to other race categories (Figure 9C; Supplemental file 2). Subgroup analyzed data based on breast cancer stages revealed that the most significant methylation correlates in stage 2 (P-value 5e-07) and stage 3 of BC (P-value 1.9e-05; Figure 9D; Supplemental File 1: Table T8). Ultimately, a multivariable survival analysis was carried out using MethSurv to assess the clinical outcome of BC patient prognosis. This analysis utilized the methylation probe cg23174662 to compare the levels of methylation enrichment between low and high in BC patients. Overall survival analyses were conducted through Kaplan-Meier (KM) plots, employing the log-rank test to measure the hazard ratio. The findings revealed noteworthy changes in survival associated with high methylation (HR 2.2, log-rank P-value .0018; Table 9; Figure 9E).

HIF1A expression and methylation profile of TCGA BC samples (n = 976). (A) Heat map for HIF1A methylation profile, (B-D) HIF1A promoter methylation levels in TCGA BC sample types, stratification based on patient’s race category and stages of cancer. (E) Multivariable survival analysis Kaplan Meier plot for the CpG site cg23174662 methylation data of TCGA_BRCA. *Beta value indicated the level of DNA methylation.
Multivariable survival analysis summary of DNA methylation data of TCGA_BC_HIF1A samples.
Correlation between differential HIF1A expression and hypoxia in BC
In this study, we evaluated the hypoxic condition in selected TCGA BC samples using 3 different scoring methods: Buffo hypoxia, Ragnum hypoxia, and Winter hypoxia,47-49 utilizing cBioPortal. The association between varied HIF1A expressions in BC cases was examined for each hypoxia score47-49 using Spearman and Pearson correlation coefficients. The analyzed data indicated a noteworthy correlation among the 3 hypoxia score systems (Buffo hypoxia score: Spearman: R .27, P-value 5.77e-20; Pearson: R .26, P-value 1.52e-18); (Ragnum hypoxia score: Spearman: R .30, P-value 1.45e-23, Pearson: R .28, P-value 1.41e-21); and (Winter hypoxia score: Spearman: R .26, P-value 1.03e-17, Pearson: R .26, P-value 9.76e-18 for; Figure 10A-C). Thus, the 3 scatter plots generated consistently demonstrated a robust correlation between the HIF1A gene’s differential expressions and hypoxia in TCGA BC. An analysis examining the correlation between the HIF1A fraction of genome altered and the mutation count in TCGA BC was performed, and the evaluation based on Buffo hypoxia score revealed a significant association (Spearman: R .42, P-value 4.31e-44); (Pearson: R .32, P-value 2.04e-25; Figure 10D; Supplemental File 1: Table T9). Furthermore, a stratified correlation analysis was conducted to explore the relationship between hypoxia and HIF1A mRNA expression based on racial categories, utilizing the Buffo hypoxia score for evaluation. The bar graph data indicated that the highest genome alterations were observed among Black and Asian populations compared to those in the White race category (Figure 10E; Supplemental File 1: Table T9).

Correlation analysis scatter plots of differential expression of the HIF1A gene and hypoxia in TCGA_BC samples (n = 1079). (A-C) Altered HIF1A expression in BC samples and evaluation of hypoxia score using Buffo, Ragnum and the Winter scoring approaches. (D) Fraction genome altered versus mutation count of the HIF1A gene in the selected TCGA BC samples (n = 994) and hypoxia evaluated using Buffo hypoxia score. (E) Distribution of HIF1A fraction genome altered samples (n = 994) race category wise, evaluated using Buffo hypoxia score.
Correlation between HIF1A expression and immune regulators TMB and MSI
Tumor Mutational Burden (TMB) and Micro Satellite Instability (MSI) testing represent 2 emerging immunotherapy biomarkers in cancer treatment.50-52,58 The regression analyses were performed to establish correlations between HIF1A fraction genome alteration in TCGA BC cases and the results were revealed using TMB and MSI score tests (Figure 11A and B). The analyzed data revealed a noteworthy correlation between varying HIF1A expression and TMB (Spearman: R .36, P-value 6.01e-34; Pearson: R .23, P-value 7.4e-14; Figure 11A) and MSI score (Spearman: R .61, P-value 5.76e-110; Pearson: R .46, P-value 1.22e-56) in BC cases (Figure 11B). Moreover, the bar plot analysis of the BC cases, for stratified data based on races, demonstrated that individuals of white (Caucasian) and black (African) ethnicities exhibited the most notable association with high TMB scores compared to Asians (Figure 11C). A linear correlation was also observed between the count of HIF1A mutations and TMB scores in TCGA BC patients (Spearman: R .98, P-value .00; Pearson: R 1.0, P-value .00) with the highest mutational burden present in Caucasians (Supplemental File 1: Figure S4). The findings indicated a robust connection between the HIF1A altered expression, and mutation with TMB in TCGA BC patients.

HIF1A expression and biomarkers TMB and MSI in TCGA BC. (A and B) Correlation analysis of differential HIF1A expression with TMB and MSI. (C) TMB distribution based on race category.
Correlation between HIF1A, ESR1 expression and hypoxia in BC cases
The data stratification of BC subtypes revealed a higher number of cases with estrogen receptor-positive (ER+) status (n = 694) compared to those with estrogen receptor-negative (ER-) status (n = 249) in the selected TCGA BC dataset (Figure 12A; Supplemental File 2). A correlation analysis was performed between the mRNA expression of HIF1A and the ESRI gene through cBioPortal. The results demonstrated a significant negative correlation (Spearman: R −.34, P-value 1.29e-30; Pearson: R −.33, P-value 7.9e-29; Figure 12B). Violin plots were generated to examine HIF1A expression covariate-adjusted methylation profiles, stratified by ER status through IHC and race categories (Figure 12C and D). The β-value, representing DNA methylation levels, exhibited a notable increase in the ER+ group compared to the ER-group (Figure 12C). Moreover, after accounting for covariates categorized by race, the data indicated that individuals of White ethnicity displayed the highest β-value in methylation levels in comparison to samples from other racial categories (Figure 12D). Additionally, we conducted a comparison of HIF1A fraction genome alteration levels in BC cases between ER+ and ER- subtypes. This analysis was further assessed using Buffo hypoxia score and TMB (Figure 12E and F). The examined data revealed significant alterations (P-value < 1.0e-10) between ER+ and ER- groups. Within the ER-category (specifically within HER2 and TNBC subtypes), samples exhibited heightened levels of hypoxia (Figure 12E) and TMB score (Figure 12F). This study collectively implies that within the TCGA BC cases, a higher prevalence of ER+ instances was observed in Whites and revealed heightened levels of methylation. Notably, a negative correlation was observed between the expression of HIF1A and the estrogen receptor ER gene (ESR1). The subsequent findings from the study were aligned with this correlation, hypoxia demonstrating a higher incidence of HIF1A genomic alterations within the ER- BC cases compared to the ER+ group.

Association between HIF1A altered expression by ER status and hypoxia in TCGA BC. (A) HIF1A alteration frequency data among BC subtypes. (B) Correlation between HIF1A versus ESR1 expression in BC. (C and D) Violin plots showing the HIF1A covariate-adjusted methylation profiles based on ER status by IHC and race categories. (E and F) HIF1A expression altered frequency comparison between ER+ and ER-, scoring based on Buffo and TMB demonstrating a higher incidence of genomic alterations within the ER- BC cases compared to the ER+ group.
Differential HIF1A expression and immune cell infiltration in BC
To methodically examine the correlation between varied HIF1A expression and immune response in BC samples, we employed the TIMER algorithm.56,57 This algorithm primarily assessed the presence of 6 major types of immune cells, namely CD4+ T cells, CD8+ T cells, B cells, neutrophils, macrophages, and dendritic cells. Through gene module analysis, we carried out a series of assessments on HIF1A expression and the abundance of infiltrating immune cells in BC. The infiltration levels for each category were compared to those in normal controls using a 2-sided Wilcoxon rank-sum test (Figure 13A, Supplemental File 1, Table T10). Additional correlation analysis was performed to investigate the relationship between tumor-infiltrating immune cells and the levels of HIF1A expression in TCGA_BC samples. The correlation analysis scatterplots, incorporating purity correction, revealed a notably strong positive correlation between HIF1A expression levels and the infiltration levels of immune cells, including CD8+ T cells (R .39, P-value 7.06e-37), neutrophils (R .33, P-value 7.8e-25), dendritic cells (R .29, P-value 2.3e-20), macrophages (R .28, P-value 9.9e-20), B cells (R .16, P-value 3.3e-07) and T cell CD4+ (R .16, P-value 6.9e-07; Figure 13B; Supplemental File 1, Table T11). The analysis revealed an intriguing finding, indicating the strongest correlation between infiltration levels and T cell CD8+ and neutrophils, while the weakest correlation was observed with T cell CD4+ and B cells (Figure 11B). This study’s findings imply a significant association between HIF1A expression and the infiltration of diverse immune cells in the microenvironment of BC and to immune checkpoint genes, TMB and MSI of immune regulators (Supplemental File 2).

Relationship between levels of HIF1A expression and immune cell infiltration in TCGA_BC. (A) The box plots show the comparison of tumor infiltration levels among BC cases of each immune subset at each somatic copy number alteration (SCNA) for the HIF1A gene. The infiltration level for each SCNA category was compared with the normal controls. (B) Scatterplots of correlation between HIF1A levels of expression with immune infiltration levels in TCGA BC samples.
Discussion
The regression analysis of the genotyping data for Bangladeshi BC patients revealed a significant link between the HIF1A rs11549465 (C > T) polymorphism and the risk of developing BC. This connection was consistently observed across different comparison models, highlighting a strong association between the T variant of this polymorphism and increased susceptibility to BC. From the 1000 Genomes phase 3, the minor allele frequency (MAF) data exhibited the T allele of the HIF1A rs11549465 polymorphism was more prevalent in Asians, particularly South Asians, compared to other race categories. The GTEx Data indicated that the T allele of this polymorphism was significantly correlated with higher expression of HIF1A in breast mammary tissue (P-value .009), suggesting that the T allele may influence the regulation of HIF1A expression in a tissue-specific manner. In this study, the frequency of the minor T allele was 38% among Bangladeshi BC patients, which was more than twice the frequency found in the control group (18%). This substantial difference underscores the importance of further investigation to firmly establish the T allele’s correlation with increasing breast cancer risk.
The bioinformatics analysis of the rs11549465 SNP protein mutation (P582S) reveals significant impacts on the structural stability of the HIF1A protein. The mutation results in a DDG value of −1.24 kcal/mol, indicating a decrease in protein stability. Structural exposure and surface accessibility analysis revealed that the P582S mutation causes to be structurally exposed, with an absolute surface accessibility of 98%, indicating that this region of the mutant protein is more exposed to the solvent and leads to a 97% structural disorder, suggesting significant deviations from the wild-type structure, which further may affect protein stability and function. Functional investigation through the protein-protein interaction (PPI) network and pathway enrichment analysis revealed significant impacts (−log10 [FDR] fold) on various signaling pathways, including HIF-1, resistance to EGFR tyrosine kinase inhibitors, insulin resistance, focal adhesion, adherens junction, thyroid hormone, estrogen, AGE-RAGE, JAK-STAT, Wnt, and PI3K-Akt pathways. These pathways are crucial for cell signaling, growth, and metabolism. The top-fold enrichment in disease hallmarks indicated that the P582S mutation is associated with a range of diseases, particularly various cancer types, diabetic cardiomyopathy, alcoholic liver disease, Cushing syndrome, measles, atherosclerosis, hepatitis, and neurodegenerative diseases. The P582S mutation replaces a nonpolar, aliphatic side chain with a polar, reactive hydroxyl group, significantly altering the protein’s structure. 3D homology models (of WT_HIF1A and MT_HIF1A proteins) and molecular dynamics (MD) simulations suggested altered topology and structural shifts, particularly in the oxygen-dependent degradation (ODD) domain where the mutation occurs. This mutation reduces hydrophobicity, potentially impacting stability and intramolecular interactions, thereby increasing the risk of functional impairments and contributing to the development of various diseases, particularly cancer. This comprehensive analysis underscores the critical role of the P582S mutation in altering the structure and function of the HIF1A protein, with significant implications for disease mechanisms and potential therapeutic targets. This thorough analysis highlights the crucial role of the P582S mutation in altering the structure and function of the HIF1A protein, which has significant implications for disease mechanisms and potential therapeutic targets. This detailed MD simulations analysis of the WT and MT forms of HIF1A in water, analyzing their structural stability, flexibility, and compactness, and investigating their dynamic behavior through normal mode analysis and SAXS/WAXS scattering curves helps to understand how the mutation affects the protein’s structure and dynamics, potentially providing insights into its functional implications.
Multi-omics data integration approaches combine various types of biological data (such as genomics, transcriptomic, and proteomics) to provide a more thorough and detailed understanding of disease outcomes and biomarker identification.59-62 This integration offers enhanced insights and predictions compared to analyzing each data type individually. In this study, we integrated multi-omics data to examine the altered expression of HIF1A in TCGA BC case-control samples. A significant alteration (P-value 4.32e-05) was observed in BC cases compared to controls. Correlation analysis revealed a significant association (P-value 7.2e-25) between the fraction genome altered and mutational counts with HIF1A expression in BC samples. Predominantly, amplification or up-regulation (P-value < .05) mutation was found in samples across various races. Race category-stratified data indicated most significant changes in HIF1A expression were observed in Whites (P-value 3.0e-06). The frequency of genomic alterations and associated regulatory pathways are good indicators of BC progression and severity. Pathway enrichment analysis, based on differential expression scores, identified the most significant signaling pathways (P-value < .005) related to HIF1A expression: MAPK, Wnt, Notch, PI3-Akt, TGF-beta, and HIF-1. These pathways regulate various aspects of the BC microenvironment, including motility, invasion, modulation, and plasticity. The KM plots of survival analysis showed significant differences (P-value 1.9e-06) in survival times between patients with high and low HIF1A expression levels in TCGA BC cases. To understand the regulation of HIF1A gene expression, we assessed the DNA methylation pattern, and an aberrant DNA methylation pattern (P-value 4.7e-10) was associated with altered HIF1A expression in BC samples. Stratifying the methylation data by ethnicity and BC stage revealed a strong association between altered methylation patterns and Caucasians (P-value 1.5e-07) as well as stages 2 and 3 of BC (P-values < 5e-05). Multivariable survival analysis indicated that higher levels of methylation significantly impacted survival outcomes (P-value < .005). In summary, this study utilized multi-omics data to explore the role of HIF1A in breast cancer, uncovering significant genetic and epigenetic alterations, pathway involvements, and their associations with disease progression and patient survival, with specific insights into racial and stage-related differences.
The study investigated the levels of HIF1A protein in Bangladeshi BC patients and healthy controls using ELISA, and more than 2-fold elevated expression (P-value .003) levels were found in BC patients compared to healthy controls. Manhattan plot enrichment analysis identified the most significant (FDR q-value < 0.001) biological processes related to HIF1A levels, including responses to various stresses (endogenous and abiotic stimuli), reactions to oxygen levels and hypoxia, positive regulation of metabolic processes, and regulation of apoptotic processes and programed cell death. Also, enrichment analysis of the most significant pathways associated with HIF1A protein levels was identified with a Benjamini-Hochberg FDR < 0.001 including HIF-1 signaling, pathways associated with different cancers (breast, renal, prostate, pancreatic, and thyroid), estrogen signaling pathways, and endocrine resistance pathways. This study highlighted the most curated interactions between HIF1A and small molecules, notably oxygen and glucose ranked among the top interactions, suggesting a strong correlation between elevated HIF1A levels in plasma and sensing of hypoxia. In summary, the study demonstrates a significant elevation of HIF1A protein levels in breast cancer patients, correlates with hypoxia-related processes, and suggests the potential of HIF1A as a biomarker for breast cancer diagnosis. The elevated levels of circulating HIF1A could potentially serve as an indicator for breast cancer and the ELISA procedure might become a promising alternative for measuring hypoxia in the future.
To evaluate hypoxia, we used integrated multi-omics approaches to investigate the relationship between altered levels of HIF1A expression and hypoxia in TCGA BC cases. We employed Buffo, Ragnum, and Winter hypoxia scoring methods, and the analyzed data demonstrated a robust correlation (P-value < 5e-18). Ethnicity-stratified hypoxia scores indicated that Black and Asian race categories exhibited the most significant alterations and highest levels of hypoxia compared to Whites. In cancer, defective DNA repair leads to an elevated TMB, which is an indicator of the overall number of nonsynonymous mutations per megabase of coding regions within a tumor genome.50,52 Regression analysis revealed a strong correlation between mutation count and TMB in TCGA BC cases. A linear correlation was also observed between the count of HIF1A mutations and TMB scores in TCGA BC patients (P-value .00), with the highest mutational burden observed in Caucasians. Subtype-stratified data revealed a higher incidence of estrogen receptor-positive (ER+) cases in TCGA BC samples. HIF1A expression covariate-adjusted methylation data showed a significant increase in the ER+ group, with the highest methylation levels in Whites compared to other race categories. Comparing HIF1A altered expression levels between ER+ and ER- groups revealed significant differences (P-value < 1.0e-10), and the ER- group (i.e. HER2 and triple-negative breast cancer [TNBC] subtypes) exhibited higher levels of hypoxia and TMB scores. A negative correlation (P-value 7.9e-29) was observed between HIF1A and ESR1 gene expressions. This study demonstrated a higher incidence of HIF1A genomic alterations and elevated hypoxia and TMB scores in ER- BC cases compared to ER+ cases. Additionally, correlation analysis between levels of tumor-infiltrating immune cells and differential HIF1A expression in TCGA BC cases revealed a strong positive correlation with CD8+ T cells, neutrophils, dendritic cells, and macrophages (P-value ⩽ 9.9e-20) in the microenvironment of BC. Thus, our results indicated that in BC, differential HIF1A expression was linked not only to immune cell infiltration but also to immune checkpoint genes, TMB, and microsatellite instability (MSI) of immune regulators within the breast tumor microenvironment which may be crucial in influencing tumor growth, invasion, and metastasis. However, the primary limitation of this study was the small dataset of BD breast cancer cases, necessitating further research to reach definitive conclusions. Future studies should include long-term follow-ups and work with a larger sample cohort to enhance the robustness of the findings. Another limitation was the racial composition of the case-control samples in the TCGA BC datasets, which predominantly consisted of individuals of the White race category. There are limited datasets available for African and Asian populations, particularly South Asians. The availability of more BC genomics data across all racial categories in the future would help confirm these findings.
Conclusion
The HIF1A transcription factor acts as a key regulator, sensing oxygen levels to meet cellular metabolic needs, ensuring protective responses to hypoxia, and maintaining oxygen homeostasis. In tumors, hypoxia arises from altered metabolism or inadequate vascularization.63-65 In this study, we used a novel multi-omics approach utilizing case-control data to analyze the transcriptional landscape of BC, specifically investigating the correlation between HIF1A expression levels and hypoxia. In this study, we assessed hypoxia status in both Bangladeshi BC and TCGA BC cases. DNA sequencing of the HIF1A gene rs11549465 polymorphism in Bangladeshi cases and controls revealed a strong association between the altered T allele and breast cancer susceptibility. 1000 Genomes analyzed data indicated a higher frequency of the altered T allele among Whites and Asians, with South Asians showing a higher frequency than East Asians. Missense mutations and up-regulation of HIF1A transcript were more prevalent in BC cases than controls. Through eQTL analysis, a significant correlation was found between the minor T allele and elevated HIF1A in BC, indicating an increased risk associated with rs11549465 C/T polymorphism. The structural analysis showed that the rs11549465 (C>T) mutation significantly alters the structure of the HIF1A protein, potentially impacting its stability and function. Additionally, when the oxygen-sensing domain of the wild-type HIF1A and the rs11549465 mutant were modeled in 3D, notable structural shifts were observed in the ODD domain, suggesting functional impairment. In this study, we focused on identifying key proteins and regulatory pathways involved in the crosstalk between hypoxia and BC progression. Enrichment analysis revealed responses to various stimuli, oxygen levels, hypoxia, positive regulation of metabolic processes, as well as the regulation of apoptotic processes and programed cell death with utmost significance. Bangladeshi BC cases showed increased HIF1A expression, strongly linked to hypoxia. The TCGA BC dataset highlighted notable differences in HIF1A gene expressions between cases and controls. Missense mutations and elevated HIF1A expression were significantly linked to BC. Correlation analysis across different race categories revealed significant variations in the fraction of altered genome and mutation count in BC samples. The overall survival analysis of the TCGA BC patients revealed noteworthy differences in survival time between high and low levels of HIF1A expression. Notably, a significant negative correlation between HIF1A expression levels and altered methylation was most prominently associated with Caucasians. The ethnicity-stratified analysis revealed greater genome alterations and hypoxia in Asians and Blacks compared to Whites. Moreover, a correlation analysis of HIF1A and ESR1 Expression in BC data revealed significant negative correlations. Covariate-adjusted methylation profile analysis of HIF1A expression showed increased DNA methylation in the ER+ group compared to the ER- group. In the race-categorized data, BC cases of White ethnicity exhibited the highest methylation levels among different racial categories. The multivariable survival analysis revealed significant alteration in survival time associated with high methylation. Significant alterations in Buffo hypoxia and TMB scores were observed in HIF1A fraction genome alteration levels between ER+ and ER- subtypes of BC. The ER- category showed heightened levels of hypoxia. The correlation analysis of HIF1A expression with immune regulators such as tumor mutational burden (TMB) and microsatellite instability score (MSI) showed significant associations in BC. HIF1A expression exhibited a robust positive correlation with immune cell infiltration, including CD8+ T cells, neutrophils, dendritic cells, and macrophages, indicating the BC microenvironment. Early detection and diagnosis can render most cancers treatable before spreading to secondary tissues. This study established a significant correlation between altered expression of HIF1A and hypoxia in BC patients across diverse racial groups. The observed ethnicity-based link underscores the need for further genomic research in Asian and African populations. Consequently, HIF1A may serve as a valuable predictive biomarker for BC assessment across all races.
Supplemental Material
sj-pdf-1-bmi-10.1177_11772719241278176 – Supplemental material for Exploring the Correlation Between Hypoxia, HIF1A Variants, and Breast Cancer in Different Ethnicities, and Bangladeshi Women: Through ELISA and Integrative Multi-Omics Analysis
Supplemental material, sj-pdf-1-bmi-10.1177_11772719241278176 for Exploring the Correlation Between Hypoxia, HIF1A Variants, and Breast Cancer in Different Ethnicities, and Bangladeshi Women: Through ELISA and Integrative Multi-Omics Analysis by Md. Shihabul Islam and Jesmin in Biomarker Insights
Supplemental Material
sj-pdf-2-bmi-10.1177_11772719241278176 – Supplemental material for Exploring the Correlation Between Hypoxia, HIF1A Variants, and Breast Cancer in Different Ethnicities, and Bangladeshi Women: Through ELISA and Integrative Multi-Omics Analysis
Supplemental material, sj-pdf-2-bmi-10.1177_11772719241278176 for Exploring the Correlation Between Hypoxia, HIF1A Variants, and Breast Cancer in Different Ethnicities, and Bangladeshi Women: Through ELISA and Integrative Multi-Omics Analysis by Md. Shihabul Islam and Jesmin in Biomarker Insights
Footnotes
Acknowledgements
None.
Declarations
Supplemental material
Supplemental material for this article is available online.
References
Supplementary Material
Please find the following supplemental material available below.
For Open Access articles published under a Creative Commons License, all supplemental material carries the same license as the article it is associated with.
For non-Open Access articles published, all supplemental material carries a non-exclusive license, and permission requests for re-use of supplemental material or any part of supplemental material shall be sent directly to the copyright owner as specified in the copyright notice associated with the article.