
Abstract
Clinical management of gynecological cancer begins by optimal debulking with first-line platinum-based chemotherapy. However, in ~80% patients, ovarian cancer will recur and is lethal. Prognostic gene signature panel identifying platinum-resistance enables better patient stratification for precision therapy. Retrospectively collected serum from 11 “poor” (<6 months progression free interval [PFI]) and 22 “favorable” (>24 months PFI) prognosis patients, were evaluated using circulating cell-free DNA (cfDNA). DNA from both groups showed 50 to 10 000 bp fragments. Pairwise analysis of sequenced cfDNA from patients showed that gene dosages were higher for 29 genes and lower for 64 genes in poor than favorable prognosis patients. Gene ontology analysis of higher dose genes predominantly grouped into cytoskeletal proteins, while lower dose genes, as hydrolases and receptors. Higher dosage genes searched for cancer-relatedness in Reactome database indicated 15 genes were referenced with cancer. Among them 3 genes, TGFBR2, ZMIZ2, and NRG2, were interacting with more than 4 cancer-associated genes. Protein expression analysis of tumor samples indicated that TGFBR2 was downregulated and ZMIZ2 was upregulated in poor prognosis patients. Our results indicate that the cfDNA gene dosage combined with protein expression in tumor samples can serve as gene signature panel for prognosis determination amongst ovarian cancer patients.
Introduction
Cancer heterogeneity exists both functionally and morphologically, amplifying the challenges of effectively treating the disease. 1 Therapy stratification tailored to suit the precise characteristics of each patient yields a better prognosis. 2 Biopsies with specific indicative property, also known as biomarkers, can be expression levels of proteins or RNA, copy number variation of specific genes, micro-RNA, or non-coding RNA. 3 Genomic, proteomic, and other “-omic” approaches to evaluate tumor samples have aided in developing gene panels of predictive biomarkers, which identify patients who will respond to distinct therapy strategies. 4 In order to minimize invasiveness in generating samples, liquid biopsies from body fluids such as blood, saliva, and urine have been investigated to develop biomarker gene panels. 5
For nearly 70 years, we have known that there are circulating nucleic acids within the blood, 6 but the concept gained importance in the late 1970s when serum of cancer patients was noted to have a higher concentration of nucleic acids compared to healthy individuals. 7 Hypothesizing that circulating tumor cell-free DNA (cfDNA) can provide potential clues related to primary and metastatic tumors, studies on these DNA have been pursued in many cancer types. 8 Ovarian cancer is the most lethal of all gynecologic malignancies. For 2021, it is estimated that there would be 21 410 new cases and 13 770 deaths. 9 Despite response to first-line therapy, ~80% of patients will experience disease recurrence, and unfortunately, emergence of resistance to chemotherapy is inevitable for most patients.10-12 Platinum-based chemotherapy is the single most active treatment strategy for ovarian cancer, and the underlying mechanisms of resistance to platinum-based chemotherapy are most likely multifactorial.13-15 These include neutralizing alterations by cancer cells to platinum-based intercalated DNA adducts and epigenetic responses of the chemotherapy. 16 Hence, resistance to platinum-based chemotherapy is a major challenge for clinicians, with median progression free survival of 4 months, and median overall survival of 12 months for these patients.17,18 Development of a gene signature panel for reliable prediction of prognosis prior to manifestation of chemo-resistance may help risk-stratify patients with more aggressive disease for whom treatment approaches could be altered.
Although cancer patients have higher concentration of cfDNA than healthy individuals,7,19-21 the concentration and gene composition of cfDNA vary amongst cancer patients. 22 Prior research has shown that DNA encoding oncogenes, tumor suppressor genes, microsatellite alterations, and hypermethylated genes are circulating in the plasma of cancer patients. 23 cfDNA levels in the serum has been shown to predict response to therapy, 24 and qualitative evaluation of cfDNA methylation has been used to differentiate cancer survival.25,26 However, the development of precise gene signature panels with specific genes in the serum is incomplete. Rapid and accurate methods of determination may provide better prediction of response to anti-cancer therapies. Based on this rationale, we sought to develop a precise prognostic gene signature panel of cfDNA genes in poor prognosis (platinum free interval [PFI] < 6 months) versus favorable prognosis (PFI >24 months) patients with high grade serous ovarian cancer.
Our results on sequencing the cfDNA isolated from poor and favorable prognosis patient serum samples indicated that a distinct cluster of genes as DNA fragments are circulating in the blood. Based on the quantification of these genes, they were grouped as genes of higher or lower dosage in the poor prognosis patients compared to favorable prognosis patients. Those high dose genes observed in poor prognosis patient samples were compared to the Reactome database for cancer relevance. Transforming growth factor, beta receptor II (TGFBR2) and Zinc finger, MIZ-type containing 2 (ZMIZ2), which indicated multiple interactions with cancer associated proteins, were verified for protein expression in patient tumor tissues. Based on our study, we propose a novel multi-factorial approach to develop a gene signature panel, with genes identified in cfDNA fragments of patient serum and their protein expression levels in tumor tissues that could demarcate prognosis in ovarian cancer patients.
Materials and Methods
Patient selection
Eligibility was restricted to women with stage IIIC high grade serous carcinoma of the ovary, fallopian tube, or peritoneum who underwent primary debulking surgery followed by adjuvant platinum-based chemotherapy. All women were treated by gynecologic oncologists at Stephenson Cancer Center at The University of Oklahoma Health Sciences Center. In order to compare groups with distinct prognosis and clinical course, patients were dichotomized into 2 groups based on their time from completion of platinum-based chemotherapy until first recurrence (PFI). PFI < 6 months was selected as the poor prognostic group, and PFI ⩾ 24 months defined the favorable prognostic cohort. The study methods and experimental protocols were approved by the University of Oklahoma Health Science Center, Office of Human Research Participant Protection, Institutional Review Board (IRB approval # 6404). The authors confirm that the methods were carried out in accordance with relevant guidelines and regulations. All patients in the study were above 18 years and were informed of the nature of the study and provided written consent, prior to treatment and collection of samples. The storage of samples was done by Stephenson Cancer Center Biospecimen core. Deidentified serum and tissue samples were made available to the researchers for this study. TMA of 126 ovarian cancer patients and pertaining deidentified patient characteristics were graciously provided by the authors of earlier publication. 27
cfDNA isolation
CfDNA from the 2 ml of retrospectively collected serum from each patient was isolated using Quick-cfDNA™ Serum & Plasma Kit (Zymo Research) following the manufacturer’s protocol. The DNA was eluted in 25 μl of elution buffer and the quantification was done using Qubit kit on a Qubit fluorometer (Thermo Fisher). An estimated 1 ng/μl of sample were loaded on High Sensitivity DNA chip (Agilent) and run on a Bioanalyzer 2100 (Agilent). The DNA integrity and purity were evaluated. The electrographs were generated using the 2100 expert software (Agilent).
Sequencing and analysis of cfDNA
For sequencing of the cfDNA, a total of 1 ng of cfDNA was used to construct library using the Nextera XT DNA library preparation kit (Illumina). The samples were sequenced on MiSeq system (Illumina) at 2 × 250 base pair read length. The sequencing yielded about 60 million reads and the quality averages were ⩾Q30 in 71% or more reads. The sequences were aligned against the human genome sequence (GRCh build 38) assembled by Genome Reference Consortium and a pairwise sequence data analysis was performed using GeneSifter analysis software (Perkin Elmer). Annotated genes were normalized to their reads per kilobase per million mapped reads (RPKM) for each sample and gene count were averaged for each group of patients. Gene copy number variations were statistically evaluated following the Welch’s t-test method with P < .05. Volcano plot for the genes that showed fold change of >1and < −1 in poor compared to favorable prognosis patient groups was performed. Heatmap for the gene copy number variation and the ratio of poor prognosis patient genes, grouped either higher (⩾1.5-fold) or lower (⩽ −1.5-fold) compared to favorable prognosis patient genes, were generated using ggplot2 algorithm of the R program.
Gene ontology analysis
Both groups, high and low dose genes, were analyzed using the PANTHER (protein annotation through evolutionary relationship) system for their gene ontology. 28 Classification of these genes into various groups was based on their biological processes, protein class, or molecular functions. This was performed using PANTHER on their website, www.pantherdb.org.
Immunohistochemical staining of tissue microarray (TMA)
All the concomitant patient FFPE samples were collected. Hematoxylin-Eosin (HE) stained sections were marked for tumor by a pathologist. Triplicate tumor cores of 1 mm diameter were set in an empty block using Tissue Arrayer ATA110C (Veridiam) to develop a TMA. For control, normal uterus and fallopian tube were used. The TMA was constructed at the Stephenson Cancer Center’s Tissue Pathology Shared Resource using standard methodology. 29 TMA of 126 ovarian cancer patient tumor samples were provided by the authors of an earlier publication. 27 IHC-staining of both TMA with the antibodies of interest was carried out at the SCC Tissue Pathology Shared Resource that utilizes automated Leica Bond III for IHC staining. Antibodies used were TGFBR2 (1:400; BIOSS) and ZMIZ2 (1:30; Novus Biologicals). IHC staining method were followed as described in publication, 30 briefly, FFPE tissues were sectioned. Deparaffinization and rehydration were performed on an automated Multistainer (Leica ST5020). Subsequently, these slides were transferred to the Leica Bond III™, where target retrieval and peroxidase-blocking were performed. It was followed by the primary antibody incubation for 60 minutes and Poly-HRP IgG reagent was used as secondary antibody. DAB (3,3′-diaminobenzidine tetrahydrochloride) was used as chromogen and slides were counterstained with hematoxylin. Stained slides were dehydrated (Leica ST5020) and mounted (Leica MM24). Antibody specific positive control and negative control (omission of primary antibody) were parallel-stained.
Scanning and analysis of IHC slides
Methods for scanning and analysis of the IHC stained slides have been adapted similar to the earlier publication. 30 Briefly, the IHC stained TMA slides were scanned using an Aperio slide scanner (Leica Inc.). The TMA were segmented, and individual spots were assigned to respective patients using the TMA lab software, which works in conjunction with the spectrum software from Leica Aperio. Quantification of the various protein staining was done using Spectrum software (Leica Inc.).
Software used
Cytoscape 3.4v with plugin for Reactome FIViz app 6 with FI network style for connections. R program with ggplot2 package using R-Studio was used to generate the heatmap for the genes. Multiple unpaired t-tests were done for patient analysis and for individual protein expression studies t-tests were done for all the TMA analysis. All statistical analysis was done using Graphpad Prism 7.0v.
Results
Two cohorts of retrospective ovarian cancer patient samples were used in this study. The primary cohort for the cfDNA analysis included 33 patients with either <6-month (poor prognosis; 11 patients) or ⩾24-month (favorable prognosis; 22 patients) PFI. In order to maintain clinico-pathological uniformity, only patients with stage IIIC high grade serous ovarian cancer who underwent primary debulking surgery were included in the study. The majority of patients were Caucasian with similar BMI and initial serum CA125 concentration (units/milliliter). On average, women diagnosed at younger age (61.2 ± 1.7 year) favored longer (⩾24 months) survival (Table 1). A secondary cohort included 126 ovarian cancer patients and the tumor samples from these patients represented in a TMA 27 were analyzed for validation of the results. Adapting the above criteria, this cohort was divided into 3 categories, poor prognosis (26 patients), favorable prognosis (32 patients), and rest of the patients between 6 and 24 months PFI (68 patients). The characteristics of the poor and favorable prognosis patients had similar BMI, initial CA125 concentration, and age of diagnosis (Supplemental Table 1).
Clinical characteristics of patients selected in the study.

cfDNA characteristics and sequence analysis
Retrospective serum collected at the time of diagnosis from first cohort of both poor and favorable prognosis patients were used to extract the cfDNA. Concentration of cfDNA in the serum did not vary among both groups of patients (Table 1). The molecular size of cfDNA fragments obtained in the serum were between 50 and 10 000 base pairs (Figure 1A and B).

Identification of higher and lower dose of genes in the cfDNA isolated from serum of platinum resistant (poor prognosis) and sensitive (favorable prognosis) patients. (A and B) Chromatogram generated for cfDNA isolated from serum of patients using High sensitivity DNA analysis chip. (A) Favorable and (B) Poor prognosis. (C) Volcanic plot showing genes of higher and lower dose in sequenced cfDNA isolated from patients with poor and favorable prognosis. P-value cutoff: 0.05 (red line); lower threshold: 1.5 (green line); higher (red spheres); and lower (green spheres) genes.
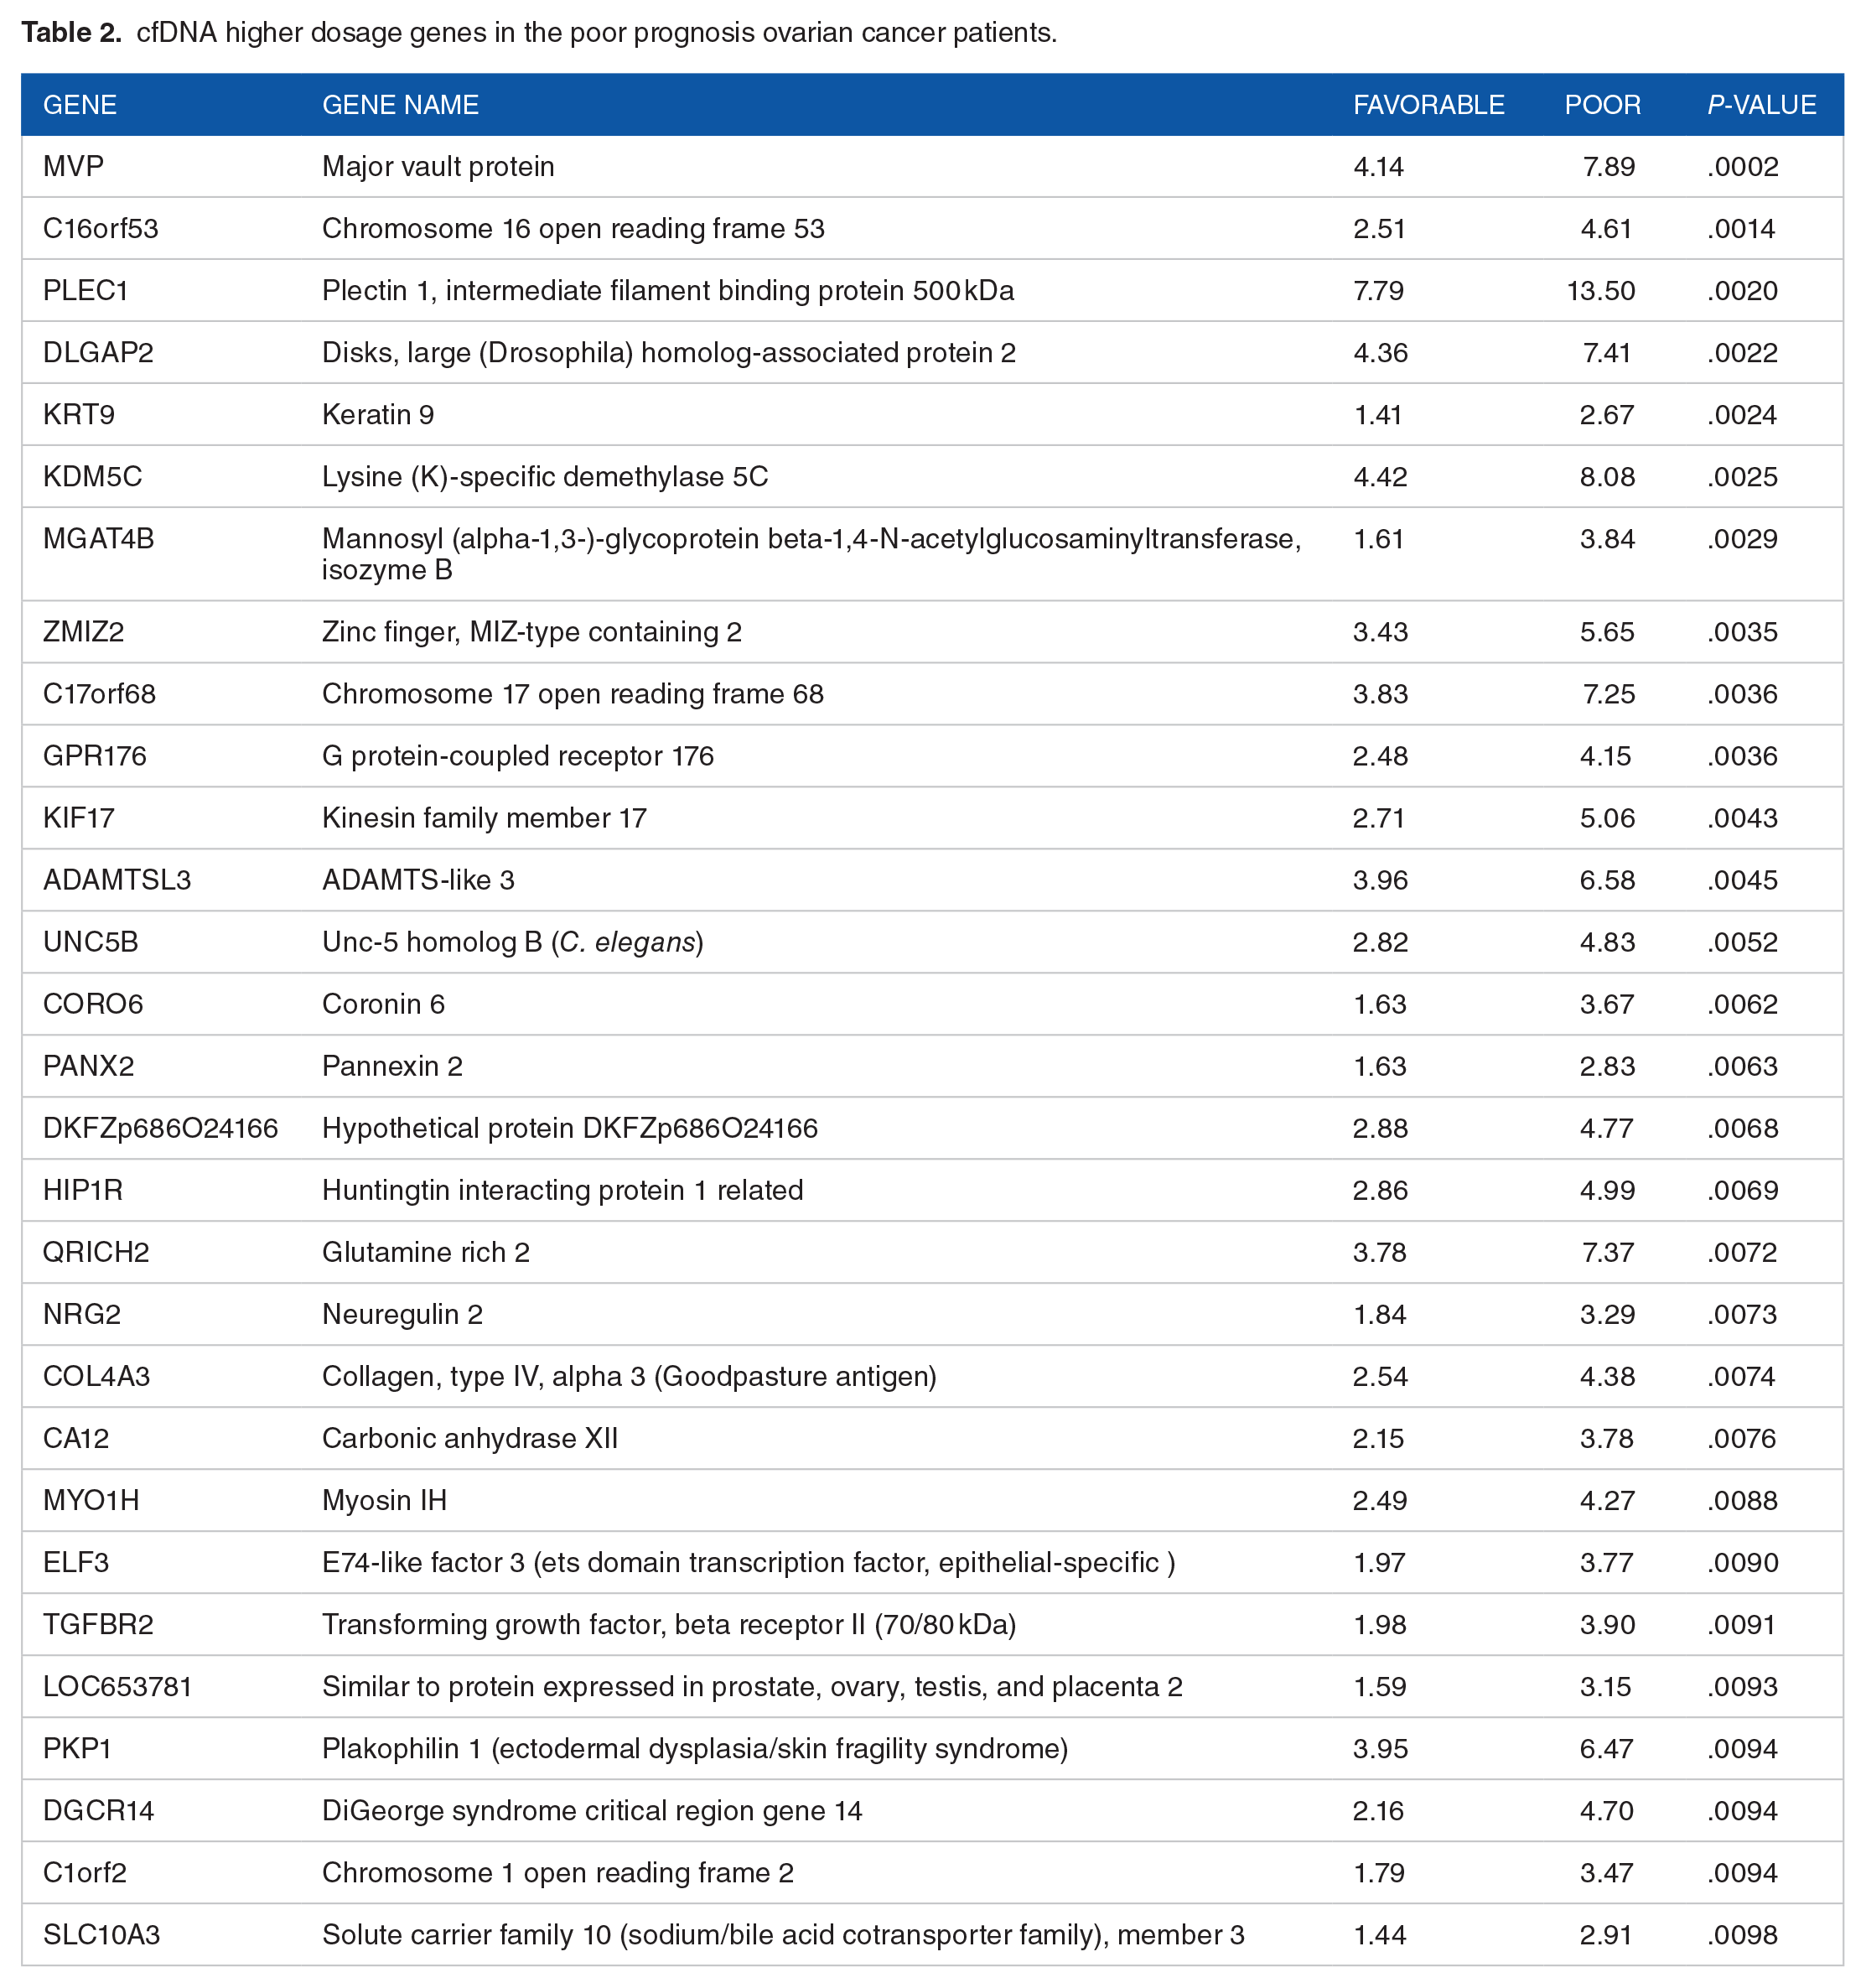
An unbiased next generation sequencing to delineate the gene composition in the cfDNA of the test samples was carried out following previously published procedures.31,32 The cfDNA fragments were sequenced and annotated against the human genome sequences (GRch build 38). Copy number variation of the cfDNA for each gene for each group of patients was calculated. Comparing the gene copy number variations between the poor and favorable prognosis patients, gene dosage for each group of patients was calculated. A volcano plot was generated following previously published methods. 33 The volcano plot from the results representing the gene dosage of >1and < −1 for the poor prognosis compared to the favorable prognosis patients was constructed and presented in Figure 1C. In order to avoid losing physiologically critical genes and signaling pathway proteins that may play a crucial role, an arbitrary gene dosage cut-off of 1.5-fold variation was chosen based on previous studies.34,35 Using a cutoff of 1.5-fold gene dosage and <0.01 P-value threshold, 29 genes were identified to be of higher and 64 genes of lower gene dosages in the poor prognosis compared to favorable prognosis patients (Tables 2 and 3).
cfDNA higher dosage genes in the poor prognosis ovarian cancer patients.
cfDNA lower dosage genes in the poor prognosis ovarian cancer patients.

Gene ontology analysis on genes
Gene ontology enrichment analysis was performed using the PANTHER classification system. 28 A heatmap for the copy number variation and ratio of the higher dose genes in the poor and favorable prognosis patients were plotted (Figure 2A; Table 2). Similarly, a heatmap of the copy number variation was plotted for the 69 lower dosage genes that had 1.5-fold or lower fold ratio in the poor prognosis compared to favorable prognosis patients (Figure 3A; Table 3).

Ontology classification of higher dosage genes in poor compared to favorable prognosis patients into various relationship groups. (A) Heatmap representing absolute expression levels of higher dosage genes in corresponding poor and favorable prognosis patient serum. (B) Grouping of genes by their involvement in various biological processes, (C) classification of the genes based on their cellular functions, and (D) molecular functional grouping based on the molecular activities of their gene products.

Ontology classification of lower dosage genes in poor compared to favorable prognosis patients into various relationship groups. (A) Heatmap representing absolute expression levels of lower dosage genes in corresponding poor and favorable prognosis patient serum. (B) Grouping of genes by their involvement in various biological processes, (C) classification of the genes based on their cellular functions, and (D) molecular functional grouping based on the molecular activities of their gene products.
Higher dose genes
The 29 genes identified as higher dose genes in poor outcome patients were subjected to gene ontology grouping. Based on the biological processes genes showed clustering toward cellular processes (29%), developmental processes (14%), and cellular biogenesis (12%) (Figure 2B). Many of these genes were classified as cytoskeletal proteins (23%), and about 9% each as enzyme modulators, transcription factors, nucleic acid binding proteins, receptors, and signaling proteins (Figure 2C). Furthermore, these factors reflect in their molecular function classification, attributing them to protein binding function (47%) and catalytic activity (27%) (Figure 2D).
Lower dose genes
Gene ontology analysis showed that these lower dose 64 genes were involved in cellular processes (36%), metabolic processes (18%), stimulus response (13%), and biological regulations (11%) of the cell (Figure 3B). Distinctly different from higher dosage genes, protein classification showed a higher number of them as hydrolases (16%), receptors (16%), and nucleic acid binding proteins (14%) (Figure 3C). Agreeing with the biological process grouping, the molecular function classification of these genes indicated a greater number of lower dosage genes grouped with protein binding (40%), catalytic (21%), or receptor activity (16%) (Figure 3D).
Interaction nodes analysis of the higher dosage genes
Reactome database was searched using Cytoscape functional interaction network analysis module for cancer linked genes, to determine which of the higher dose genes formed nodes of interaction with cancer associated genes. 36 Figure 4 shows the degree-based circular layout representation of the analysis. Polyubiquitin-C precursor (UBC) is one of the linker genes used in the network analysis that showed 17 nodes, which had the highest number of nodes amongst all proteins (Supplemental Table 2). However, among the cfDNA higher dose genes, Transforming growth factor, beta receptor II (TGFBR2) was the hub for highest number of 5 nodes (Supplemental Table 2). Other major proteins that formed at least 2 node hubs were Zinc finger, MIZ-type containing 2 (ZMIZ2), Neuregulin 2 (NRG2), E74-like factor 3 (ets domain transcription factor) (ELF3), Unc-5 homolog B (UNC5B), and Huntingtin interacting protein 1 related (HIP1R) (Supplemental Table 2).

Identification of network gene nodes related to cancer among the higher dosage genes of poor compared to favorable prognosis patients. Interaction network nodes of higher dosage genes in circular layout generated using Reactome functional interaction network database on Cytoscape. Higher dosage genes (purple circles with black fonts) and linker genes (green circles with red fonts); solid black lines indicate known interactions and broken black lines are predicted interactions.
Validation of interaction network hub proteins of cfDNA in patient tumor samples
The higher dose genes, TGFBR2 and ZIMZ2, identified may be a consequence of gene amplification, which can lead to upregulation of the protein in the cancer cells. Hence, immunohistochemistry (IHC) staining of TGFBR2 (Figure 5A, i) and ZMIZ2 (Figure 5B, i) were carried out on FFPE sections of the TMA constructed from ovarian cancer patient tumor samples. Since normal ovarian tissue was not available at that time of analysis, normal uterus and fallopian tube tissues were used as controls. The cell membrane receptor, TGFBR2 membranous expression IHC analysis showed increased expression in favorable patients compared to poor prognosis patients (Figure 5A, ii). IHC analysis of ovarian cancer patients for ZMIZ2 showed increased nuclear expression in poor patients compared to the favorable prognosis group of ovarian cancer patients (Figure 5B, ii). The expression levels of TGFBR2 and ZIMZ2 in the second cohort of 126 ovarian cancer patient tumor TMA was analyzed by IHC staining for the proteins. IHC analysis of TGFBR2 membranous expression level decreased in poor prognosis (Supplemental Figure 1A), while ZMIZ2 expression level increased in poor prognosis patients (Supplemental Figure 1B).

Expression of higher dosage genes in poor prognosis patients compared to favorable prognosis patient tumors. (A) TGFBR2 overexpression in patients, (i) Representative IHC staining of TGFBR2 in the FFPE tissue sections at 4× magnification, (ii) Expression levels of TGFBR2 on the cell membranes of the cells in tumor tissues of the ovarian cancer patients. (B) ZMIZ2 overexpression in patients, (i) Representative IHC staining of ZMIZ2 in the FFPE tissue sections at 4× magnification, (ii) Expression levels of ZMIZ2 in the nucleus of the cells in tumor tissues of the ovarian cancer patients.
Discussion
Resistance to platinum-based therapy is a major clinical challenge in caring for women with ovarian cancer. 37 Clinicians lack tools to preemptively identify platinum resistance, which cripples their effort to risk-stratify treatment options for ovarian cancer patients. 38 An ideal tool would be minimally invasive and rapidly testable method with high fidelity. Toward this goal, circulating tumor cell-free DNA (cfDNA) in the retrospective serum of poor and favorable prognosis patients, which were collected at the time of diagnosis, was analyzed herein. Hence, identification of prognostic gene signature that differentiate poor (PFI < 6 months) versus favorable (PFI > 24 months) prognosis patients, dichotomized based-on the time to their first recurrence, was analyzed in this study.
Previous studies have shown that the cfDNA in the serum has multiple origins including apoptotic or necrotic tumor cells, exosomes, macrophage activity, and release by normal cells.39-43 The differential profile of genetic signatures in cfDNA could be the result of apoptotic cancer cell derived DNA, 44 chromosomal gene amplification/deletion,42,45 circulating tumor cell derived DNA, 46 or DNA specifically released as intratumoral signaling conduits by the cancer cells.47,48 Nevertheless, it can be posited that the cfDNA profile from poor versus favorable prognosis patients will exhibit variation in their respective gene composition. Hence, understanding the gene composition based on the cfDNA sequences would shed more light on the behavior of those cells that release the DNA.
Our sequence analyses of the cfDNA indicated that the samples from poor-prognosis patients exhibited 29 genes at higher dosage and 64 genes at lower dosage levels (Figure 1C; Tables 2 and 3). Many of the genes in the higher dosage group clustered toward functions essential in cancer cell invasion and metastasis whereas the gene signature from the lower group consists mostly of genes encoding receptors and enzymes involved in growth inhibition or tumor suppression. Reasoning that the presence of specific gene signature rather than the lack of it or decrease in gene dosage levels could present a more reliable parameter for poor-prognosis, we focused on characterizing the gene signature associated with higher dosage genes.
All the 29 higher dosage genes from poor prognosis patients were investigated for cancer association. This search yielded at least 15 genes that were referenced to having functional relationship with some type of cancer. Specifically, increased expressions of Transforming growth factor beta receptor II (TGFBR2), Neuregulin 2 (NRG2) as well as the respective signaling pathways activated by the proteins in ovarian cancer progression and metastasis are well characterized.49-51 TGFBR2 functional effect is impaired by YAP and EZH2 signaling in small cell lung cancer 52 and by another protein, GFT2IRD1, in colorectal cancer. 53 NRG2 ligand binds with ErbB2 receptors and downstream signaling lead to colorectal cancer and breast cancer progression.54,55 Potential role of Keratin 5 (KRT5) as well as Collagen, type IV, alpha 3 (COL4A3) in invasive metastasis and disease recurrence in ovarian cancer have also been previously known.56,57 Although a defined role for PANX1 in ovarian cancer is thus far unknown, it is shown to promote invasive migration in hepatocellular carcinoma. 58 Similarly, PKP1 has been shown to be associated with tumor progression and metastasis in prostate cancer and melanoma59,60 while Kinesin superfamily protein 17 (KIF17) is known to be associated with Rho-mediated epithelial cell migration. 61 In addition, the poor-prognosis gene signature identified by our study also includes Zinc finger, MIZ-type containing 2 (ZMIZ2) involved in Wnt1/β-catenin signaling in colorectal cancer and papillary thyroid cancer62,63; Netrin B receptor (UNC5B), which is involved on Netrin-1 signaling in gastric cancer cell proliferation via PI3K/AKT pathway 64 ; Disk, Large homolog-associated protein 2 (DLGAP2) is involved in pancreatic cancer through AMPK pathway 65 ; G protein-couple receptor (GPR176) is implicated in breast cancer transcriptional response, 66 which is an immune therapy target for ovarian cancer67,68; and Lysine-specific histone demethylase 5C (KDM5C) gene that promotes prostate cancer by repressing PTEN expression. 69
Analysis of these 15 genes in TCGA database oncoprint (National Cancer Institute, The Cancer Genome Atlas) using cBioportal,70,71 further confirmed that these genes were predominantly amplified, or deleted but not mutated (Supplemental figure 2). These gene amplification/deletions variation among patients suggested that their functional protein expression may vary in the patient tumor samples. 72 Hence, the top 2 proteins identified by Reactome functional database analysis that is, TGFBR2 and ZMIZ2 were tested for their protein expression in the patient tumor samples. About 3% of patients reported in TCGA data show amplification and our sequencing results show higher dosage of TGFBR2 in poor prognosis patients. In contrast, the protein expression, as monitored by TMA, was downregulated in poor prognosis patient tumor samples, thus presenting an apparent inconsistency between the data from the cfDNA analysis and TMA analysis. It should be noted here that TGFBR2 shows increased expression in omental metastases and invasive front of ovarian cancer. 51 Since our TMA does not represent any samples from omental metastases or invasive front of ovarian cancer tissue, it is more likely that our TMA analysis missed the expression profile of TGFBR2. Previous findings that the expression of TGFBR2 is closely associated with ovarian cancer progression also point to a prognostic role for TGFBR2. Further IHC analysis of TMA representing different locales of ovarian cancer tissues should establish the unequivocal role of TGFBR2 as a prognostic biomarker in ovarian cancer liquid biopsy. It should also be noted here that the age difference between the poor-prognosis and favorable-prognosis is significantly different (Table 1). Considering the previous findings that omental metastases show increased expression of TGFBR2, 51 it is possible that the age difference and possibly the associated metastatic stage of the tumor plays a role in presenting TGFBR2 as a cfDNA-based prognostic biomarker in ovarian cancer. Thus, it is possible that age could be a parameter in deciding which biomarker can be used for prognosis. Further analysis with distinct age group, histological sub-types, stage/grade, and spatial localization of the expressed markers is anticipated to consolidate the prognostic biomarker candidacy of cfDNA-gene signatures such as that of TGFBR2.
Interestingly, gene signature for ZMIZ2 shows higher dosage as well as protein upregulation in poor prognosis patient tumor samples. This corroborates well with the previous findings that indicated a pro-tumorigenic role for ZMIZ2.73,74 Staining of ZMIZ2 on a second cohort of ovarian cancer patients, reiterated the upregulation of ZMIZ2 in poor prognosis patients. Functionally, this is validated by the findings that the expression of ZMIZ2 is correlated with the Wnt/beta-catenin signaling 74 and Wnt-signaling is often dysregulated in ovarian cancer. 75 In light of its tumor promoting role in other cancers,62,76,77 ZMIZ2 could prove to be a valid prognostic biomarker for ovarian cancer poor prognosis/therapy-resistance.
Various oncogenes and tumor suppressors have been identified as prognostic and diagnostic biomarkers for ovarian cancer progression. 78 cfDNA based biomarkers are investigated widely for methylation patterns and DNA copy number variations in ovarian cancer patients.79,80 Advances in next generation sequencing allowed our approach to sequence the minimal quantity of cfDNA for gene signature panels. 81 Although, the level of amplification of the considered genes may be low, this pilot project indicates presence of specific genes as cfDNA fragments in serum and respective protein expression levels in tumor tissue, which of those can be exploited further as multi-factorial definition for prognosis determination in ovarian cancer patients. However, we acknowledge that larger cohort of patients, inclusive of various ethnic background, need to be tested and an unequivocal panel of gene signatures developed to serve as a novel tool for stratification of prognosis among ovarian cancer patients.
Supplemental Material
sj-docx-1-bmi-10.1177_11772719221088404 – Supplemental material for Circulating Tumor Cell-Free DNA Genes as Prognostic Gene Signature for Platinum Resistant Ovarian Cancer Diagnosis
Supplemental material, sj-docx-1-bmi-10.1177_11772719221088404 for Circulating Tumor Cell-Free DNA Genes as Prognostic Gene Signature for Platinum Resistant Ovarian Cancer Diagnosis by Camille C Gunderson, Rangasudhagar Radhakrishnan, Rohini Gomathinayagam, Sanam Husain, Sheeja Aravindan, Kathleen M Moore, Danny N Dhanasekaran and Muralidharan Jayaraman in Biomarker Insights
Footnotes
Acknowledgements
We thank the Stephenson Cancer Center (SCC) at the University of Oklahoma Health Sciences Center (OUHSC), Oklahoma City, OK and an Institutional Development Award (IDeA) from the National Institute of General Medical Sciences of the National Institutes of Health under grant number P20GM103639 for the use of Biospecimen, and Histology, Immunohistochemistry and Microscopy Core, which provided Processing and Embedding/Tissue staining /ImmunoHistochemistry service. We wish to acknowledge the SCC Biospecimen core, for providing the serum and tissue samples and Molecular Biology and Cytometry core for assisting with sequencing the samples supported partially by the National Cancer Institute Grant P30CA225520 of the National Institutes of Health.
Funding:
The author(s) disclosed receipt of the following financial support for the research, authorship, and/or publication of this article: Authors wish to acknowledge the Stephenson Cancer Center for the Seed Grant awarded to CCG, KNM, DND, and MJ for this study and publication.
Declaration of conflicting interests:
The author(s) declared no potential conflicts of interest with respect to the research, authorship, and/or publication of this article.
Data availability
Supplemental material
Supplemental material for this article is available online.
References
Supplementary Material
Please find the following supplemental material available below.
For Open Access articles published under a Creative Commons License, all supplemental material carries the same license as the article it is associated with.
For non-Open Access articles published, all supplemental material carries a non-exclusive license, and permission requests for re-use of supplemental material or any part of supplemental material shall be sent directly to the copyright owner as specified in the copyright notice associated with the article.