
Abstract
A data-independent acquisition (DIA)/parallel reaction monitoring (PRM) workflow was implemented to identify improved ovarian cancer biomarkers. Data-independent acquisition on ovarian cancer versus control sera and literature searches identified 50 biomarkers and indicated that apolipoprotein A-IV (ApoA-IV) is the most significantly differentially regulated protein. Parallel reaction monitoring with Targeted Ovarian Cancer Proteome Assay validated differential ApoA-IV expression and quantified 9 other biomarkers. Random Forest (RF) analyses achieved 92.3% classification accuracy and confirmed ApoA-IV as the leading biomarker. Indeed, all samples were classified correctly with an [ApoA-IV] breakpoint. The next best biomarkers were C-reactive protein, transferrin, and transthyretin. The Targeted Ovarian Cancer Proteome Assay suggests that ApoA-IV is a more reliable biomarker than had been determined by immunological assays and it is a better biomarker than ApoA-I, which is in the OVA1 test for ovarian cancer. This research provides a PRM/RF approach together with 4 promising biomarkers to speed the development of a clinical assay for ovarian cancer.
Keywords
Introduction
With an incidence of 12.1 and death rate of 7.7 per 100 000, ovarian cancer is the deadliest gynecological cancer and the fourth most frequent cause of cancer death in women. 1 Ovarian cancer has been termed the silent killer because of the lack of early warning symptoms. Although ~90% of patients have symptoms (eg, frequent urination, pelvic pain, fatigue, abdominal distension) before diagnosis, 2 the symptoms usually are too vague to prompt a visit to a physician or are easily confused with other illnesses. Hence, ~70% of women diagnosed with this cancer have advanced disease, where the 5-year survival rates are <30%.1,3 In contrast, for the ~15% of patients who are diagnosed early when the cancer is confined to the primary site (ie, stage 1), the 5-year survival rate is >90%. 4 The >3-fold increase in survival rates for patients with localized disease and the >14 000 deaths annually in the United States from ovarian cancer provide compelling justification for supporting the research needed to identify improved biomarkers for early-stage detection.
CA-125 and imaging are the most common approaches for ovarian cancer screening. However, these approaches, either alone or in combination, are not useful for routine screening due to their low specificity and/or sensitivity. For example, serum CA-125 has a sensitivity of >98% but a specificity of only ~55% for early-stage disease.5,6 Due to the low prevalence of ovarian cancer, a useful screening strategy must have a sensitivity of >80% for early-stage disease and specificity of >99.6%. 7 A review of 60 publications reporting 113 ovarian cancer tumor-associated antigens or their autoantibodies, 8 together with our reviews of 50 literature protein biomarkers (see below), identified several biomarker panels that use from 1 to 6 biomarkers to achieve ⩾90% sensitivity and specificity. As most of these panels share few, if any, biomarkers in common, we reasoned that inclusion of as many of the biomarkers in these, and other previously reported panels, in a single biomarker panel would leverage >30 years of research and result in a biomarker panel with the highest possible sensitivity and specificity.
The majority of assays for ovarian cancer biomarkers have relied on enzyme-linked immunosorbent assays (ELISAs) and other immunological approaches. Although immunological assays offer high sensitivity (eg, below picogram per milliliter for cytokines), they cannot be used in a discovery mode to identify new biomarkers, and they have limitations with respect to selectivity and specificity that may hamper the search for a clinically useful biomarker panel. For example, a mass spectrometry (MS)-based analysis of 1124 recombinant antibodies for 152 human proteins found that only 40% of the antibodies recognized their intended target in HEK293 cell lysates, and the average number of proteins detected in each immunoprecipitate was ~200. 9 In addition, suitable commercial antibodies (Ab) could not be found to detect the remaining 59 targets. In view of these potential challenges, as well as the tremendous variability in the quality of commercially available antibodies and the additional challenges that are encountered when scaling up immunological assays beyond a panel of a few proteins, we believe that MS offers an improved paradigm for reaching the goal of a clinically useful biomarker panel for detecting early-stage ovarian cancer.
Data acquisition by MS can be achieved by data-dependent acquisition (DDA), data-independent acquisition (DIA), and targeted data acquisition (TDA). In DDA, a defined number of precursor ions from the full scan are selected for fragmentation based on predetermined settings, such as precursor intensity and charge state. In DIA, however, the instrument acquires a full MS spectrum followed by a series of sequential MS/MS spectra of predefined isolation windows that subdivide a larger m/z region. 10 One of the methods by which DIA data are processed uses a targeted data extraction strategy.11,12 This strategy uses the highly specific fragment ion maps in a spectral library as the basis for qualitatively and quantitatively mining DIA data sets. 11 In contrast to DDA, in TDA, a list of precursors are selected for fragmentation followed by detection of a few (selected/multiple reaction monitoring, SRM/MRM) or most (parallel reaction monitoring, PRM 13 ) major product ions. Targeted data acquisition is already being used to provide millions of assays for steroids, biogenic amines, and other small molecules that are being run annually in clinical laboratories worldwide. 14 Just as TDA has supplanted the immunological approaches used in the 1960s to assay for many small molecules, so too there has been an “explosion of interest in clinical and translational applications of targeted MS for peptide and protein measurements”—with this technology being especially applicable to the verification of potential protein disease biomarkers. 15 In recognition of the important role that TDA can play in hypothesis-driven research and its increasing impact on clinical proteomics, Targeted Proteomics was selected as the Nature Method of the Year in 2012. 16 As examples, Hüttenhain et al 17 used TDA to develop assays for 182 human proteins whose concentrations spanned 5 orders of magnitude and reached below 10 ng/mL in depleted plasma, whereas Domanski et al 18 used TDA to quantify 67 biomarkers of cardiovascular disease in human plasma, with 7 of these proteins being quantified in the 10 to 100 ng/mL range. In this study, we implemented a DDA, DIA, and PRM MS-based workflow that utilizes DIA for discovery and PRM for validation of ovarian cancer biomarkers in nonfractionated sera. Data-independent acquisition analysis of sera samples identified apolipoprotein A-IV (ApoA-IV) as the most significantly differentially expressed biomarker for ovarian cancer. The decreased expression of ApoA-IV in sera from ovarian cancer patients was then validated by PRM analysis with the Targeted Ovarian Cancer Proteome Assay (TOCPA) that targeted ApoA-IV as well as 9 other previously identified biomarkers. Finally, Random Forest (RF) analyses of the PRM data determined the relative importance of the 10 biomarkers for classification of ovarian cancer sera.
Materials and Methods
Patient cohort
The disease group included 6 women aged 25 to 88 years with newly diagnosed ovarian cancer (pelvic mass). All samples were collected prior to diagnosis at the Gynecologic Oncology Clinic in Yale New Haven Hospital. As indicated in Supporting Table 1, the ovarian cancer samples were classified as newly diagnosed ovarian cancer (stages I-IV and X) as determined by clinical, surgical, histological, and pathologic diagnosis. The stage “X” patients, #IV83 and R1600, had advanced disease with disseminated carcinomatosis throughout the peritoneal cavity that could not be removed by surgery. The control group of 7 age-matched healthy individuals had come for a regular gynecologic examination. These individuals did not have a diagnosis of any type of cancer and were disease-free at least 6 months after sample collection. Patients were enrolled in the early detection program in the Department of Obstetrics and Gynecology at Yale University under HIC protocol no. 10425/26784. Information about diagnosis, staging histology, and grade was provided by the Gynecologic Oncology Clinic at the Yale New Haven Hospital. No data allowing identification of the patients were provided. Qualified personnel obtained informed consent from each individual participating in this study.
Sample collection
Using standardized phlebotomy procedures, 10 mL of peripheral blood was drawn from subjects. Within 2 to 4 hours of collection, samples were processed using guidelines set by the National Cancer Institute (NCI) Inter-group Specimen Banking Committee and stored at −80°C in the Tissue/Sera Bank of the Discovery to Cure program at Yale New Haven Hospital.
Sample preparation and dual enzyme digestion
Aliquots (3 µL) of sera from each of the 7 control and 6 ovarian cancer patients were subjected to chloroform:methanol:water extraction by bringing the volume of each sample to 100 µL with water. After adding 400 µL methanol, the samples were vortexed prior to the addition of 100 µL chloroform. After vortexing, another 300 µL water was added prior to vortexing again and then centrifuging for 1 minute at 14 000g. At this point in the procedure, the precipitated protein is between the 2 layers. After carefully removing the top aqueous layer, the samples were washed again by adding 400 µL methanol, vortexing, and then centrifuging for 2 minutes at 14 000g. After carefully removing as much as possible of the methanol without disturbing the pellet, the samples were centrifuged for ~1 to 2 minutes in a Speed-Vac until dry and then dissolved in 20 µL of 8 M urea and 0.3 M triethylammonium bicarbonate. The samples were then reduced by adding 2 µL of 45 mM dithiothreitol and incubating at 37°C for 20 minutes prior to alkylation by the addition of 2 µL of 100 mM iodoacetamide and incubation at room temperature for 20 minutes. The samples were digested first with 1.5 µL of 1 mg/mL lysyl endopeptidase (catalog number: 125-02543; Wako Pure Chemical Industries, Ltd., Richmond, VA, USA) for 5 hours at 37°C and then with 2.0 µL of 1 mg/mL trypsin (catalog number: V511X; Promega, Madison, WI, USA) for 16 hours at 37°C. After acidifying to stop digestion, they were desalted using C18 MacroSpin columns. After drying in a Speed-Vac, the peptides were initially dissolved in 3:8 v/v 70% formic acid/0.1% trifluoroacetic acid and protein concentrations were determined by hydrolysis and amino acid analysis (see below) of an aliquot of each sample. Based on these analyses and an estimated initial sera concentration of 70 mg/mL, the average recovery through the chloroform methanol extraction was >90%.
Total protein quantitation by amino acid analysis
Amino acid analysis was used to determine accurate total protein concentrations of each of the chloroform/methanol-extracted samples so that equal amounts of protein could be digested and subjected to DDA, DIA, and PRM analysis. Briefly, an aliquot of each serum sample was dried in a Speed-Vac and then hydrolyzed for 16 hours at 115°C in 100 µL of 6 N HCl, 0.2% phenol with 2 nmol norvaline as an internal standard that was used to correct for losses that may occur during sample transfers, drying, and so on. After hydrolysis, the acid was removed by drying in a Speed-Vac, and the resulting amino acids were dissolved in 100 µL loading buffer (0.02 N HCl) with 2 nmol taurine as a second internal standard that was used to independently monitor transfer of the sample onto the analyzer. The analyses were carried out on a Hitachi L-8900A Amino Acid Analyzer with ion-exchange separation of the amino acids and post-column derivatization with ninhydrin for detection. Data were collected and analyzed with the Hitachi EZChrom Elite software.
Data acquisition by MS
All 3 types of data acquisition, DDA, DIA, and PRM, were performed on an Orbitrap Fusion (Thermo Fisher Scientific, San Jose, CA, USA) mass spectrometer that was interfaced with a nanoACQUITY UPLC System (Waters Corporation, Milford, MA, USA). Dual enzyme–digested samples were loaded into a trapping column (nanoACQUITY UPLC Symmetry C18 Trap Column, 180 µm × 20 mm, product number: 186006527) at a flow rate of 5 µL/min and separated with a C18 column (nanoACQUITY column Peptide BEH C18, 75 µm × 250 mm, product number: 186003545). The compositions of mobile phases A and B were 0.1% formic acid in water and 0.1% formic acid in acetonitrile, respectively. Peptides were eluted with a gradient extending from 5% to 35% mobile phase B over 90 minutes at a flow rate of 300 nL/min and column temperature of 37°C. Eluted peptides were analyzed by DDA, DIA, and PRM methods.
Liquid chromatography (LC)-DDA-MS/MS was performed on all 13 samples with the mass spectrometer operating in a TopN data-dependent mode. The resulting DDA data, which were derived from single analyses of ~200 ng amounts of each of the 13 samples, were used for the database searches needed to identify proteins present in the sample and to build a serum spectral library using Skyline software that could then be used for targeted extraction of DIA data. For LC-DIA-MS/MS, which was also conducted on ~200 ng amounts of all 13 samples, the mass spectrometer was operated with a high-resolution accurate mass (HR/AM) MS1 scan at a resolution of 120 000 that was followed by 25 DIA scans of 20 m/z isolation windows that covered the precursor mass range extending from m/z 400 to 900 over the entire chromatographic elution profile. For DIA data extraction, only tryptic peptides were considered that have no missed cleavages, no methionine, and no NXT/NXS sequence motifs. After extraction, the DIA data were filtered to only include peptides that were quantified with ppm error of less than 10, minimum transitions of 3, and dotp of at least 0.7. The data were further filtered to only include peptides that were present and quantified in all 13 biological samples (6 cancer and 7 healthy).
Initial targeted LC-PRM-MS/MS analyses were carried out with the inclusion list in Supporting Table 2 on pooled ovarian cancer and control samples that contained equal volumes of each of the sera samples from 6 ovarian cancer and 7 control patients. For these analyses, the target list of ~130 peptides, which included the 121 peptides in Supporting Table 2 as well as 9 other peptides that were later determined to be derived from proteins that were not significantly differentially expressed in the 6 ovarian cancer sera, was divided into 3 lists of ~45 peptides. As a separate method was used for doubly and triply charged peptides on each of the 3 lists, this resulted in conducting a total of 6 targeted analyses on each of the control and ovarian cancer pools for a total of 12 (unscheduled) targeted analyses. As our preliminary studies carried out with a resolution of 30 000 on the pooled samples resulted in poorer integration of lower abundance ions, the final unscheduled PRM analyses on the 13 individual samples were performed at a resolution at m/z 200 of 60 000; which is in reasonable agreement with Gallien and Domon 19 who suggested a minimum resolution of 70 000 for quantitative PRM analyses. The final unscheduled LC-PRM-MS/MS was performed individually on ~250 ng amounts of each of the 13 samples using the inclusion list in Supporting Table 10. Other parameters used for the final PRM analyses included a maximum fill-time of 120 ms, isolation window of 1.6 Da, normalized collision energy of 28, and scan time of 128 ms. As described below, the final PRM analyses monitored 25 peptides and 26 ions from the 10 biomarker proteins in the TOCPA, together with 5 of the 15 peptides in the Pierce Peptide Retention Time Calibration Mixture (PRTC; Thermo Fisher Scientific) that was added as an internal standard to each sample destined for DIA and PRM analysis. The triplicate PRM analyses on the 13 samples were conducted in randomized control versus ovarian cancer sample order as listed in Supporting Table 3.
Database search and spectral library construction
As the precursor m/z is uncoupled from the fragment m/z in DIA data files, it is necessary to use spectral libraries for spectrum-to-peptide matching. As sample type–specific spectral libraries have been recommended for reliable DIA data analysis, 20 a human sera spectral library was generated from the analysis of the sera tryptic digests obtained by the 13 LC-DDA-MS/MS analyses described above. Data-dependent acquisition data were processed using Proteome Discoverer v2.1 (Thermo Fisher Scientific) with the spectra searched against the human SwissProt database (v2015-09-16) with precursor and fragment mass tolerances of 10 ppm and 0.02 Da (20 ppm), respectively. Additional parameters used for database searches included trypsin as digestion enzyme, maximum missed cleavage sites of 2, oxidation (+15.99492 Da) of methionine as a dynamic modification, and carbamidomethylation (+57.03404 Da) of cysteine as a static modification. The protein false discovery rate, which was determined by a target-decoy search strategy, was set to 1%. The spectral library was generated from DDA data using the BiblioSpec algorithm and Skyline open-source software. In the Build Library tab in Skyline, the cut-off score was set to 0.99.
DIA and PRM data analysis
All DIA data were imported and processed directly in Skyline without any conversion of raw files. Peptide fragment ion peak areas were extracted using information in the spectral library except that peptides containing NXT/NXS, methionine, missed cleavages, and potential ragged ends were excluded from the analysis. For DIA quantification, Bilbao et al 12 have shown that increased accuracy can be achieved using a subset of fragment ions instead of the entire identification set. In the Transition Settings tab in Skyline, the fragment ion resolution was set to 60 000, fragment ions were specified from ion m/z greater than precursor to the last ion, and a setting was used that selected 5 fragment ions. The ion match tolerance was set to 0.05 m/z with peak areas restricted to only y-type fragment ions. To remove noisy peaks and interfering fragment ions, DIA data were further filtered to only include precursors with a minimum of 3 fragment ions and a minimum dotp value of at least 0.7. In Skyline, each peptide is quantified by the sum of its integrated chromatographic fragment ion peak areas. The peptide peak areas observed in 6 ovarian cancer and 7 control samples were exported into Excel for further analysis of the data. In those cases where multiple charge states were detected, only a single charge state was considered in Excel with preference given to +2 charged peptides, followed by +3 and then +4. Furthermore, the relative peptide ratio in cancer versus control samples was calculated by dividing the mean of the peptide area in cancer samples by the mean of the peptide area in the control samples. The relative peptide ratio was then transformed into log2 and median-normalized. Student t-test was used to estimate the significance of a change in the relative level (P ⩽ .05) of peptides in ovarian cancer versus control samples. Parallel reaction monitoring data were also processed in Skyline after selecting transitions with dotp values compared with the library spectrum of 0.9 or above.
Outlier filtering and missing value imputation for RF analyses of PRM data
As there are only 3 technical replicates for each transition in each of the 13 samples, it is difficult to calculate the standard deviation (SD) and then use the resulting SDs as a basis for removing outliers. Hence, the absolute values of the differences between each replicate were pooled together to generate the empirical distribution shown in Supporting Figure 1. As shown in this figure, the cancer and control samples have similar distributions at the tail, and a cut-off value of 1.0 was chosen for both the ovarian cancer and control samples. As a result, 1% of the data were filtered out as outliers. After outlier filtering, the mean of the replicates was calculated as the measurement for each transition and it was determined that 70 (ie, 2.18% of 3206) data points were missing. The median of each transition in the 6 ovarian cancer and 7 control sets of triplicate analyses was then used to separately impute values for these missing data.
RF analyses of PRM data from 7 control and 6 ovarian cancer sera
Random Forest 21 analyses with 500 and 10 000 trees was performed on the PRM data to enable classifications at the transition, peptide, and protein levels. For the peptide and protein levels, all of the peak areas for the transitions in the respective peptides and proteins were summed prior to carrying out the classifications. As the sample size is relatively small, a leave-one-out cross-validation method was used to calculate the sensitivity, specificity, and overall “success rate” or accuracy of classification. The 95% of confidence intervals were calculated with 2000 replications. To estimate the significance of each feature in the RF, the average mean decrease in Gini (MDG) index was calculated for all peptides and proteins. Mean decrease in Gini indexes are estimated by permutation of the features and calculation of the decrease in the MDG index for each classification.
Data sharing and dissemination
The 39 raw data files from the triplicate PRM analyses of sera from 6 ovarian cancer and 7 control patients, the directory of these files that is in Supporting Table 3, and the corresponding Skyline file as well as an abstract and summary of the study have been uploaded to the Mass Spectrometry Interactive Virtual Environment (MassIVE) repository as accession number MSV000080258 and can be viewed in http://massive.ucsd.edu/ProteoSAFe/dataset.jsp?task=c773616359cd43d4b459e8db8a89b7a2.
Results
DIA MS identifies ApoA-IV as the most significantly differentially expressed biomarker for ovarian cancer in human sera
The DIA workflow in Figure 1 was used to identify candidate biomarker proteins in sera from ovarian cancer patients. Data-dependent acquisition was performed on the same sera samples used for DIA to generate the spectral library. Data-independent acquisition data were collected on 3 technical replicates per sample, imported into Skyline, and the extracted ion chromatograms of peptide fragment ions were generated using the associated DDA-generated spectral library. In DIA, several precursors are isolated and concurrently fragmented, generating composite MS/MS spectra. To prevent interferences resulting from overlapping fragment ions generated from different precursors from compromising the quantification accuracy, the DIA data were filtered in Skyline to only include precursors with minimum dotp ⩾0.7. With this filter, minimum threshold of 3 transitions per precursor and other stringent criteria (see “Materials and Methods” section) for filtering the peptides, the combined DIA analysis quantified 1203 peptides from 185 proteins. The lists of proteins and peptides quantified by each of 3 technical DIA replicates are provided in Supporting Tables 4 to 6. Supporting Figure 2 shows log2-transformed, normalized peptide ratios in cancer versus control sera.
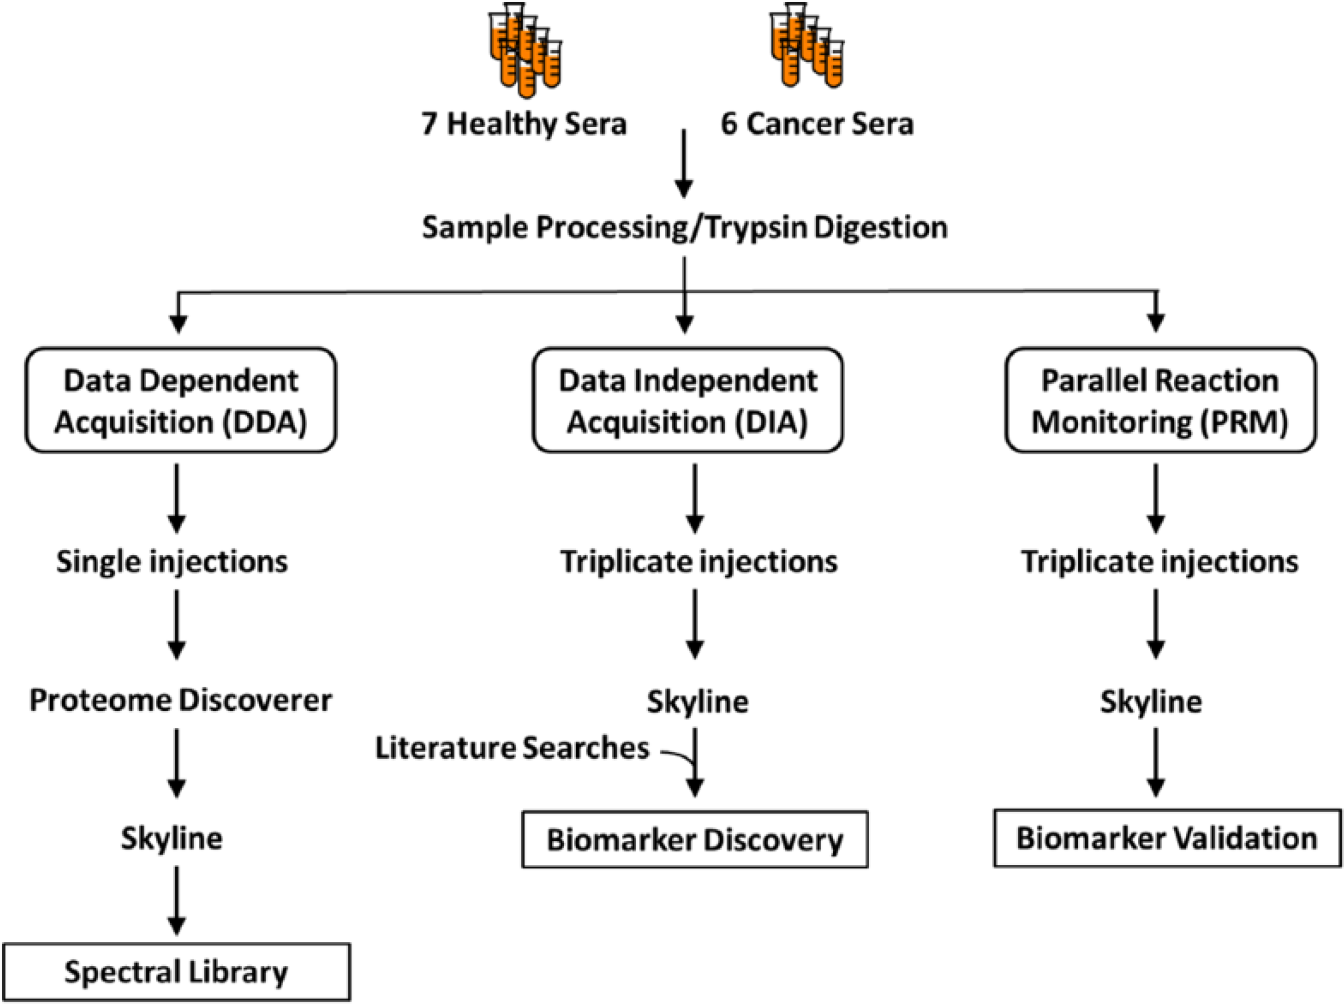
DIA/PRM protein disease biomarker workflow with DIA, DDA, and PRM analyses carried out on a Thermo Fisher Scientific Orbitrap Fusion Tribrid mass spectrometer on 13 sera from 6 ovarian cancer and 7 control individuals. The spectral library needed for the DIA and PRM analyses was derived from the DDA analyses.
Considering the high biological variation expected across human sera samples, proteins with relative fold-change ⩾1.5, P ⩽ .05, and identified with at least 2 peptides in all samples were selected as significant and potential biomarker candidates. Apolipoprotein A-IV fulfilled these stringent criteria and was determined to have a decreased level in sera from ovarian cancer compared with healthy, control individuals. The boxplots in Supporting Figure 3 show the peak areas of the 11 ApoA-IV peptides extracted from LC-DIA-MS/MS runs of cancer and normal sera. Together, these 11 peptides account for 33% (124 of 376 amino acid residues) coverage of the ApoA-IV sequence. Before plotting, each ApoA-IV peptide was manually checked to ensure that Skyline peak picking was consistent across biological replicates. In this regard, Supporting Figure 4 shows the excellent agreement in retention times for these 11 tryptic peptides that were quantified by DIA in the 13 samples. Based on the DIA data, the median fold-change for ApoA-IV tryptic peptides in ovarian cancer relative to control sera is 0.52 with a Student t-test for significance being <.05 for each peptide.
Development of the targeted ovarian cancer proteome assay
With the goal of confirming the decreased level of ApoA-IV and of also developing a PRM assay for rigorously comparing the relative ability of as many other literature biomarkers as possible to detect ovarian cancer, we developed the TOCPA that initially targets ApoA-IV as well as 9 other previously identified biomarkers that were quantifiable in nonfractionated sera. As shown in Supporting Table 7, this effort was initiated by compiling a list of 50 proteins that had been included in 36 previously reported biomarker panels for detecting ovarian cancer. As many of these publications did not include UniProt names or entry numbers for proteins that often have multiple names, this effort was more challenging than had been anticipated. Hence, in addition to the latter information, Supporting Table 7 also contains the recommended as well as commonly used alternative names for these proteins. The biomarker panels in this table contained from 1 to 11 proteins—with an average of 2.5 proteins/panel. The biomarkers that were most frequently included in these panels were Mucin-16, which was included in 15 panels and which is also called the ovarian cancer–related tumor marker CA-125, and apolipoprotein A-1 (ApoA-I), which was included in 5 panels.
As summarized in Supporting Table 8, searches of the Yale Protein Expression Database (YPED)22–24 identified 121 tryptic peptides that had Expect Scores <0.05, mass errors <5 ppm, and that were derived from 41 of the 50 literature biomarker proteins. To determine which of these 121 biomarker peptides could be detected in nonfractionated sera, PRM-targeted analyses on ~45 of these peptides were conducted on pooled ovarian cancer and control sera. Parallel reaction monitoring analyses identified MS/MS spectra from 25 of the 121 targeted tryptic peptides. Although DDA analyses were also conducted on each of the 13 sera samples in this study, these analyses did not identify any additional target peptides. Hence, TOCPA was based on the 25 tryptic peptides that were identified in nonfractionated sera with the use of inclusion lists and the 5 internal standard PRTC peptides listed in Supporting Table 9. After testing TOCPA on 2 pooled samples, with these samples containing equal aliquots of each of the 7 control and 6 ovarian cancer sera, it was used to analyze the 13 individual samples.
Use of the TOCPA PRM MS assay to confirm decreased expression of ApoA-IV in ovarian cancer sera and to determine the relative level of expression of 9 other literature biomarkers
As summarized in Table 1, the TOCPA PRM assay interrogated the level of expression of 25 tryptic peptides from 10 ovarian cancer serum biomarker proteins. Based on 184 transitions, TOCPA provides an average of 18.4 data points/quantified protein. The average technical coefficient of variation of 15.2% (Table 1) that was observed for the 3 technical replicate PRM analyses of the 13 samples is less than the 20% to 35% “best practices” criterion that was established by a National Institutes of Health (NIH) Workshop for research use of MRM assays for quantifying peptides and proteins. 25 As summarized in Supporting Table 10, triplicate analysis of the 13 sera samples with TOCPA quantified 99.7% (8434/8463) of the possible transition peak areas with dotp ⩾0.9 compared with the corresponding library spectra. The only transitions that were not quantified in all samples were those from the ESDTSYVSLK and GYSIFSYATK peptides from C-reactive protein (CRP).
PRM Targeted Ovarian Cancer Proteome Assay (TOCPA) for serum biomarkers.

Abbreviation: CV, coefficient of variation.
Protein included among the 5 proteins in the Food and Drug Administration–approved Ova1 test that can help detect ovarian cancer in a pelvic mass that is already known to require surgery, with the remaining 2 proteins in the Ova1 test being Mucin-16 (CA-125) and β2-Microglobulin (HLA-G).
PRTC = Peptide Retention Time Calibration Mixture from Thermo Fisher Scientific Pierce that contains 15 stable isotope-labeled peptides, with 5 of these peptides being monitored by the TOCPA PRM assay.
For transitions as compared with the corresponding library spectrum.
As shown in Figure 2, PRM analyses determined that 7 (Afamin [AFM], ApoA-I, ApoA-IV, apolipoprotein C-III [ApoC-III]), insulin-like growth factor II [IGF-II], transferrin [TF], and transthyretin [TTR]) of the 10 TOCPA biomarkers were decreased and 3 (CRP, haptoglobin [HP], and serum amyloid A-1 [SAA]) were increased in ovarian cancer as compared with control sera, with the average fold-changes ranging from 0.38 for ApoA-IV to 15.14 for CRP (Supporting Table 11). As suggested by the confidence intervals extending beyond the observed ranges (Figure 2), the observed fold-changes for AFM, ApoC-III, and HP were not statistically significant (ie, P > .05 in Supporting Table 11). In contrast, the differential expression observed for ApoA-I, ApoA-IV, CRP, IGF-II, SAA, TF, and TTR met the generally accepted significance criterion of ⩽.05 (Supporting Table 11). As summarized in Supporting Table 11, the directions of the fold-changes that were observed for the TOCPA PRM assay were in perfect agreement with previous immunological analyses (eg, ELISA and Luminex Multiplex) reported in 8 publications. Indeed, the fold-changes for 4 of the TOCPA biomarkers (AFM, HP, TF, and TTR) were within ±25% of the values determined by immunological assays. With the exception of SAA, whose differential expression in ovarian cancer sera was 4.3-fold higher based on a multiplex bead immunoassay 26 as compared with the TOCPA PRM analysis (Supporting Table 11), the average agreement between the fold-changes determined by immunological versus TOCPA PRM analyses was ±35.1%.

Average ovarian cancer/control protein fold-changes for 10 sera biomarker proteins and 5 of the 15 peptides in the Peptide Retention Time Calibration Mixture internal standard (STDS) in sera samples from 6 ovarian cancer and 7 control (healthy) patients as determined by Skyline analyses of Targeted Ovarian Cancer Proteome Assay PRM data. The bars indicate 95% confidence intervals. CRP indicates C-reactive protein; IGF, insulin-like growth factor; PRM, parallel reaction monitoring; SAA, serum amyloid A-1; TRFE, transferrin, TTHY, transthyretin.
In good agreement with the 0.52 fold-change determined by DIA, the most significant differential expression observed with TOCPA analysis was the 0.38 fold-change in ApoA-IV expression (Supporting Table 11) that had an adjusted P value of .0069. As shown in Figure 3, there was excellent agreement among the 3 technical replicate analyses and also among the 3 peptides that were used to interrogate the relative level of ApoA-IV expression—with the cancer/control fold-changes for the 3 peptides ranging from 0.37 to 0.39. Similarly, as shown in Supporting Figures 5 to 7, there was very good agreement among the fold-changes observed for each of the peptides that were used to interrogate the level of expression of the remaining 9 TOCPA proteins.

Boxplots depicting the relative abundance of 3 apolipoprotein A-IV peptides in sera samples from 6 ovarian cancer patients and 7 control (healthy) individuals quantified in 3 technical replicates by parallel reaction monitoring (PRM) mass spectrometry analysis.
RF analyses of TOCPA PRM data
As RF has been shown to outperform linear discriminant analysis, quadratic discriminant analysis, k-nearest neighbor classification, bagging and boosting classification trees, and support vector machines for identifying optimal disease biomarkers, 27 RF was used to determine the ability of TOCPA to classify ovarian cancer from control sera samples and to estimate the relative importance of each of the 10 biomarkers for this classification. As summarized in Supporting Table 12, the highest accuracy of classification of 92.3% was achieved with RF analyses that were carried out with 10 000 trees. Based on the corresponding sensitivity of 83.3% and specificity of 100.0%, TOCPA is better able to classify control as compared with ovarian cancer sera. To evaluate the relative importance of each of the 10 biomarkers to RF classification, we extracted the protein, peptide, and transition level MDG indexes that are depicted in Supporting Figures 8 and 9 and are shown in Supporting Table 13, respectively. The protein MDG indexes in Supporting Figure 8 indicate that the most important classifier is ApoA-IV, which is followed in decreasing order of importance by CRP, TF, and TTR. As indicated by the 2 arrows, there appear to be “breaks” in the decreasing protein MDG indexes after ApoA-IV and TTR after which the remaining MDG indexes decrease monotonically as indicated by the slanted red line. As expected, the internal standard PRTC peptides, which should not have any significant ability to classify ovarian cancer sera, have a very low MDG index of 0.109 (Supporting Figure 8). As the MDG index of AFM of 0.100 is even lower than that of the PRTC peptides, AFM has no significant ability to act as a biomarker for ovarian cancer.
Although Supporting Figure 9 indicates that all 3 of the ApoA-IV peptides have MDG indexes that are among the highest that were observed (ie, >0.34), the MDG indexes for ApoA-I are striking in that the EQLGPVTQEFWDNLEK (residues 86-101) and DYVSQFEGSALGK (residues 52-64) peptides have very low MDG indexes of 0.02 and 0.0, respectively, whereas the LLDNWDSVTSTFSK (residues 70-83) peptide has one of the highest MDG indexes of 0.57. Although the molecular basis for this wide range in MDG indexes is not known, the high MDG index of the LLDNWDSVTSTFSK ApoA-I peptide is consistent with its larger and more significant fold-change (see Supporting Figure 5) as compared with the other 2 ApoA-I peptides that were interrogated. As shown in Supporting Figure 10, there is reasonable correlation (R2 = 0.60) between decreasing MDG index from the RF analyses and increasing P value from the TOCPA fold-changes, with a P value of .05 corresponding to an MDG index of ~0.5.
The scatter plots in Supporting Figure 11 that depict the mean total transition peak areas from the 3 technical replicate PRM analyses of the 10 TOCPA biomarkers illustrate the limitations in using 9 of these biomarkers for classifying ovarian cancer sera. With the exception of ApoA-IV, there is considerable overlap in the ranges of the mean total transition peak areas for the 6 ovarian cancer with the 7 control sera. As shown, however, by the red arrowhead line in the ApoA-IV graph, it was possible to perfectly classify ovarian cancer versus control samples using a simple mean total transition peak area breakpoint of 5.95E + 07 that corresponds to ~54.4% of the mean total transition peak area of 10.94E + 07 for the controls.
Interestingly, as shown in Supporting Figure 12, the errors in RF sample classification are not randomly distributed among the patient samples. Rather, when 1000 RF analyses were carried out at the protein level with 10 000 trees, all errors result from cancer sample #R827 being classified as a control all of the time (which is evident on the graph) and from control sample #IV1056 being classified as a cancer sample 2 out of 1000 times (which gives an error rate of 0.2% that is too small to be seen on this graph). One possible interpretation of this finding is that there is an important variable that is unique to patient #R827. If this variable could be identified, it might be possible to devise exclusion criteria for RF analysis of TOCPA data that would further improve accuracy and may also increase our knowledge of ovarian cancer. In this regard, Supporting Figure 13 indicates that with the exception of ApoA-IV, the serum levels of the remaining 9 biomarkers for ovarian cancer patient #R827 more closely track with the controls than with the ovarian cancer patients. Simple exclusion criteria that would uniquely eliminate sample #R827 from consideration are ApoA-IV and TTR levels that are within the ranges for ovarian cancer and control patients, respectively. Application of this exclusion criterion to the existing patient cohort would remove patient #R827 from consideration and result in a classification accuracy for the remaining 12 samples of 100% based on ApoA-IV and/or TTR levels (ie, in the TTR scatter plot graph in Supporting Figure 11, the only cancer sample that falls within the range for the controls is #R827) and would be predicted to result in a >99.9% accuracy based on RF analysis with all 10 TOCPA biomarkers.
As shown in Supporting Figure 14, the downward trend in the serum level of ApoA-IV with increasing severity of disease confirms its ability to serve as a biomarker for ovarian cancer. Although the correlation is low (R2 = 0.35), the trajectory of response is consistent with ApoA-IV being a “metabolic” rather than a signaling marker of ovarian cancer (see “Discussion” section).
Discussion
To leverage advances in MS instrumentation that include a 2-fold increase in MS/MS scan rate 28 that enables new platforms to reach deeper than ever before into the complex human proteome, with improved resolution, mass accuracy, and sensitivity needed to identify more proteins with increased selectivity and confidence in protein identification, we implemented a DIA/PRM workflow on the same HR/AM platform for successive discovery and TOCPA validation of ovarian cancer biomarkers. Data-independent acquisition was chosen for discovery because it generates a “complete” MS/MS library of peptides from all proteins in the sample that provides a permanent digital archive that can be re-interrogated as new biomarkers are reported in the literature. This is particularly useful for clinical samples that are in limited amount and often are irreplaceable. Parallel reaction monitoring was chosen for targeted analysis because it yields quantitative data over a wider dynamic range than SRM or, as it is also called, MRM. 29 In addition, the exquisite selectivity of PRM enables it to better separate peptide ions of interest from other interfering peptides in complex proteomes and thus provide improved quantitation, 30 and the increased mass accuracy of PRM provides improved confidence in the assignment of the precursor and fragment ions. 31 The instrument trapping capability of PRM also enhances sensitivity, 32 and by uncoupling data acquisition and processing, PRM simplifies the development of the acquisition method and enables each peptide to be interrogated by 4 to 8 (as opposed to 2-3 for MRM) interference-free transitions that can be chosen post-run. In addition, we have coupled this approach with RF analyses to identify the best protein biomarkers for diagnosing ovarian cancer that can be detected in nonfractionated sera.
The most significantly differentially expressed biomarker that also made the largest contribution to the subsequent RF classification was ApoA-IV. In contrast to 2 previous immunological analyses that indicated that ApoA-IV is decreased by an average of 25% to 28% in ovarian cancer sera,33,34 TOCPA PRM analyses determined that ApoA-IV is decreased by more than twice this amount (ie, 62%) to give an ovarian cancer/control fold-change of 0.38 (Supporting Table 11). The potential significance of this finding, which we suggest may result from cross-reactivity of the polyclonal rabbit antisera that previously has been used to assay for ApoA-IV,33,34 is illustrated in Figure 4B that shows that ApoA-IV is decreased sufficiently in ovarian cancer sera that a simple mean transition peak area breakpoint of 5.95E+07 provides perfect classification of the 6 ovarian cancer (4.27E + 07 ± 1.08E + 07, range: 1.93E + 07 to 5.44E + 07) from the 7 control (10.94E + 07 ± 4.14E + 07, range: 6.46E + 07 to 20.23E + 07) sera used in this study. In contrast, Dieplinger et al 34 reported extensive overlap in the ranges of ApoA-IV in ovarian cancer (0.3-29.5 mg/dL) with both benign disease (2.0-32.3 mg/dL) and healthy control (5.5-34.0 mg/dL) patient sera. Similarly, Figure 4A shows the considerable overlap reported by Timms et al 33 for ApoA-IV in ovarian cancer versus benign sera. Although it is possible that TOCPA analyses on larger numbers of samples will find some overlap in the ranges of ApoA-IV in control versus ovarian cancer sera, the available TOCPA data suggest that ApoA-IV is a better serum biomarker for ovarian cancer than had been determined previously by immunological analyses.

Comparison of relative apolipoprotein A-IV concentrations in sera from control versus ovarian cancer patients as determined by (A) enzyme-linked immunosorbent assay by Timms et al 33 (copyright Wiley-VCH Verlag GmbH & Co. KGaA, reproduced with permission) and by (B) the TOCPA PRM assay. The bars in panel “A” indicate the median values along with the interquartile range. The red arrow in panel “B” at 5.95E + 07 is a breakpoint that perfectly separates the 6 ovarian cancer from 7 control sera samples. PRM indicates parallel reaction monitoring; TOCPA, Targeted Ovarian Cancer Proteome Assay.
Our premise, however, is that additional studies on independent patient cohorts that are limited to early-stage disease will indeed find at least some overlap in the ranges of ApoA-IV expression in sera from control versus ovarian cancer patients and that expansion of an ovarian cancer serum biomarker panel beyond the 1 to 3 proteins (eg, the average number of proteins in the 36 biomarker panels in Supporting Table 7 is 2.4) that typically have been reported in the literature will be required to achieve the >80% sensitivity and 99.6% specificity for early-stage disease that is needed for a clinically useful screening test. 7 Hence, we used TOCPA to not only confirm the differential expression of ApoA-IV that was uncovered by DIA but also to determine the relative ability of as many other previously reported biomarkers as possible that can be quantified in the nonfractionated sera that would be most amenable for clinical assays. As shown in Supporting Table 12, with a sensitivity of 83.3% and specificity of 100%, RF analyses of data from the current version of TOCPA exceed the minimum requirements for a clinically useful test for identifying ovarian cancer in the patient cohort used in this study. These patients had newly diagnosed ovarian cancer that ranged from stage 1C to advanced disease with disseminated carcinomatosis that had spread throughout the peritoneal cavity (Supporting Table 1). As we anticipate that the classification accuracy will decline when cohorts are limited to stage 1 patients, we took 2 approaches to further improve the accuracy of classification. These included (1) developing criteria for excluding patients whose serum levels of TOCPA biomarkers suggest they may not be well classified by this approach and (2) optimizing the existing panel of biomarkers as we expect that the accuracy of classification can be improved by deleting TOCPA biomarkers such as AFM that do not significantly contribute to the classification accuracy. In addition, in the future we will use fractionation (eg, strong cation exchange high-performance liquid chromatography) and/or enrichment approaches to reach deeper into the serum proteome to obtain the spectra needed to bring other literature and new ovarian cancer biomarkers into the next version of TOCPA.
The notion of developing exclusion criteria for the use of the TOCPA/RF approach was prompted by the unexpected finding in Supporting Figure 12 that >99% of the RF classification errors resulted from a single serum sample from ovarian cancer patient #R827. Indeed, this ovarian cancer sample is unusual in that with the exception of ApoA-IV, the serum levels of the remaining 9 biomarkers in this patient’s serum more closely track with the controls than with the ovarian cancer patients (Supporting Figure 13). Based on sample #R827 having the lowest levels of CRP and SAA observed for any ovarian cancer patient sera, it appears that this stage IIC patient (Supporting Table 1) did not have a typical acute-phase response to ovarian cancer, and for that reason, this sample is not well classified using the current TOCPA biomarker panel. Simple exclusion criteria that could be used to uniquely eliminate patient #R827 from the current cohort and presumably to identify similar patients in future cohorts are ApoA-IV and TTR levels that are within the ranges for ovarian cancer and control patients, respectively. If future studies confirm these findings, then imaging and other tests could be used for screening these excluded patients for ovarian cancer.
Based on their having adjusted P values of <.04 for differential expression in ovarian cancer sera and on their having the highest observed MDG indexes, the “Top 4” TOCPA biomarkers are ApoA-IV (MDG index = 1.43), CRP (MDG index = 0.98), TF (MDG index = 0.85), and TTR (MDG index = 0.75). The 7 remaining TOCPA biomarkers have MDG indexes that decrease monotonically from 0.49 to 0.10 and include 3 biomarkers (HP, ApoC-III, and AFM) whose P value for differential expression in ovarian cancer does not meet the generally accepted minimum of .05 for biostatistical significance (Supporting Table 11). As only 2 of the Top 4 biomarkers are in the Food and Drug Administration–approved OVA1 test, 35 which includes TF, TTR, ApoA-I, β2-microglobulin, and Mucin-16, which is also called CA-125, that is used to help guide treatment of pelvic masses in women destined for surgery, improving the OVA1 test by incorporating ApoA-IV and CRP would seem to represent an important and urgent area of research. In this regard, comparison of the following ApoA-IV/ApoA-I parameters—ovarian cancer/control fold-changes: 0.38/0.71 (Supporting Table 11), P values for these changes: 0.0069/0.0352 (Supporting Table 11), RF MDG indexes: 1.43/0.49 (Supporting Figure 8), and the extensive overlap in the ranges of ApoA-I that were observed in sera from ovarian cancer versus control patients (ie, as shown in Supporting Figure 11, 5 of the 13 [38.5%] data points overlap) that contrasts with the ability of a simple ApoA-IV breakpoint to perfectly separate ovarian cancer from control sera (Supporting Figure 11)—suggests that the OVA1 assay may be significantly improved by substituting ApoA-IV in place of ApoA-I. Similarly, as the MDG index for CRP (0.98, Supporting Figure 8) is greater than that of TF (0.85), we believe the OVA1 test may be improved further by adding or substituting CRP in place of TF.
Apolipoprotein A-IV belongs to the apoA1/C3/A4/A5 gene cluster. 36 Proteins in this cluster are involved in lipid and lipoprotein metabolism. Apolipoprotein A-IV is a 46-kDa glycoprotein that is primarily produced in intestinal enterocytes and secreted into the lymph. Apolipoprotein A-IV was first identified as a component of chylomicrons and high-density lipoproteins. 37 Apolipoprotein A-IV appears to play a central role in lipid absorption, transport, and metabolism within the reverse cholesterol transport pathway. As there is no evidence that significant amounts of ApoA-IV are expressed in ovarian tissue, it is not clear why ovarian cancer results in a decreased circulating level of ApoA-IV. However, based on the PRM analyses summarized in Figure 2, it appears that at least 3 members of this gene family (ie, ApoA-I, ApoA-IV, and ApoC-III) that are reflective of nutritional status are coordinately repressed in ovarian cancer.
C-reactive protein and SAA, which TOCPA found to be upregulated by 15.1- and 5.3-fold, respectively, in ovarian cancer sera, are major components of the acute-phase response.38,39 Several studies have reported that elevated serum concentrations of CRP are associated with ovarian cancer,26,40–44 and both Edgell et al 26 and Helleman et al 45 have made the same observation for SAA. Serum levels of CRP are correlated with interleukin-6, and high CRP concentration is a significant factor in prognosis of ovarian cancer.42,43 Indeed, high CRP has been reported to be a risk factor for developing ovarian cancer. 44
In plasma, nonglycosylated TTR is involved in the transport of thyroid hormones and retinol. As it is a “visceral” protein that is synthesized in the liver in response to nutritional supply, TTR is a sensitive marker for malnutrition because both the level of protein synthesis and energy intake are reflected in its serum levels.46,47 Serum levels of TTR, however, are also affected by acute and chronic diseases associated with an acute-phase response. Under these conditions, liver activity is converted to the synthesis of “positive” acute-phase response proteins, resulting in a drop in “negative” acute-phase proteins, such as TF, which is involved in iron transport, 48 and TTR despite adequate nutritional supply.39,49 Gericke et al 50 found that serum TTR levels decline with increasing severity of disease, suggesting that TTR is negatively regulated by inflammation caused by ovarian cancer. In good agreement with TOCPA analyses (Supporting Table 11), Su et al 51 found that TTR and TF are reduced by 45% and 30%, respectively, in sera from ovarian cancer patients. Hence, we postulate that the acute-phase response elicited by ovarian cancer results in the direct increase in the levels of CRP and SAA and the indirect decrease in the levels of TF, TTR, and ApoA-IV observed by TOCPA.
Although the limited funding from the Pilot Project grant (see Funding Sources) that supported this study did not permit analyses of larger numbers of samples or of samples from an independent patient cohort to validate our preliminary findings, the research described in this work does suggest ways to improve the OVA1 assay and it provides a rigorous TOCPA PRM/RF approach, which quantifies each protein based on the average of 18.4 data points, that leverages >30 years of ovarian cancer biomarker research, and it also provides 4 promising biomarkers to speed the search for a panel that can serve as the basis for the development of a clinical assay for the early detection of ovarian cancer. Moreover, TOCPA can be easily modified to delete less important biomarkers, which should further increase classification accuracy, and/or expanded to include as many as 60 to 70 proteins using a scheduled PRM assay that interrogates the expression of each biomarker based on 3 naturally occurring and 3 matching “heavy” stable isotope-labeled synthetic peptide internal standards that provide further confirmation of the identity of each peptide and that also allow “absolute” quantitation. In addition, a novel patient exclusion criterion has been uncovered that has the potential to further improve the ability of the TOCPA assay to identify sera from patients with ovarian cancer. We suggest that the “next step” for developing a biomarker panel for the early detection of ovarian cancer is to validate the current findings by using the TOCPA/RF approach to analyze sera samples from an independent patient cohort that is limited to healthy and stage 1 ovarian cancer patients. Following their validation, it then would be important to conduct similar studies on sera from patients with other types of cancer to determine whether the differential expression of TOCPA biomarkers results from a “general” acute-phase response to cancer or whether this response is specific to ovarian cancer. Finally, the novel DIA/PRM/RF workflow implemented in our study can be used for the discovery, validation, and ranking of the relative efficacies of the protein biomarkers for virtually any other disease.
Footnotes
Acknowledgements
The authors thank Kathrin Wilczak, Jean Kanyo, and Edward Voss from the Yale MS & Proteomics Resource for their assistance with sample preparation.
Peer review:
Four peer reviewers contributed to the peer review report. Reviewers’ reports totaled 717 words, excluding any confidential comments to the academic editor.
Funding:
The author(s) disclosed receipt of the following financial support for the research, authorship, and/or publication of this article: The research reported in this publication was supported by a Yale School of Public Health Ovarian Cancer Research Pilot Grant ($25,000 direct costs) from the Tina Brozman Foundation.
Declaration of conflicting interests:
The author(s) declared no potential conflicts of interest with respect to the research, authorship, and/or publication of this article.
Author Contributions
NR, TTL, and KRW conceived and designed the experiments. NR, GP, and KRW analyzed the data. NR, GP, and KRW wrote the first draft of the manuscript. NR, GP, and KRW contributed to the writing of the manuscript. All authors agree with manuscript results and conclusions. NR, GP, and KRW jointly developed the structure and arguments for the paper. All authors made critical revisions and approved final version of the manuscript.
References
Supplementary Material
Please find the following supplemental material available below.
For Open Access articles published under a Creative Commons License, all supplemental material carries the same license as the article it is associated with.
For non-Open Access articles published, all supplemental material carries a non-exclusive license, and permission requests for re-use of supplemental material or any part of supplemental material shall be sent directly to the copyright owner as specified in the copyright notice associated with the article.