
Abstract
Background:
Methylation at 5 CpG sites was previously shown to classify chronic lymphocytic leukemia (CLL) into 3 prognostic subgroups. Here, we aimed to validate the marker set in an additional cohort and to evaluate its clinical utility for CLL patient stratification.
Methods:
We evaluated this epigenetic marker set in 79 German patients using bisulfite treatment followed by pyrosequencing and classification using a support vector machine-learning tool.
Results:
The n-CLL, i-CLL, and m-CLL classification was detected in 28 (35%), 10 (13%), and 41 (51%) patients, respectively. Epigenetic grouping was associated with IGHV mutational status (P = 2 × 10⁻¹²), isolated del13q (P = 9 × 10⁻⁶), del17p (P = .015), complex karyotype (P = .005), VH-usage, and clinical outcome as time to first treatment (P = 1.4 × 10⁻¹²) and overall survival (P = .003). Multivariate Cox regression analysis identified n-CLL as a factor for earlier treatment hazard ratio (HR), 6.3 (95% confidence interval [CI] 2.4-16.4; P = .0002) compared to IGHV mutational status (HR 4.6, 95% CI 1.9-11.3, P = .0008). In addition, when comparing the prognostic value of the epigenetic classification system with the IGHV classification, epigenetic grouping performed better compared to IGHV mutational status using Kaplan-Meier estimation and allowed the identification of a third, intermediate (i-CLL) group. Thus, our study confirmed the prognostic value of the epigenetic marker set for patient stratification in routine clinical diagnostics.
Introduction
Chronic lymphocytic leukemia is characterized by a high variability in disease outcome. While some patients have an indolent disease for several years, others require immediate treatment. 1 Stratification of patients at an early stage facilitates clinical management and several prognostic scores have already been developed. One of these, the international prognostic index for CLL (CLL-IPI), scores 5 variables: the mutational status of the Immunoglobulin heavy variable region gene (IGHV), deletions and mutations of the Tumor Protein P53 (TP53) gene, Beta-2-microglobulin protein (B2M) serum levels as well as age and clinical stage. 2 In addition, recently the international prognostic score for asymptomatic early-stage patients (IPS-E) was developed, aiming to stratify patients that will require early treatment from those with an indolent disease. The IPS-E scores IGHV status, lymphocyte count, and the presence of palpable lymph nodes and is therefore cost-effective and easy to apply. 3
In addition to these well-established markers, the profiling of global DNA methylation in normal B-cell subsets and CLL cohorts has resulted in 3 epigenetic subgroups of CLL patients, presumably corresponding to the B-cell developmental stage from which the tumor arose.4,5 Consequently, Kulis et al named these epigenetic subgroups naïve B-cell like CLL (n-CLL), intermediate CLL (i-CLL), and memory B-cell like CLL (m-CLL). Similarly, Oakes et al defined 3 subgroups which they named low, intermediate, and high-programed CLL. A prognostic impact of the epigenetic classification was revealed with n-CLL having a poor, i-CLL an intermediate, and m-CLL a favorable prognosis. 4
Subsequently, Queirós et al 6 identified a 5 CpG marker set that was sufficient to classify the patients into the 3 epigenetic groups. Moreover, it was shown that the DNA methylation at these sites was stable over time and was not influenced by treatment. 6 Previous studies revealed a strong correlation of n-CLL with unmutated IGHV (IGHV-U) and m-CLL with mutated IGHV (IGHV-M) and an intermediate IGHV mutational load for i-CLL.4,6-8 In addition, the 5 marker set was shown to be a predictor of time to first treatment and overall survival in retrospective, mainly early-stage cohorts.6,7 Recently, the epigenetic classification was evaluated in a prospective study of 3 UK trials (CLL4, ARCTIC, and ADMIRE) and its prognostic impact was confirmed. 8
This study validated the m-CLL subgroup as a marker of prolonged survival and revealed that the epigenetic classification was able to divide IGHV-mutated CLL into clinically relevant subgroups with different times to first treatment and overall survival. Although the epigenetic subgroups did not associate with treatment response, an association with progression free survival (PFS) was observed, revealing longer PFS in the m-CLL subgroup. 8
In previous studies, apart from a Swedish cohort 7 and samples from the CLL genome project of the International Cancer Genome Consortium, mainly patients from the UK were analysed.4,6,8 Here, using a retrospective study design, we evaluated the 5 marker set in a German pilot cohort of 79 patients. We observed an association of the epigenetic marker set with the clinical course of disease, confirming the capability of these markers to distinguish prognostic subsets of CLL patients.
Material and Methods
Patients
Patient peripheral blood samples were collected at the University Clinic of Cologne after written informed consent had been obtained and specimens were obtained from the local Biobank.
Since it has been previously shown that treatment does not affect the methylation of the 5 marker CpGs, 6 samples with and without treatment were analyzed together. Clinical data were obtained from medical records. Initially, 80 patients were evaluated, however 1 patient of the m-CLL group was rediagnosed as a mantle-cell lymphoma patient during the course of the study and was therefore excluded from further analyses. Staging of patients was performed according to Binet with patients with no more than 2 areas of lymphadenopathy, no anemia or thrombocytopenia staged as A, patients with more than 2 areas of lymphadenopathy, no anemia or thrombocytopenia staged as B and patients with anemia or thrombocytopenia (hemoglobin <10 g/dl or platelets <100 000/mm3) staged as C. 9 Data on established biomarkers such as IGHV mutational status, TP53 mutations and fluorescence in situ hybridization (FISH) on metaphase chromosome spreads were available for a subset of patients. IGHV mutational status was analyzed according to standard methods using a cutoff of 98% nucleotide identity to germline for classification. 10 IGHV loci with a germline identity below 98% were classified as mutated (M-CLL) and IGHV with a germ line identity of 98% or above as unmutated (U-CLL). Peripheral blood B cells were isolated via negative RosetteSep immunodensity based cell separation (Stemcell Technologies, Vancouver, Canada). CLL B-cell purity was confirmed at ⩾90% of cells co-expressing CD5/CD19 by flow cytometry.
Methylation analyses
Pyrosequencing assays of 5 CpGs: cg00869668 (chr17: 1 549 013; promoter region of SCARF1); cg11472422 (chr17: 80 926 014; B3GNT6L1), cg17014214 (chr10: 126 713 639; CTBP2), cg09637172 (chr6: 31 545 252; TNF), cg03462096 (chr14: 56 157 197; chromosome 14 intergenic region) were performed using previously published primer sequences. 6 Genomic positions refer to hg19. In brief, 200 ng of DNA were bisulfite (BS) converted using the Epitect bisulfite kit (Qiagen, Hilden, Germany) according to the manufacturer’s recommendations. About 20 ng of the BS-converted DNA was amplified using the Pyromark PCR kit (Qiagen) using the manufacturer’s recommendations at an annealing temperature of 55°C. Subsequently, PCR products were denatured on a vacuum workstation (Qiagen) and pyrosequencing was performed on a PSQHS96A (Qiagen) using Pyromark Gold Q96 reagents (Qiagen). Bisulfite converted unmethylated and methylated control DNA (Epitect control DNA, Qiagen) were used in each pyrosequencing run. The % methylation values were calculated with the PSQHS96A 1.2 software, divided by 100 and used as input for the epigenetic classification.
Statistical analyses
Epigenetic classification of the patients was performed as previously described using a support vector machine-learning tool. 6 Calculation of Pearson’s correlation and graphical representation of the methylation values were performed using GraphPad Prism 7. Categorical and ordinal data shown in Table 1 were analyzed using Fisher’s exact probability test with the Freeman-Halton extension for a 2 × 3 contingency table and with the Kruskal-Wallis test, respectively, using Vassarstats (www.vassarstats.net) accessed on January 23rd, 2021 and on August 20th, 2021. The Kruskal-Wallis test calculates 2 P-values: PA and PB. PA calculates the probability of the observed array of cell frequencies plus the sum of the probabilities of all other cell-frequency arrays that are equal to or smaller than the probability of the observed array, whereas PB calculates the probabilities of all other cell frequencies that are smaller than the probability of the observed array. In the case where PA and PB resulted in different P-values, both P-values are given. Time to first treatment (TTT) and overall survival (OS) were calculated by Kaplan-Meier estimates and pairwise comparisons between the epigenetic classes were done by means of the log-rank test (Monte-Carlo) using GraphPad Prism 7. P-values are 2-tailed and considered significant when below 5%. Time to first treatment was defined as the date of diagnosis to the date of first treatment (event) or the date of the last clinical visit or death (censored). Time to death was defined as the date of diagnosis to the date of death (event) or the date of the last clinical examination (censored). Multivariate Cox proportional hazard analysis to evaluate the prognostic value of the epigenetic classification was calculated with SciStat (www.scistat.com) accessed on October 2nd, 2021 using a backward elimination model, whereby variables above a P-value threshold of >.1 were eliminated from the model and variables with a P-value <.05 remained in the model.
Clinicobiological characteristics of the epigenetic groups.

Abbreviations: F, female; M, male; ns, not significant.
P-values were calculated using a Kruskal-Wallis test for ordinal data and Fisher’s exact test for categorical data.
Results
Within this study, we evaluated a prognostic epigenetic classification system 6 in a German cohort of 79 patients using a retrospective study design. DNA methylation at 5 marker CpG sites was evaluated and used to classify the patients into 3 epigenetic groups. Within our cohort, 28 patients (35%) were classified as n-CLL, 10 (13%) as i-CLL, and 41 (51%) as m-CLL (Figure 1A). Clinicobiological features and methylation values for the individual patients are given in Supplementary Table 1.
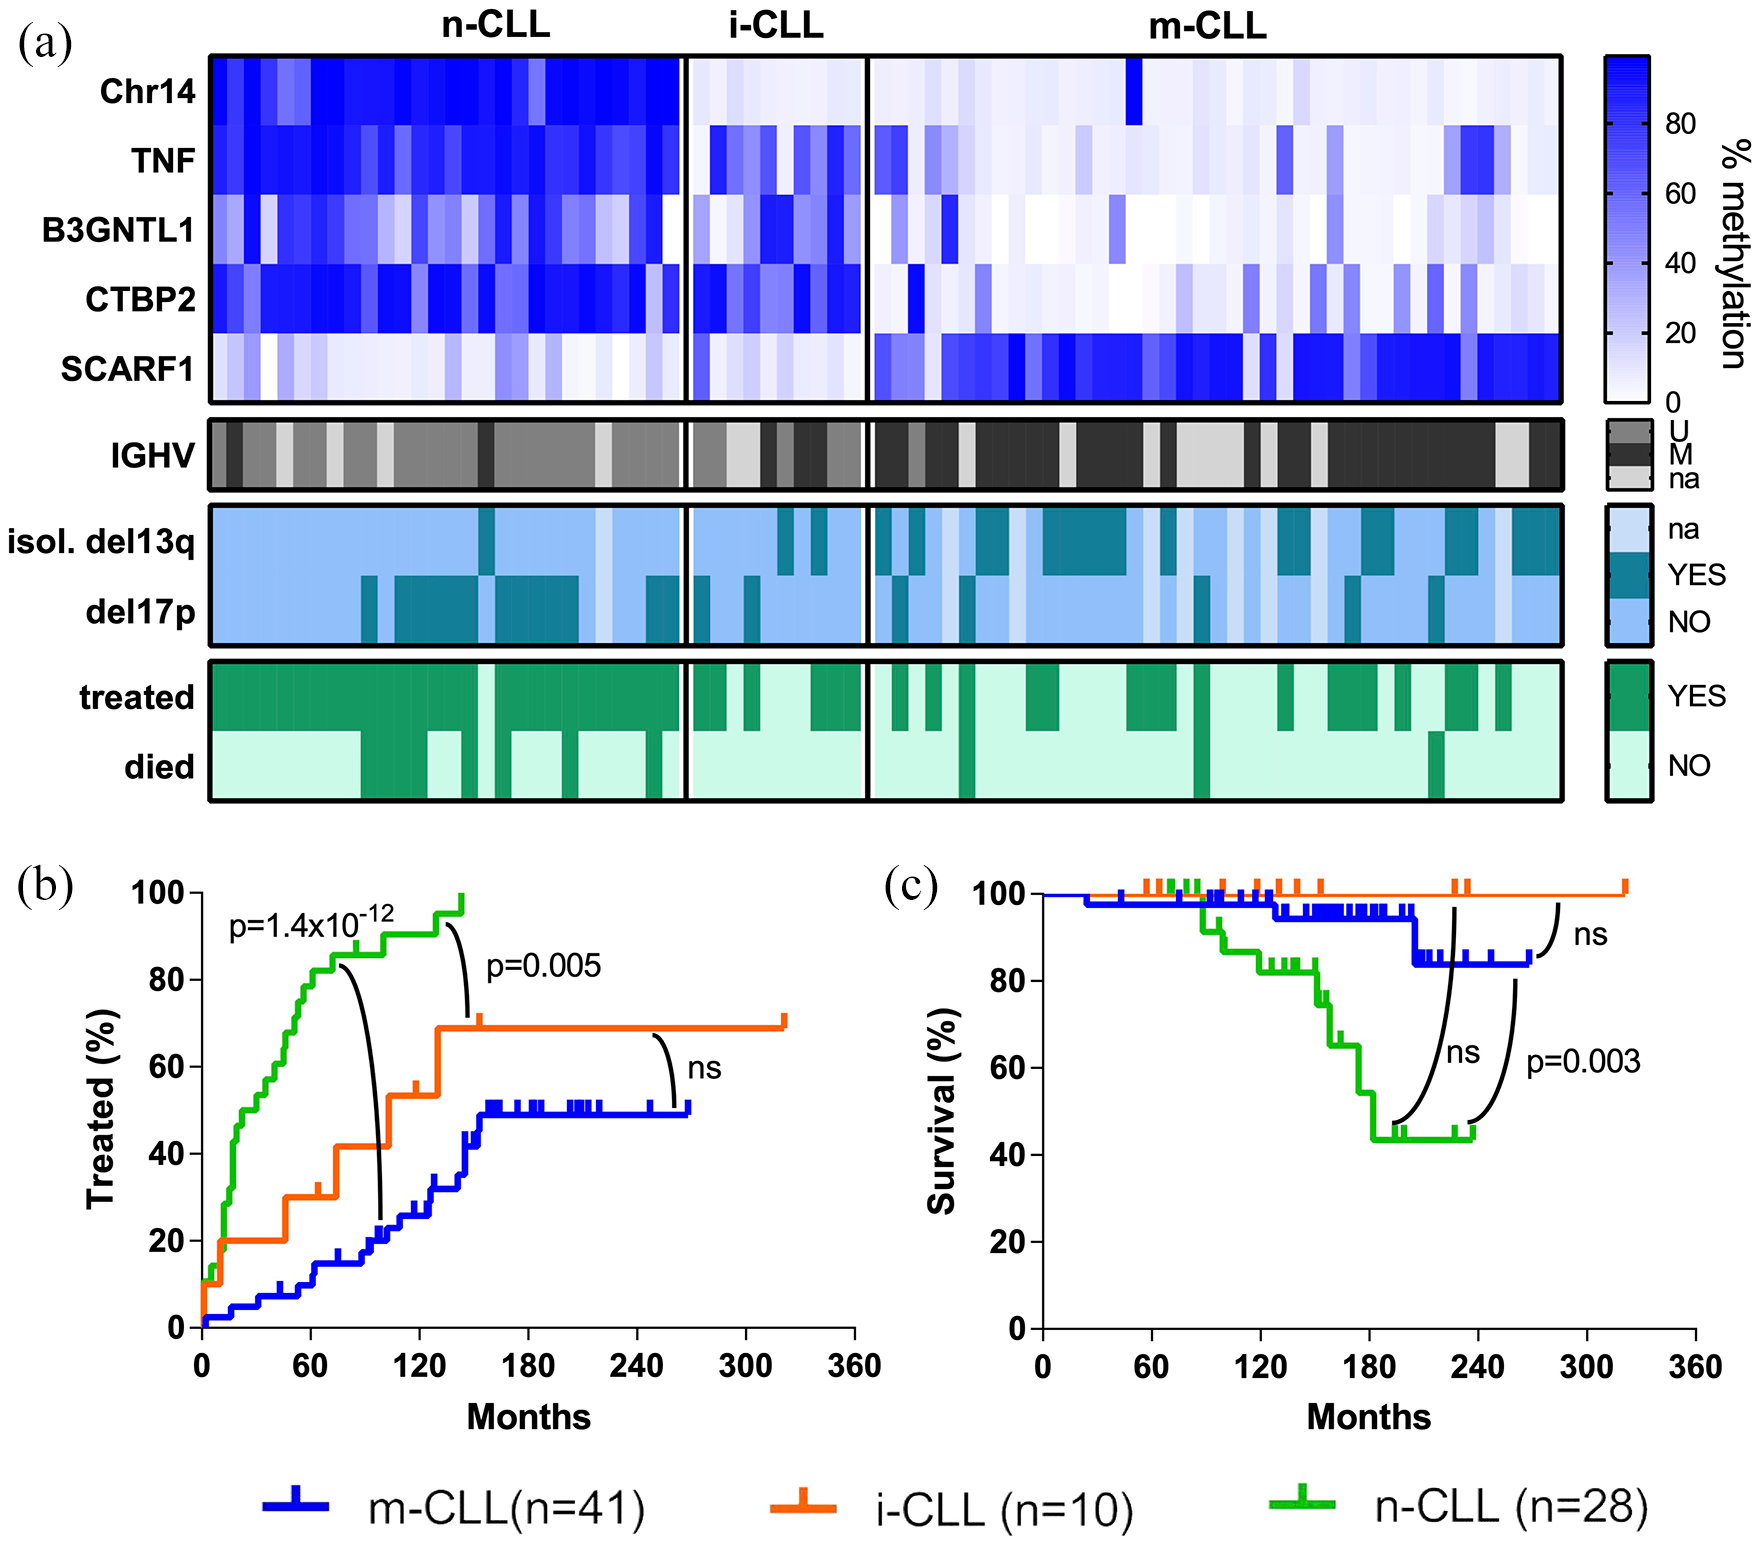
Epigenetic classification has a prognostic impact in CLL. (A) Heatmap of the DNA methylation percentage for the 5 marker CpGs grouped by epigenetic classification. The CpGs on Chr14, TNF, B3GNTL1, and CTBP2 are generally unmethylated in m-CLL, whereas n-CLL shows an inverse methylation profile. For i-CLL, most patients are unmethylated at the Chr14 marker CpG (like m-CLL) and at SCARF1 and methylated at TNF, B3GNTL1 and CTBP2 (like n-CLL). Below, the IGHV mutational status is given, revealing an enrichment of IGHV-M in the m-CLL subgroup. (B, C) Kaplan-Meier plots of the epigenetic groups showing (B) time to first treatment and (C) survival. Censored patients are indicated by a tick mark.
Association of epigenetic grouping with clinico-biological features
Next, we assessed the association of the epigenetic subgroups with additional clinical and biological features (Table 1) and observed significant associations with the IGHV mutational status, with unmutated IGHV in 92% (22/24) of n-CLL, 63% (5/8) of i-CLL, and 3% (1/30) of m-CLL cases (P = 2 × 10⁻¹², Fisher’s exact test comparing 3 groups) as previously reported.4,6-8
Moreover, variable heavy chain (VH)-usage was different between the groups: all 9 cases with VH1-69 usage in our cohort were within the n-CLL group (PB = 10−4; Fisher’s exact test comparing 3 groups) and although not reaching significance, all 4 patients with VH3-23 usage were detected among the m-CLL cases.
Another genetic alteration that was significantly different between the epigenetic groups was isolated del13q (P = 9 × 10⁻⁶, Fisher’s exact test comparing 3 groups), that was highly enriched in the m-CLL group consisting 58% (19/33) of the m-CLL cases and is known to confer a favorable prognosis. In addition, deletion of the short arm of chromosome 17 (del17p), a factor associated with poor prognosis, was enriched in the n-CLL subgroup present in 48% (13/27) of the n-CLL cases (P = .015, Fisher’s exact test comparing 3 groups). We did not observe any significant association of the epigenetic subgroup with age, sex, del11q, tri12, or TP53 mutations. However, the presence of a complex karyotype was significantly different in the 3 groups (P = .005, Fisher’s exact test) with 73% (16/22) of the n-CLL cases present with a complex karyotype compared to 43% (6/14) in the m-CLL group.
Prognostic impact of epigenetic grouping
Our cohort was comprised of 50 treated and 29 non-treated cases (median follow-up after diagnosis 150 months, range 24-321 months). Of the patients requiring treatment, 17 were sampled before (0-66 months, mean 22) and 33 after treatment start (2-161 months, mean 69). The time of sampling in regard to treatment start differed between the 3 epigenetic groups (P = .004, Fisher’s exact test), with 19% (5/27) of n-CLL, 17% (1/6) of i-CLL, and 64% (11/17) of m-CLL cases sampled before treatment start. Although sampling time with regard to treatment was significantly different between the 3 epigenetic groups, the time from diagnosis to sampling was not significantly different (Table 1, Supplementary Table 1).
In total, 96% (27/28) of the n-CLL, 60% (6/10) of the i-CLL, and 41% (17/41) of the m-CLL cases were treated (P = 2 × 10⁻⁶, Fisher’s exact test comparing 3 groups). In addition, time to first treatment (TTT) was significantly different between the epigenetic groups, with a median TTT of 26 months for n-CLL, 103 months for i-CLL, and non-reached for m-CLL. Pairwise comparisons using a Monte-Carlo log-rank test revealed significant differences in time to first treatment for n-CLL versus m-CLL (P = 1.4 × 10⁻¹²) and n-CLL versus i-CLL (P = .005, Figure 1B).
Within the evaluated period 14% (11/79) of the patients died: 29% (8/28) of the n-CLL, none of the i-CLL, and 7% (3/41) of the m-CLL cases (P = .03, Fisher’s exact test comparing 3-groups) with median survival times of 182 months for n-CLL and non-reached for i- and m-CLL. A pairwise comparison of n-CLL and m-CLL resulted in a P-value of .003 (Monte-Carlo log-rank test, Figure 1C).
Moreover, Binet staging 9 at diagnosis and sampling was significantly different between the 3 epigenetic groups (P = .008 and P = .00002, respectively, Table 1). The increased difference of Binet staging between the epigenetic groups at sampling, again indicates a prognostic value of the epigenetic classification.
To analyze this further, we analyzed the progression of patients staged Binet A at diagnosis. From 44 patients with Binet A at diagnosis for which staging was available at sampling 14 progressed to B/C. The progression from Binet A to B/C was slightly different between the epigenetic groups (P = .03) and occurred to a lesser extent in m-CLL cases (Table 1).
Comparison of epigenetic classification with IGHV status
Since IGHV status is one of the strongest predictors of the clinical progress, we compared the prognostic value of the epigenetic classification with the IGHV status. Information on IGHV status was available for 62 patients and we performed a Kaplan-Meier analysis. Although, epigenetic classification and IGHV status were highly correlated, m-CLL and n-CLL grouping were better predictors compared to the IGHV status for TTT and OS (P = 7.4 × 10⁻¹² vs P = 2.6 × 10⁻⁹ and P = .005 vs .011, respectively; Supplementary Figure 1). From 24 n-CLL cases 22 were IGHV-U and 2 IGHV-M and from 30 m-CLL 29 were IGHV-M and 1 IGHV-U. Thus, only 3 cases are discordant between the 2 classification systems. The main difference of the epigenetic classification to the IGHV classification is the introduction of a third group with intermediate prognosis, i-CLL, which consisted of 5 IGHV-U and 3 IGHV-M cases.
Multivariate Cox regression analysis
Next, we evaluated the prognostic value of the epigenetic classification using a multivariable Cox-regression analysis for time to first treatment (Table 2). Since epigenetic classification and IGHV mutational status are correlated, we performed multivariate regression analyses separately for both markers and the results suggest that epigenetic grouping (HR 6.3, P < .0002) might be a better predictor compared to IGHV-status (HR 4.6, P < .0008).
Multivariate Cox regression analysis for TTT.
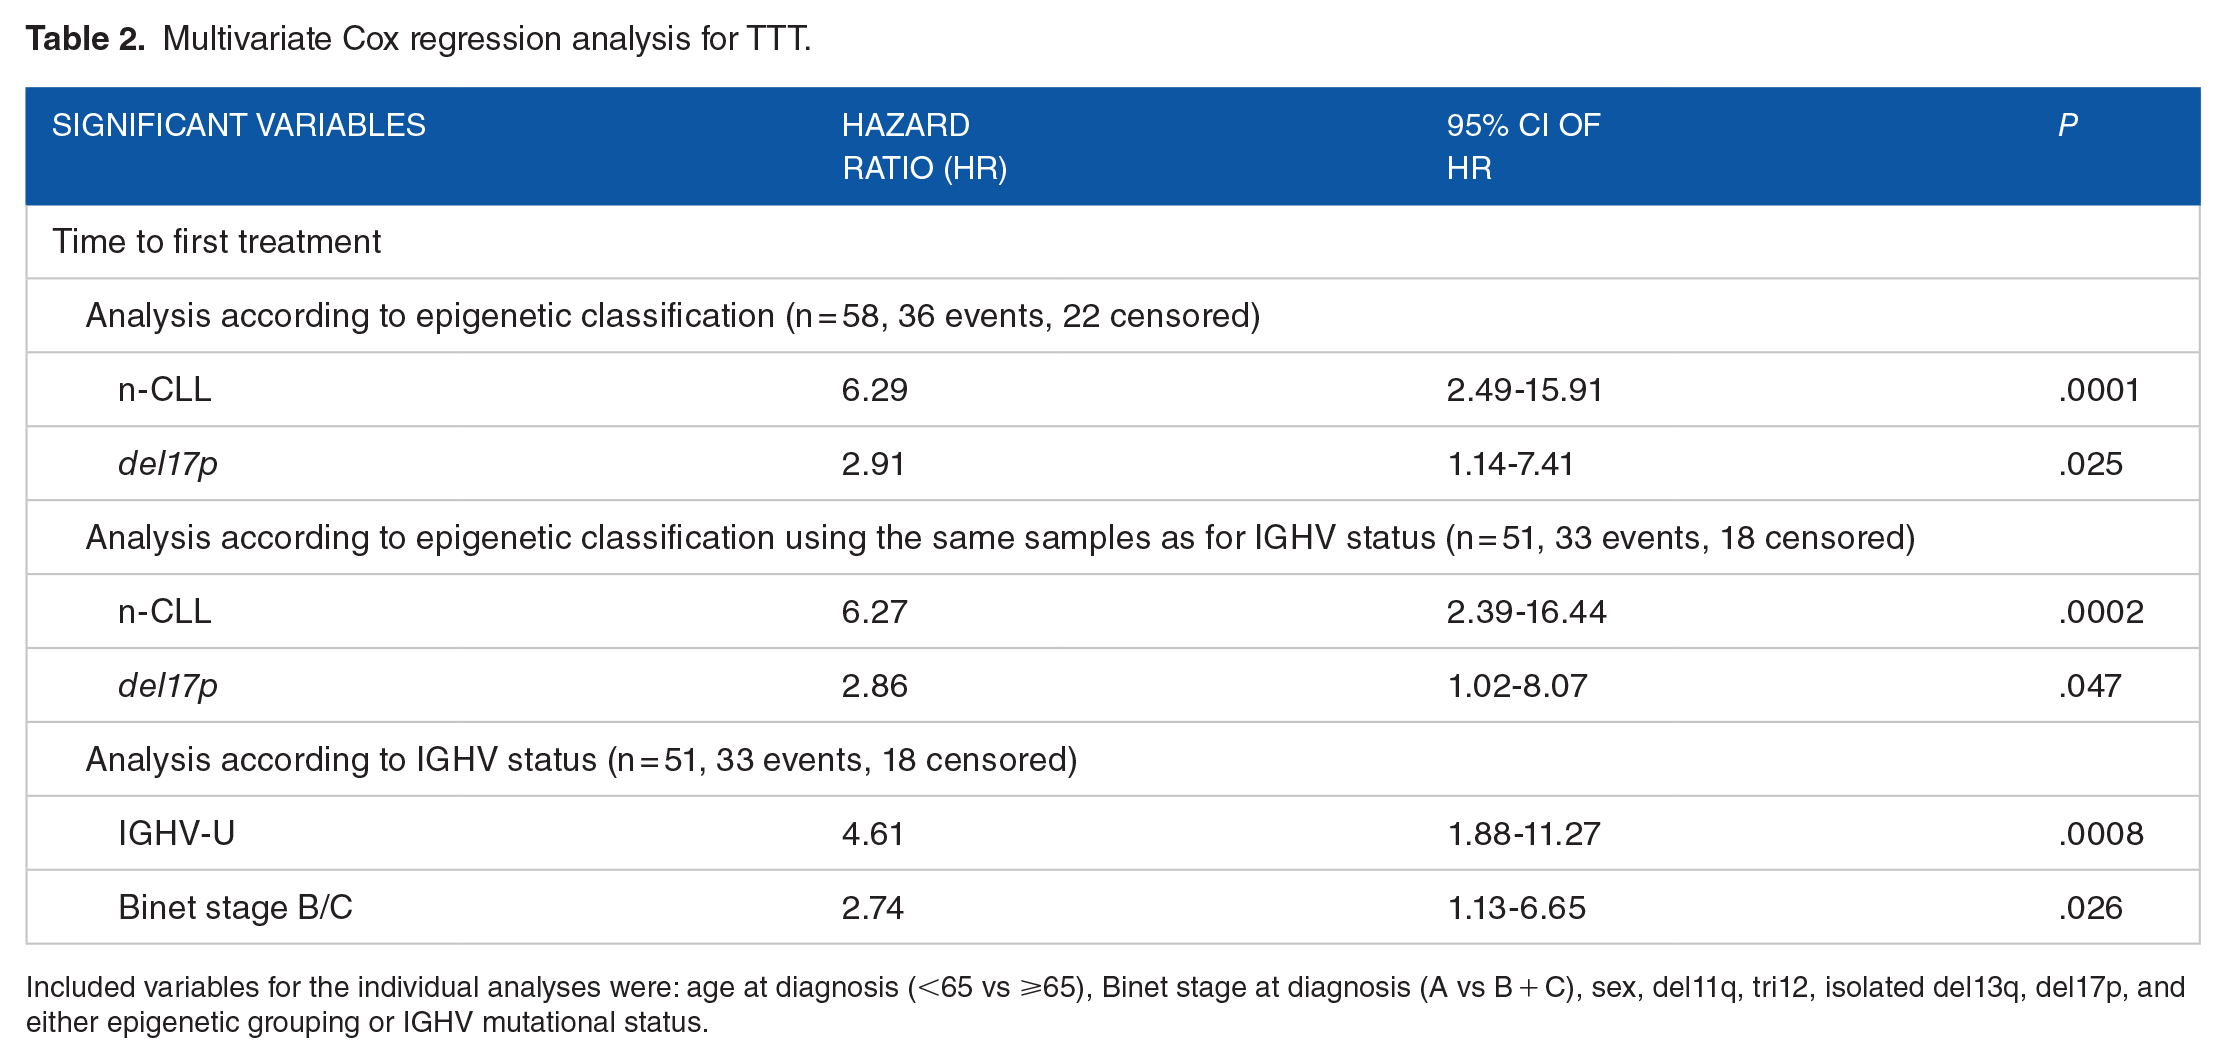
Included variables for the individual analyses were: age at diagnosis (<65 vs ⩾65), Binet stage at diagnosis (A vs B + C), sex, del11q, tri12, isolated del13q, del17p, and either epigenetic grouping or IGHV mutational status.
We did not perform a multivariate Cox regression analysis for death as an endpoint since in our cohort only 11 patients deceased.
Discussion
We confirmed the prognostic value of the 5 epigenetic marker set for patient stratification in a German cohort of 79 cases. To the best of our knowledge it is the first study testing the epigenetic marker set in a German cohort with a larger number of late stage patients.
To date, the epigenetic marker set was already tested in patient cohorts from the UK, 8 Sweden, 7 and from the International CLL consortium. 6 Here, we added a German cohort. CLL is influenced by genetic factors which is reflected by the facts that (i) CLL occurs mainly in Western populations and is rarely seen in Asians, 11 and (ii) the risk of first degree relatives is increased by approximately 7-fold. 12 Although, environmental factors, like infections and nutrition are presumably involved in disease etiology, the low incidence in Asians is most likely not due to environmental factors since also Asians living in the USA have a low incidence in developing CLL. 13 Interestingly, also in Western countries, which can be assumed to be genetically more similar than Asians and Caucasians, the highest incidences for CLL were observed in Italy, Ireland, USA, and Australia. 14 Therefore, the classification system should be validated in different cohorts to strengthen its utility in clinical settings. The inclusion of later stage patients in a study analyzing a prognostic marker set revealed its utility also in later stage patients. A finding that is in line with the observation that epigenetic grouping remains stable during disease progression and is not influenced by treatment. 6 Of the currently used prognostic markers in CLL, only IGHV status remains stable over time, whereas all others, like that is, B2M level, TP53 mutations, or chromosomal aberrations might change upon disease progression.
In line with previous reports, we observed a significant association of the epigenetic classification with clinical outcome, whereby m-CLL is associated with a favorable outcome and n-CLL with a poor prognosis requiring earlier treatment. Moreover, we detected a strong association of the epigenetic subgroups with IGHV mutational status, with m-CLL being associated with mutated IGHV and n-CLL with unmutated IGHV.4,6-8
The strong association between IGHV status and epigenetic grouping raises the question if epigenetic grouping is just a surrogate of the IGHV status or if epigenetic classification adds an additional prognostic value. In our cohort, IGHV status information was available for 62 patients. Using Kaplan-Meier analysis for these 62 patients revealed a slightly better performance of the epigenetic classification m-CLL versus n-CLL compared to IGHV-U versus IGHV-M. This might be due to the introduction of a third, intermediate group (i-CLL), with intermediate prognosis.
Wojdacz et al 8 found that epigenetic grouping was capable of distinguishing IGHV-M cases into clinically relevant subgroups and that m-CLL was a marker of prolonged survival for patients treated with chemo-immunotherapy. However, none of the previous studies directly compared the IGHV-classification with the epigenetic classification. To finally answer the question if the 5 epigenetic marker set is superior to the IGHV system or if both classifications should be applied in parallel, even larger analyses and meta-analyses are required.
In addition, we observed an association of m-CLL with the presence of isolated del13q, as was reported previously.7,8 In contrast to previous studies, we did not observe any associations of the epigenetic subgroups with del11q and tri12,6-8 potentially due to the small sample size of our cohort. We observed an association of the n-CLL subgroup with a complex karyotype, which was not analyzed in previous studies. However, the karyotype might be related to disease stage since most of the n-CLL patients were sampled after treatment start, whereas most of the m-CLL cases were sampled before treatment start.
The fact that most of the n-CLL patients were sampled after treatment start whereas most of the m-CLL patients were sampled before might suggest a bias in sampling time. However, neither the age at sampling nor the time from diagnosis to sampling was significantly different and therefore a bias in sampling time is not supported. The observed difference in sampling time with regard to treatment between the epigenetic groups rather reflects the prognostic value of the epigenetic classification system.
Recently an additional marker set of 18 CpGs was proposed for epigenetic classification of CLL patients. 15 Although in a clinical setting testing 5 CpGs instead of 18 is favorable, a comparison of both marker sets in future studies would be interesting. In particular, it is of interest if the 18 marker set is associated with treatment response and may therefore aid in treatment decisions.
During the revision process of this publication, another epigenetic score system was published, assessing the DNA methylation of 9 CpGs that are highly associated with the IGHV-status. 16 When at least 2 of the 9 CpGs showed the risk profile, the patient was classified as having a poor prognosis. This scoring system was shown to be superior to IGHV-classification for time to treatment and overall survival, when the widely used 98% germline similarity cut off was used. The superior performance of the 9 CpG set was due to 17 discordant cases out of 114 (15%). Interestingly, most of the discordant cases displayed IGHV germline similarities of 97% to 98%. Here a change of the similarity cut off or the generation of a third prognostic group might increase the prognostic value of the IGHV status. However, for the 9 marker set to date no clinically applicable assays have been developed, although a Methylation-Sensitive High Resolution (MS-HRM) Assay 17 has been developed for 4 of the 9 CpGs. 16
The epigenetic classification system consisting of 5 markers has the potential to be clinically used since it is relatively easy to apply. Required steps are isolation of genomic DNA, bisulfite treatment (or enzymatic conversion) of genomic DNA, PCR using 1 biotinylated primer and pyrosequencing and a straight-forward bioinformatics analysis. As such the complete process can be done in 2 to 3 days. A drawback might be that a pyrosequencing machine is required for assessing the 5 marker set.
In comparison, whole genome methylation analyses are expensive, take longer time and require a more sophisticated bioinformatics analysis and are until now only suitable for explorative studies but not for clinical routine diagnostics.
IGHV profiling is relatively easy to apply and today routinely used in the clinical setting using PCR amplification and Sanger sequencing.10,18 Newer approaches also use next generation sequencing. However, to day, standardized NGS protocols for IGHV-seq are still lacking, although the advantage of IGHV-seq is the assessment of satellite clones which are hardly accessible using Sanger sequencing. 18 In summary, the work load and the subsequent analysis steps are similar between IGHV-status determination followed by Sanger sequencing and pyrosequencing of the 5 marker set.
We thus confirmed the prognostic value of the epigenetic classification for CLL, and have shown that it is beneficial for patient stratification in the clinic.
Supplemental Material
sj-jpg-2-bmi-10.1177_11772719211067972 – Supplemental material for Evaluation of a Prognostic Epigenetic Classification System in Chronic Lymphocytic Leukemia Patients
Supplemental material, sj-jpg-2-bmi-10.1177_11772719211067972 for Evaluation of a Prognostic Epigenetic Classification System in Chronic Lymphocytic Leukemia Patients by Christina Grimm, Carmen Diana Herling, Anastasia Komnidi, Michelle Hussong, Karl-Anton Kreuzer, Michael Hallek and Michal R. Schweiger in Biomarker Insights
Supplemental Material
sj-xlsx-1-bmi-10.1177_11772719211067972 – Supplemental material for Evaluation of a Prognostic Epigenetic Classification System in Chronic Lymphocytic Leukemia Patients
Supplemental material, sj-xlsx-1-bmi-10.1177_11772719211067972 for Evaluation of a Prognostic Epigenetic Classification System in Chronic Lymphocytic Leukemia Patients by Christina Grimm, Carmen Diana Herling, Anastasia Komnidi, Michelle Hussong, Karl-Anton Kreuzer, Michael Hallek and Michal R. Schweiger in Biomarker Insights
Footnotes
Acknowledgements
We are grateful to the patients and their families for their contribution to this study.
Declaration of conflicting interests:
The author(s) declared the following potential conflicts of interest with respect to the research, authorship, and/or publication of this article: M. Ha. received research funding, consulting, and lecture fees from Roche, Abbvie, Gilead, Janssen, Celgene, and Astra Zeneca. The remaining authors declare no competing interests.
Funding:
The author(s) disclosed receipt of the following financial support for the research, authorship, and/or publication of this article: The study was funded by the German Research Foundation: KFO286 -RP8/SCHW1605/1-1 to M.R.S., KFO-286-RP6 to M. Ha., KFO-286-CP to C.D.H., the Volkswagen Stiftung Lichtenberg program to M.R.S. and the Center for Molecular Medicine CMMC (A12 to M.R.S.).
Author Note
The study was approved by the Ethics Committee of the University of Cologne (Ethikvotum 11-319 from 11th December 2011, with an amendment from 7th June 2016). Informed consent has been obtained from all patients involved.
Author Contributions
Acquisition of data A.K. and C.G.; analysis of data C.G. and M. Hu.; collection of specimens and clinical Data C.D.H., A.K.K., and M. Ha.; drafting of the manuscript C.G. and M.R.S.; reviewing of the manuscript C.G., C.D.H. A.K., A.K.K., M. Hu., M. Ha., and M.R.S.; supervision M. Ha. and M.R.S.; study design and coordination C.G., C.D.H., and M.R.S.
Availability of Data and Materials
All data generated or analyzed during this study are included in this published article and its supplementary information files.
Supplemental Material
Supplemental material for this article is available online.
References
Supplementary Material
Please find the following supplemental material available below.
For Open Access articles published under a Creative Commons License, all supplemental material carries the same license as the article it is associated with.
For non-Open Access articles published, all supplemental material carries a non-exclusive license, and permission requests for re-use of supplemental material or any part of supplemental material shall be sent directly to the copyright owner as specified in the copyright notice associated with the article.